Click a season to open this player’s full game log, splits and advanced stats for that year; click a team to open its page. A dash means no NBA games were recorded.
03 / EVERY CATEGORY THE PROVIDER REPORTS
Full statistical breakdown
Regular season 2026-27
Defensive
Metric
Total
NBA rank
Blocks
0
Tied-370th
Defensive Rebounds
13
Tied-302nd
Steals
7
Tied-193rd
Defensive Rebound Rate
0.0
—
Defensive Rebounds Per Game
1.2
Tied-255th
Blocks Per Game
0.0
Tied-269th
Steals Per Game
0.6
173rd
Defensive Rebounds Per 48
3.7
3,624th
Blocks Per 48
0.0
4,440th
Steals Per 48
2.0
2,316th
General
Metric
Total
NBA rank
Disqualifications
0
Tied-21st
Flagrant Fouls
0
Tied-22nd
Fouls
21
Tied-198th
Player Efficiency Rating
10.20
239th
Rebound Rate
0.0
—
Ejections
0
Tied-7th
Technical Fouls
0
Tied-101st
Rebounds
20
—
Value Over Replacement Player
-1.5
—
Minutes
170
Tied-4th
Minutes Per Game
15.5
—
Rating
10.0
Tied-136th
Plus-Minus
+12
Tied-1st
Rebounds Per Game
1.8
251st
Fouls Per Game
1.9
Tied-182nd
Flagrant Fouls Per Game
0.0
Tied-19th
Technical Fouls Per Game
0.0
Tied-82nd
Ejections Per Game
0.0
Tied-6th
Disqualifications Per Game
0.0
Tied-20th
Assist To Turnover Ratio
2.3
—
Steal To Foul Ratio
0.3
—
Block To Foul Ratio
0.0
—
Team Rebounds Per Game
0.0
—
Rebounds
20
—
Total Technical Fouls
0
—
Assist To Turnover Ratio
0.0
—
Steal To Turnover Ratio
1.2
—
Rebounds Per 48 Minutes
5.6
—
Fouls Per 48 Minutes
5.9
2,376th
Flagrant Fouls Per 48 Minutes
0.0
264th
Technical Fouls Per 48 Minutes
0.0
1,212th
Ejections Per 48 Minutes
0.0
84th
Disqualifications Per 48 Minutes
0.0
252nd
R/40
4.7
—
Games Played
11
11th
Games Started
0
Tied-257th
Double Double
0
Tied-119th
Triple Double
0
Tied-12th
Offensive
Metric
Total
NBA rank
Assists
14
Tied-238th
Effective Field Goal Percentage
50.0
—
Field Goals
21/57
—
Field Goals Attempted
57
Tied-239th
Field Goals Made
21
Tied-266th
Field Goal Percentage
36.8
—
Free Throws
10/12
—
Free Throw Percentage
83.3
Tied-93rd
Free Throws Attempted
12
Tied-235th
Free Throws Made
10
Tied-224th
Offensive Rebounds
7
Tied-230th
Points
67
Tied-245th
Turnovers
6
Tied-275th
3-Point Field Goal Percentage
35.7
Tied-128th
3-Point Field Goals Attempted
42
Tied-158th
3-Point Field Goals Made
15
Tied-144th
True Shooting Percentage
53.8
—
Total Turnovers
6
—
Assist Ratio
17.0
—
Points in the Paint
0
Tied-1st
Offensive Rebound Rate
0.0
—
Turnover Ratio
7.3
—
Brick Index
0.00
—
Usage Rate
0.0
—
Average Field Goals Made
1.9
—
Average Field Goals Attempted
5.2
Tied-219th
Average 3-Point Field Goals Made
1.4
Tied-135th
Average 3-Point Field Goals Attempted
3.8
130th
Average Free Throws Made
0.9
—
Average Free Throws Attempted
1.1
Tied-209th
Points Per Game
6.1
219th
Offensive Rebounds Per Game
0.6
Tied-204th
Assists Per Game
1.3
Tied-211th
Turnovers Per Game
0.5
240th
Offensive Rebound Percentage
0.2
—
Estimated Possessions
60.8
—
Estimated Possessions Per Game
5.5
—
Points Per Estimated Possession
1.1
—
Team Turnovers Per Game
0.0
—
Total Turnovers Per Game
0.5
—
3-Point Field Goal Percentage
35.7
106th
2-Point Field Goals Made
6.0
Tied-122nd
2-Point Field Goals Attempted
15.0
Tied-81st
2-Point Field Goals Made per Game
0.5
—
2-Point Field Goals Attempted per Game
1.4
—
2-Point Field Goal Percentage
40.0
—
Shooting Efficiency
0.50
—
Scoring Efficiency
1.175
—
Fieldgoals Made Per 48
5.9
3,192nd
Fieldgoals Attempted Per 48
16.1
2,868th
3-Point Fieldgoals Made Per 48
4.2
1,728th
3-Point Fieldgoals Attempted Per 48
11.9
1,896th
Freethrows Made Per 48
2.8
2,688th
Freethrows Attempted Per 48
3.4
2,820th
Points Scored Per 48
18.9
2,940th
Offensive Rebounds Per 48
2.0
2,760th
Assists Per 48
4.0
2,856th
Turnovers
1.7
3,300th
P/40
15.8
—
A/40
3.3
—
04 / EFFICIENCY, SHOOTING PROFILE, PER-36
Advanced metrics
True shooting %53.7%
Effective FG %50.0%
2-point FG %35.7%
3-point attempt rate73.1%
Free throw rate21.2%
Points per shot attempt1.17
% of points from 3s68.9%
Assist-to-turnover2.60
Points per 36 min14.2
Rebounds per 36 min4.2
Assists per 36 min3.0
Steals per 36 min1.39
Blocks per 36 min0.00
Turnovers per 36 min1.16
Stocks (STL + BLK) per game0.60
Pts + Reb + Ast per game9.2
Efficiency (EFF) per game5.8
Game Score per game (Hollinger)4.2
Minutes per game15.5
Calculated by BallersCulture from the supplied 2026-27 box-score totals using standard formulas (hover a tile to see the formula). Tracking-based metrics such as BPM, VORP, on/off and RAPTOR are not available from this data source.
05 / 11 GAMES IN 2026-27
Game log: Regular season
Date
Opp
Result
MIN
FG
FG%
3PT
3P%
FT
FT%
REB
AST
BLK
STL
PF
TO
PTS
Nov 15
vs DET
W 137-117
26
3-10
30.0
2-7
28.6
1-2
50.0
4
1
0
1
3
1
9
Nov 14
vs CLE
W 133-121
33
6-12
50.0
4-9
44.4
4-4
100.0
5
2
0
0
3
2
20
Nov 11
@ UTAH
W 115-109
21
1-7
14.3
1-6
16.7
2-2
100.0
4
2
0
0
3
0
5
Nov 9
@ SAC
W 114-108
19
2-5
40.0
2-5
40.0
0-0
0.0
2
2
0
1
3
2
6
Nov 6
@ GS
L 120-100
30
4-9
44.4
3-6
50.0
2-2
100.0
1
2
0
3
2
0
13
Nov 5
@ LAC
W 117-116 OT
17
0-3
0.0
0-2
0.0
0-0
0.0
2
2
0
0
3
1
0
Nov 3
@ LAL
L 138-117
8
2-4
50.0
1-3
33.3
0-0
0.0
1
1
0
1
2
0
5
Oct 31
vs IND
W 145-125
7
1-2
50.0
1-1
100.0
1-2
50.0
0
0
0
1
1
0
4
Oct 25
@ CHA
L 115-110
4
1-2
50.0
1-1
100.0
0-0
0.0
1
0
0
0
0
0
3
Oct 24
vs DET
L 128-111
3
1-2
50.0
0-1
0.0
0-0
0.0
0
0
0
0
0
0
2
Oct 22
vs MIN
L 131-106
3
0-1
0.0
0-1
0.0
0-0
0.0
0
2
0
0
1
0
0
06 / 2026-27 HOME / AWAY, RESULTS, MONTHS AND OPPONENTS
Splits
split
Split
GP
MIN
FG
FG%
3PT
3P%
FT
FT%
OR
DR
REB
AST
BLK
STL
PF
TO
PTS
All Splits
11
15.5
1.9-5.2
36.8
1.4-3.8
35.7
0.9-1.1
83.3
0.6
1.2
1.8
1.3
0.0
0.6
1.9
0.5
6.1
Home
5
14.2
2.2-5.4
40.7
1.4-3.8
36.8
1.2-1.6
75.0
1.0
0.8
1.8
1.0
0.0
0.4
1.6
0.6
7.0
Road
6
16.5
1.7-5.0
33.3
1.3-3.8
34.8
0.7-0.7
100.0
0.3
1.5
1.8
1.5
0.0
0.8
2.2
0.5
5.3
vs. Division
1
4.0
1.0-2.0
50.0
1.0-1.0
100.0
0.0-0.0
0.0
0.0
1.0
1.0
0.0
0.0
0.0
0.0
0.0
3.0
vs. Conference
5
14.4
2.4-5.6
42.9
1.6-3.8
42.1
1.2-1.6
75.0
1.0
1.0
2.0
0.6
0.0
0.4
1.4
0.6
7.6
3+ Days Rest
2
5.0
0.5-1.5
33.3
0.5-1.0
50.0
0.5-1.0
50.0
0.0
0.0
0.0
1.0
0.0
0.5
1.0
0.0
2.0
Month
Split
GP
MIN
FG
FG%
3PT
3P%
FT
FT%
OR
DR
REB
AST
BLK
STL
PF
TO
PTS
October
4
4.3
0.8-1.8
42.9
0.5-1.0
50.0
0.3-0.5
50.0
0.0
0.3
0.3
0.5
0.0
0.3
0.5
0.0
2.3
November
7
22.0
2.6-7.1
36.0
1.9-5.4
34.2
1.3-1.4
90.0
1.0
1.7
2.7
1.7
0.0
0.9
2.7
0.9
8.3
Pre All-Star
11
15.5
1.9-5.2
36.8
1.4-3.8
35.7
0.9-1.1
83.3
0.6
1.2
1.8
1.3
0.0
0.6
1.9
0.5
6.1
Result
Split
GP
MIN
FG
FG%
3PT
3P%
FT
FT%
OR
DR
REB
AST
BLK
STL
PF
TO
PTS
Wins
6
20.5
2.2-6.5
33.3
1.7-5.0
33.3
1.3-1.7
80.0
0.8
2.0
2.8
1.5
0.0
0.5
2.7
1.0
7.3
Losses
5
9.6
1.6-3.6
44.4
1.0-2.4
41.7
0.4-0.4
100.0
0.4
0.2
0.6
1.0
0.0
0.8
1.0
0.0
4.6
Day
Split
GP
MIN
FG
FG%
3PT
3P%
FT
FT%
OR
DR
REB
AST
BLK
STL
PF
TO
PTS
Monday
1
8.0
2.0-4.0
50.0
1.0-3.0
33.3
0.0-0.0
0.0
1.0
0.0
1.0
1.0
0.0
1.0
2.0
0.0
5.0
Tuesday
1
21.0
1.0-7.0
14.3
1.0-6.0
16.7
2.0-2.0
100.0
0.0
4.0
4.0
2.0
0.0
0.0
3.0
0.0
5.0
Wednesday
2
10.0
0.0-2.0
0.0
0.0-1.5
0.0
0.0-0.0
0.0
0.0
1.0
1.0
2.0
0.0
0.0
2.0
0.5
0.0
Thursday
1
30.0
4.0-9.0
44.4
3.0-6.0
50.0
2.0-2.0
100.0
1.0
0.0
1.0
2.0
0.0
3.0
2.0
0.0
13.0
Friday
3
14.0
2.7-5.3
50.0
1.7-3.7
45.5
1.7-2.0
83.3
0.7
1.0
1.7
0.7
0.0
0.3
1.3
0.7
8.7
Saturday
2
15.0
2.0-6.0
33.3
1.5-4.0
37.5
0.5-1.0
50.0
1.5
1.0
2.5
0.5
0.0
0.5
1.5
0.5
6.0
Sunday
1
19.0
2.0-5.0
40.0
2.0-5.0
40.0
0.0-0.0
0.0
0.0
2.0
2.0
2.0
0.0
1.0
3.0
2.0
6.0
Opponent
Split
GP
MIN
FG
FG%
3PT
3P%
FT
FT%
OR
DR
REB
AST
BLK
STL
PF
TO
PTS
Charlotte Hornets
1
4.0
1.0-2.0
50.0
1.0-1.0
100.0
0.0-0.0
0.0
0.0
1.0
1.0
0.0
0.0
0.0
0.0
0.0
3.0
Cleveland Cavaliers
1
33.0
6.0-12.0
50.0
4.0-9.0
44.4
4.0-4.0
100.0
2.0
3.0
5.0
2.0
0.0
0.0
3.0
2.0
20.0
Detroit Pistons
2
14.0
2.0-6.0
33.3
1.0-4.0
25.0
0.5-1.0
50.0
1.5
0.5
2.0
0.5
0.0
0.5
1.5
0.5
5.5
Golden State Warriors
1
30.0
4.0-9.0
44.4
3.0-6.0
50.0
2.0-2.0
100.0
1.0
0.0
1.0
2.0
0.0
3.0
2.0
0.0
13.0
Indiana Pacers
1
7.0
1.0-2.0
50.0
1.0-1.0
100.0
1.0-2.0
50.0
0.0
0.0
0.0
0.0
0.0
1.0
1.0
0.0
4.0
Los Angeles Clippers
1
17.0
0.0-3.0
0.0
0.0-2.0
0.0
0.0-0.0
0.0
0.0
2.0
2.0
2.0
0.0
0.0
3.0
1.0
0.0
Los Angeles Lakers
1
8.0
2.0-4.0
50.0
1.0-3.0
33.3
0.0-0.0
0.0
1.0
0.0
1.0
1.0
0.0
1.0
2.0
0.0
5.0
Minnesota Timberwolves
1
3.0
0.0-1.0
0.0
0.0-1.0
0.0
0.0-0.0
0.0
0.0
0.0
0.0
2.0
0.0
0.0
1.0
0.0
0.0
Sacramento Kings
1
19.0
2.0-5.0
40.0
2.0-5.0
40.0
0.0-0.0
0.0
0.0
2.0
2.0
2.0
0.0
1.0
3.0
2.0
6.0
Utah Jazz
1
21.0
1.0-7.0
14.3
1.0-6.0
16.7
2.0-2.0
100.0
0.0
4.0
4.0
2.0
0.0
0.0
3.0
0.0
5.0
07 / SEASON-BY-SEASON HISTORY
Career statistics
Regular Season Averages
Season
Team
GP
GS
MIN
FG
FG%
3PT
3P%
FT
FT%
OR
DR
REB
AST
BLK
STL
PF
TO
PTS
2026-27
Miami Heat
11
0
15.5
1.9-5.2
36.8
1.4-3.8
35.7
0.9-1.1
83.3
0.6
1.2
1.8
1.3
0.0
0.6
1.9
0.5
6.1
Career
—
11
0
15.5
1.9-5.2
36.8
1.4-3.8
35.7
0.9-1.1
83.3
0.6
1.2
1.8
1.3
0.0
0.6
1.9
0.5
6.1
Regular Season Totals
Season
Team
FG
FG%
3PT
3P%
FT
FT%
OR
DR
REB
AST
BLK
STL
PF
TO
PTS
2026-27
Miami Heat
21-57
36.8
15-42
35.7
10-12
83.3
7
13
20
14
0
7
21
6
67
Career
—
21-57
36.8
15-42
35.7
10-12
83.3
7
13
20
14
0
7
21
6
67
Regular Season Misc Totals
Season
Team
DD2
TD3
DQ
EJECT
TECH
FLAG
AST/TO
STL/TO
SC-EFF
SH-EFF
2026-27
Miami Heat
0
0
0
0
0
0
2.3
1.2
1.175
0.50
Career
—
0
0
0
0
0
0
2.3
1.2
1.175
0.50
08 / SHOT CHART AND ZONE SHOOTING
Shot profile
Shot-location data is not connected. Add a BALLDONTLIE GOAT-tier NBA API key in NBA Players → Settings to enable shot charts and zone shooting.
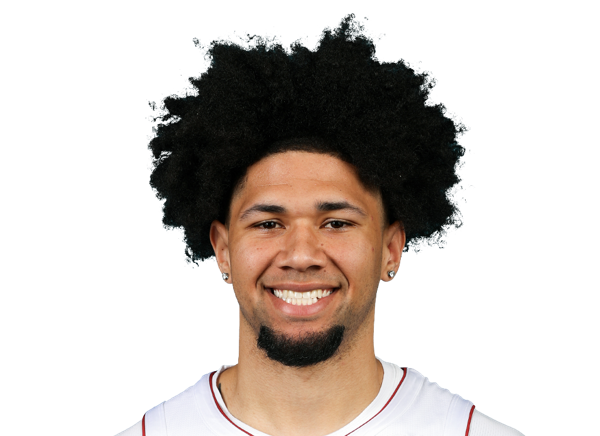
LATEST UPDATEConwell supplied 20 points (6-12 FG, 4-9 3Pt, 4-4 FT), five rebounds and two assists in 33 minutes during Friday's 133-121 victory over the Cavaliers.
Conwell's perimeter shooting should give him guaranteed minutes in the rotation, and he should thrive alongside Giannis Antetokounmpo and Bam Adebayo, whose ability to draw defenders into the paint creates outside opportunities. The 33-minute workload was encouraging for the young guard, and his three-point production offers a route to fantasy relevance in deeper leagues. That said, limited playmaking and defensive contributions leave him dependent on scoring efficiency alone to be valuable in most formats. With just two double-digit scoring appearances this season, Conwell isn't ready to be a regular fantasy contributor yet, even if he's showing glimpses of what he can bring to the table here and there.



 Andrew WigginsF #22
 Bam AdebayoC #13
 Bez MbengG #19
 Bobby PortisF #95
 Bobby Portis Jr.F #95
 Davion MitchellG #2
 Dennis Smith Jr.G
 Dru SmithG #12
 Ezra AusarF
 Gabe MadsenG
 Giannis AntetokounmpoF #7
 Ian SchieffelinF #20
 J’Vonne HadleyF #14
 Jahmir YoungG #17
 Keshad JohnsonF #16
 Klay ThompsonG #11
 Kylor KelleyC
 Lamar WilkersonG #3
 Lester QuinonesG #25
 Myron GardnerF #15
 Nick RichardsC #8
 Nikola JovicF #5
 Pelle LarssonG #9
 Simone FontecchioF
 Tim Hardaway Jr.G #10
 Tre DonaldsonG #24