Click a season to open this player’s full game log, splits and advanced stats for that year; click a team to open its page. A dash means no NBA games were recorded.
03 / EVERY CATEGORY THE PROVIDER REPORTS
Full statistical breakdown
Regular season 2026-27
Defensive
Metric
Total
NBA rank
Blocks
0
Tied-376th
Defensive Rebounds
2
Tied-408th
Steals
0
Tied-405th
Defensive Rebound Rate
0.0
—
Defensive Rebounds Per Game
0.3
—
Blocks Per Game
0.0
—
Steals Per Game
0.0
—
Defensive Rebounds Per 48
7.4
2,797th
Blocks Per 48
0.0
2,578th
Steals Per 48
0.0
2,777th
General
Metric
Total
NBA rank
Disqualifications
0
Tied-22nd
Flagrant Fouls
0
Tied-24th
Fouls
1
Tied-425th
Player Efficiency Rating
19.24
—
Rebound Rate
0.0
—
Ejections
0
Tied-7th
Technical Fouls
0
Tied-104th
Rebounds
2
—
Value Over Replacement Player
1.7
—
Minutes
13
Tied-7th
Minutes Per Game
2.2
—
Rating
2.2
Tied-382nd
Plus-Minus
-1
Tied-1st
Rebounds Per Game
0.3
—
Fouls Per Game
0.2
—
Flagrant Fouls Per Game
0.0
—
Technical Fouls Per Game
0.0
—
Ejections Per Game
0.0
—
Disqualifications Per Game
0.0
—
Assist To Turnover Ratio
1.0
—
Steal To Foul Ratio
0.0
—
Block To Foul Ratio
0.0
—
Team Rebounds Per Game
0.0
—
Rebounds
2
—
Total Technical Fouls
0
—
Assist To Turnover Ratio
0.0
—
Steal To Turnover Ratio
0.0
—
Rebounds Per 48 Minutes
7.4
—
Fouls Per 48 Minutes
3.7
2,914th
Flagrant Fouls Per 48 Minutes
0.0
164th
Technical Fouls Per 48 Minutes
0.0
713th
Ejections Per 48 Minutes
0.0
48th
Disqualifications Per 48 Minutes
0.0
150th
R/40
6.2
—
Games Played
6
6th
Games Started
0
Tied-258th
Double Double
0
Tied-121st
Triple Double
0
Tied-13th
Offensive
Metric
Total
NBA rank
Assists
1
Tied-408th
Effective Field Goal Percentage
116.7
—
Field Goals
3/3
—
Field Goals Attempted
3
Tied-438th
Field Goals Made
3
Tied-407th
Field Goal Percentage
100.0
—
Free Throws
0/0
—
Free Throw Percentage
0.0
—
Free Throws Attempted
0
Tied-422nd
Free Throws Made
0
Tied-416th
Offensive Rebounds
0
Tied-427th
Points
7
Tied-419th
Turnovers
1
Tied-408th
3-Point Field Goal Percentage
100.0
—
3-Point Field Goals Attempted
1
Tied-397th
3-Point Field Goals Made
1
Tied-353rd
True Shooting Percentage
116.7
—
Total Turnovers
1
—
Assist Ratio
20.0
—
Points in the Paint
0
Tied-1st
Offensive Rebound Rate
0.0
—
Turnover Ratio
20.0
—
Brick Index
0.00
—
Usage Rate
0.0
—
Average Field Goals Made
0.5
—
Average Field Goals Attempted
0.5
—
Average 3-Point Field Goals Made
0.2
—
Average 3-Point Field Goals Attempted
0.2
—
Average Free Throws Made
0.0
—
Average Free Throws Attempted
0.0
—
Points Per Game
1.2
—
Offensive Rebounds Per Game
0.0
—
Assists Per Game
0.2
—
Turnovers Per Game
0.2
—
Offensive Rebound Percentage
0.0
—
Estimated Possessions
4.0
—
Estimated Possessions Per Game
0.7
—
Points Per Estimated Possession
1.8
—
Team Turnovers Per Game
0.0
—
Total Turnovers Per Game
0.2
—
3-Point Field Goal Percentage
100.0
—
2-Point Field Goals Made
2.0
Tied-54th
2-Point Field Goals Attempted
2.0
Tied-41st
2-Point Field Goals Made per Game
0.3
—
2-Point Field Goals Attempted per Game
0.3
—
2-Point Field Goal Percentage
100.0
—
Shooting Efficiency
1.17
—
Scoring Efficiency
2.333
—
Fieldgoals Made Per 48
11.1
2,790th
Fieldgoals Attempted Per 48
11.1
3,003rd
3-Point Fieldgoals Made Per 48
3.7
2,420th
3-Point Fieldgoals Attempted Per 48
3.7
2,722nd
Freethrows Made Per 48
0.0
2,852nd
Freethrows Attempted Per 48
0.0
2,893rd
Points Scored Per 48
25.8
2,873rd
Offensive Rebounds Per 48
0.0
2,928th
Assists Per 48
3.7
2,797th
Turnovers
3.7
2,797th
P/40
21.5
—
A/40
3.1
—
04 / EFFICIENCY, SHOOTING PROFILE, PER-36
Advanced metrics
True shooting %120.0%
Effective FG %120.0%
2-point FG %100.0%
3-point attempt rate40.0%
Free throw rate0.0%
Points per shot attempt2.40
% of points from 3s50.0%
Assist-to-turnover1.00
Points per 36 min19.6
Rebounds per 36 min4.9
Assists per 36 min3.3
Steals per 36 min0.00
Blocks per 36 min0.00
Turnovers per 36 min3.27
Stocks (STL + BLK) per game0.00
Pts + Reb + Ast per game1.7
Efficiency (EFF) per game1.5
Game Score per game (Hollinger)1.0
Minutes per game2.2
Calculated by BallersCulture from the supplied 2026-27 box-score totals using standard formulas (hover a tile to see the formula). Tracking-based metrics such as BPM, VORP, on/off and RAPTOR are not available from this data source.
05 / 6 GAMES IN 2026-27
Game log: Regular season
Date
Opp
Result
MIN
FG
FG%
3PT
3P%
FT
FT%
REB
AST
BLK
STL
PF
TO
PTS
Nov 17
vs HOU
W 128-110
3
0-0
0.0
0-0
0.0
0-0
0.0
0
0
0
0
1
0
0
Nov 6
@ GS
L 120-100
1
0-0
0.0
0-0
0.0
0-0
0.0
0
0
0
0
0
0
0
Nov 3
@ LAL
L 138-117
1
0-0
0.0
0-0
0.0
0-0
0.0
1
0
0
0
0
0
0
Oct 31
vs IND
W 145-125
2
0-0
0.0
0-0
0.0
0-0
0.0
0
0
0
0
0
1
0
Oct 24
vs DET
L 128-111
3
1-1
100.0
1-1
100.0
0-0
0.0
0
1
0
0
0
0
3
Oct 22
vs MIN
L 131-106
3
2-2
100.0
0-0
0.0
0-0
0.0
1
0
0
0
0
0
4
06 / 2026-27 HOME / AWAY, RESULTS, MONTHS AND OPPONENTS
Splits
split
Split
GP
MIN
FG
FG%
3PT
3P%
FT
FT%
OR
DR
REB
AST
BLK
STL
PF
TO
PTS
All Splits
6
2.2
0.5-0.5
100.0
0.2-0.2
100.0
0.0-0.0
0.0
0.0
0.3
0.3
0.2
0.0
0.0
0.2
0.2
1.2
Home
4
2.8
0.8-0.8
100.0
0.3-0.3
100.0
0.0-0.0
0.0
0.0
0.3
0.3
0.3
0.0
0.0
0.3
0.3
1.8
Road
2
1.5
0.0-0.0
0.0
0.0-0.0
0.0
0.0-0.0
0.0
0.0
0.5
0.5
0.0
0.0
0.0
0.0
0.0
0.0
vs. Conference
2
2.0
0.5-0.5
100.0
0.5-0.5
100.0
0.0-0.0
0.0
0.0
0.0
0.0
0.5
0.0
0.0
0.0
0.5
1.5
3+ Days Rest
3
2.7
0.7-0.7
100.0
0.0-0.0
0.0
0.0-0.0
0.0
0.0
0.3
0.3
0.0
0.0
0.0
0.3
0.3
1.3
Month
Split
GP
MIN
FG
FG%
3PT
3P%
FT
FT%
OR
DR
REB
AST
BLK
STL
PF
TO
PTS
October
3
2.7
1.0-1.0
100.0
0.3-0.3
100.0
0.0-0.0
0.0
0.0
0.3
0.3
0.3
0.0
0.0
0.0
0.3
2.3
November
3
1.7
0.0-0.0
0.0
0.0-0.0
0.0
0.0-0.0
0.0
0.0
0.3
0.3
0.0
0.0
0.0
0.3
0.0
0.0
Pre All-Star
6
2.2
0.5-0.5
100.0
0.2-0.2
100.0
0.0-0.0
0.0
0.0
0.3
0.3
0.2
0.0
0.0
0.2
0.2
1.2
Result
Split
GP
MIN
FG
FG%
3PT
3P%
FT
FT%
OR
DR
REB
AST
BLK
STL
PF
TO
PTS
Wins
2
2.5
0.0-0.0
0.0
0.0-0.0
0.0
0.0-0.0
0.0
0.0
0.0
0.0
0.0
0.0
0.0
0.5
0.5
0.0
Losses
4
2.0
0.8-0.8
100.0
0.3-0.3
100.0
0.0-0.0
0.0
0.0
0.5
0.5
0.3
0.0
0.0
0.0
0.0
1.8
Day
Split
GP
MIN
FG
FG%
3PT
3P%
FT
FT%
OR
DR
REB
AST
BLK
STL
PF
TO
PTS
Monday
2
2.0
0.0-0.0
0.0
0.0-0.0
0.0
0.0-0.0
0.0
0.0
0.5
0.5
0.0
0.0
0.0
0.5
0.0
0.0
Wednesday
1
3.0
2.0-2.0
100.0
0.0-0.0
0.0
0.0-0.0
0.0
0.0
1.0
1.0
0.0
0.0
0.0
0.0
0.0
4.0
Thursday
1
1.0
0.0-0.0
0.0
0.0-0.0
0.0
0.0-0.0
0.0
0.0
0.0
0.0
0.0
0.0
0.0
0.0
0.0
0.0
Friday
2
2.0
0.5-0.5
100.0
0.5-0.5
100.0
0.0-0.0
0.0
0.0
0.0
0.0
0.5
0.0
0.0
0.0
0.5
1.5
Opponent
Split
GP
MIN
FG
FG%
3PT
3P%
FT
FT%
OR
DR
REB
AST
BLK
STL
PF
TO
PTS
Detroit Pistons
1
3.0
1.0-1.0
100.0
1.0-1.0
100.0
0.0-0.0
0.0
0.0
0.0
0.0
1.0
0.0
0.0
0.0
0.0
3.0
Golden State Warriors
1
1.0
0.0-0.0
0.0
0.0-0.0
0.0
0.0-0.0
0.0
0.0
0.0
0.0
0.0
0.0
0.0
0.0
0.0
0.0
Houston Rockets
1
3.0
0.0-0.0
0.0
0.0-0.0
0.0
0.0-0.0
0.0
0.0
0.0
0.0
0.0
0.0
0.0
1.0
0.0
0.0
Indiana Pacers
1
2.0
0.0-0.0
0.0
0.0-0.0
0.0
0.0-0.0
0.0
0.0
0.0
0.0
0.0
0.0
0.0
0.0
1.0
0.0
Los Angeles Lakers
1
1.0
0.0-0.0
0.0
0.0-0.0
0.0
0.0-0.0
0.0
0.0
1.0
1.0
0.0
0.0
0.0
0.0
0.0
0.0
Minnesota Timberwolves
1
3.0
2.0-2.0
100.0
0.0-0.0
0.0
0.0-0.0
0.0
0.0
1.0
1.0
0.0
0.0
0.0
0.0
0.0
4.0
07 / SEASON-BY-SEASON HISTORY
Career statistics
Regular Season Averages
Season
Team
GP
GS
MIN
FG
FG%
3PT
3P%
FT
FT%
OR
DR
REB
AST
BLK
STL
PF
TO
PTS
2020-21
Charlotte Hornets
18
0
3.5
0.2-0.5
44.4
0.0-0.1
0.0
0.4-0.6
63.6
0.2
0.4
0.6
0.1
0.0
0.0
0.4
0.2
0.8
2021-22
Charlotte Hornets
50
5
7.3
1.2-1.8
66.7
0.0-0.0
0.0
0.6-0.9
69.8
0.7
1.0
1.7
0.3
0.4
0.2
1.0
0.5
3.0
2022-23
Charlotte Hornets
65
9
18.7
3.0-4.8
62.9
0.0-0.0
100.0
2.1-2.8
74.9
2.3
4.1
6.4
0.6
1.1
0.2
2.4
0.9
8.2
2023-24
Charlotte Hornets
67
51
26.3
3.9-5.6
69.1
0.0-0.0
0.0
2.0-2.7
73.7
2.6
5.5
8.0
0.8
1.1
0.4
2.6
1.1
9.7
2024-25
Charlotte Hornets
21
9
21.0
3.0-5.4
56.1
0.0-0.0
0.0
2.8-4.1
67.8
2.4
5.1
7.5
1.3
1.2
0.3
2.3
1.6
8.9
2024-25
Phoenix Suns
36
34
22.7
3.9-6.5
60.5
0.0-0.0
0.0
1.7-2.0
82.2
2.7
5.9
8.6
0.6
0.8
0.2
2.6
1.3
9.5
2024-25
2024 25 Totals
57
43
22.0
3.6-6.1
59.1
0.0-0.0
0.0
2.1-2.8
74.4
2.6
5.6
8.2
0.9
1.0
0.2
2.5
1.4
9.3
2025-26
Phoenix Suns
28
2
9.1
1.3-2.5
49.3
0.0-0.0
0.0
0.7-1.0
67.9
1.3
2.0
3.3
0.3
0.5
0.1
1.4
0.9
3.2
2025-26
Chicago Bulls
20
4
22.4
3.4-6.5
52.3
0.3-0.9
27.8
2.3-3.7
63.0
2.1
5.5
7.6
0.4
0.9
0.3
2.5
1.7
9.4
2025-26
2025 26 Totals
48
6
14.6
2.1-4.2
51.2
0.1-0.4
27.8
1.4-2.1
64.4
1.6
3.5
5.1
0.3
0.7
0.2
1.8
1.2
5.8
2026-27
Miami Heat
6
0
2.2
0.5-0.5
100.0
0.2-0.2
100.0
0.0-0.0
0.0
0.0
0.3
0.3
0.2
0.0
0.0
0.2
0.2
1.2
Career
—
311
114
17.3
2.7-4.3
62.1
0.0-0.1
29.2
1.6-2.2
72.4
1.9
3.8
5.7
0.6
0.8
0.2
2.0
1.0
6.9
Regular Season Totals
Season
Team
FG
FG%
3PT
3P%
FT
FT%
OR
DR
REB
AST
BLK
STL
PF
TO
PTS
2020-21
Charlotte Hornets
4-9
44.4
0-1
0.0
7-11
63.6
4
7
11
2
0
0
7
3
15
2021-22
Charlotte Hornets
60-90
66.7
0-0
0.0
30-43
69.8
34
52
86
13
21
9
51
24
150
2022-23
Charlotte Hornets
197-313
62.9
1-1
100.0
137-183
74.9
147
269
416
38
71
11
154
59
532
2023-24
Charlotte Hornets
260-376
69.1
0-1
0.0
132-179
73.7
172
367
539
54
74
26
176
73
652
2024-25
Charlotte Hornets
64-114
56.1
0-1
0.0
59-87
67.8
51
107
158
28
26
7
48
33
187
2024-25
Phoenix Suns
141-233
60.5
0-1
0.0
60-73
82.2
97
211
308
21
29
7
93
48
342
2024-25
2024 25 Totals
205-347
59.1
0-2
0.0
119-160
74.4
148
318
466
49
55
14
141
81
529
2025-26
Phoenix Suns
35-71
49.3
0-0
0.0
19-28
67.9
35
56
91
8
14
4
39
25
89
2025-26
Chicago Bulls
68-130
52.3
5-18
27.8
46-73
63.0
42
110
152
8
18
6
49
34
187
2025-26
2025 26 Totals
103-201
51.2
5-18
27.8
65-101
64.4
77
166
243
16
32
10
88
59
276
2026-27
Miami Heat
3-3
100.0
1-1
100.0
0-0
0.0
0
2
2
1
0
0
1
1
7
Career
—
832-1339
62.1
7-24
29.2
490-677
72.4
582
1181
1763
173
253
70
618
300
2161
Regular Season Misc Totals
Season
Team
DD2
TD3
DQ
EJECT
TECH
FLAG
AST/TO
STL/TO
SC-EFF
SH-EFF
2020-21
Charlotte Hornets
0
0
0
0
0
0
0.7
0.0
1.667
0.44
2021-22
Charlotte Hornets
0
0
0
0
0
0
0.5
0.4
1.667
0.67
2022-23
Charlotte Hornets
14
0
0
0
3
1
0.6
0.2
1.700
0.63
2023-24
Charlotte Hornets
19
0
1
0
3
1
0.7
0.4
1.734
0.69
2024-25
Charlotte Hornets
5
0
0
0
0
0
0.8
0.2
1.640
0.56
2024-25
Phoenix Suns
11
0
0
0
3
0
0.4
0.1
1.468
0.61
2024-25
2024 25 Totals
16
0
0
0
3
0
0.6
0.2
1.524
0.59
2025-26
Phoenix Suns
0
0
0
0
0
0
0.3
0.2
1.254
0.49
2025-26
Chicago Bulls
4
0
0
0
3
0
0.2
0.2
1.438
0.54
2025-26
2025 26 Totals
4
0
0
0
3
1
0.3
0.2
1.373
0.52
2026-27
Miami Heat
0
0
0
0
0
0
1.0
0.0
2.333
1.17
Career
—
53
0
1
0
12
2
0.6
0.2
1.614
0.62
Scoring, rebounding and assist trend
08 / SHOT CHART AND ZONE SHOOTING
Shot profile
Shot-location data is not connected. Add a BALLDONTLIE GOAT-tier NBA API key in NBA Players → Settings to enable shot charts and zone shooting.
LATEST UPDATERichards totaled nine points (2-2 FG, 1-1 3Pt, 4-4 FT), 11 rebounds and three assists in 18 minutes during Friday's 136-115 preseason loss to the Magic.
Richards continues to stake his claim for the backup center position, falling one point short of a double-double. He has put together a serviceable preseason, particularly on the glass. There isn't a lot of competition when it comes to backup minutes, meaning Richards could flirt with 15-17 minutes per game. Anyone in deeper formats could consider him with a late-round pick when in need of rebounds.


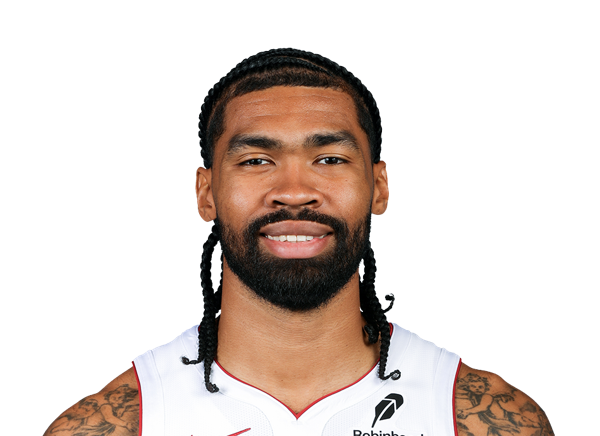

 Andrew WigginsF #22
 Bam AdebayoC #13
 Bez MbengG #19
 Bobby PortisF #95
 Bobby Portis Jr.F #95
 Davion MitchellG #2
 Dennis Smith Jr.G
 Dru SmithG #12
 Ezra AusarF
 Gabe MadsenG
 Giannis AntetokounmpoF #7
 Ian SchieffelinF #20
 J’Vonne HadleyF #14
 Jahmir YoungG #17
 Keshad JohnsonF #16
 Klay ThompsonG #11
 Kylor KelleyC
 Lamar WilkersonG #3
 Lester QuinonesG #25
 Myron GardnerF #15
 Nikola JovicF #5
 Pelle LarssonG #9
 Ryan ConwellG #4
 Simone FontecchioF
 Tim Hardaway Jr.G #10
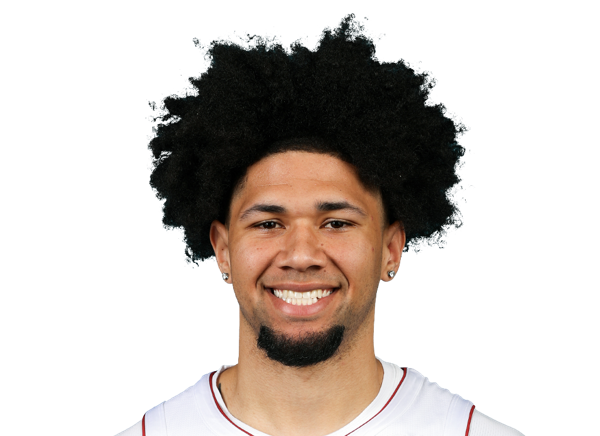 Tre DonaldsonG #24