Click a season to open this player’s full game log, splits and advanced stats for that year; click a team to open its page. A dash means no NBA games were recorded.
03 / EVERY CATEGORY THE PROVIDER REPORTS
Full statistical breakdown
Regular season 2026-27
Defensive
Metric
Total
NBA rank
Blocks
4
Tied-160th
Defensive Rebounds
18
Tied-258th
Steals
9
Tied-153rd
Defensive Rebound Rate
0.0
—
Defensive Rebounds Per Game
1.4
Tied-238th
Blocks Per Game
0.3
Tied-157th
Steals Per Game
0.7
160th
Defensive Rebounds Per 48
2.9
Tied-4,128th
Blocks Per 48
0.6
Tied-2,560th
Steals Per 48
1.5
Tied-2,448th
General
Metric
Total
NBA rank
Disqualifications
0
Tied-22nd
Flagrant Fouls
0
Tied-24th
Fouls
28
Tied-130th
Player Efficiency Rating
9.11
256th
Rebound Rate
0.0
—
Ejections
0
Tied-7th
Technical Fouls
0
Tied-104th
Rebounds
30
—
Value Over Replacement Player
0.0
—
Minutes
296
3rd
Minutes Per Game
22.8
—
Rating
12.0
Tied-81st
Plus-Minus
-56
Tied-1st
Rebounds Per Game
2.3
229th
Fouls Per Game
2.2
Tied-141st
Flagrant Fouls Per Game
0.0
Tied-21st
Technical Fouls Per Game
0.0
Tied-84th
Ejections Per Game
0.0
Tied-6th
Disqualifications Per Game
0.0
Tied-21st
Assist To Turnover Ratio
2.4
—
Steal To Foul Ratio
0.3
—
Block To Foul Ratio
0.1
—
Team Rebounds Per Game
0.0
—
Rebounds
30
—
Total Technical Fouls
0
—
Assist To Turnover Ratio
0.0
—
Steal To Turnover Ratio
1.0
—
Rebounds Per 48 Minutes
4.9
—
Fouls Per 48 Minutes
4.5
Tied-2,080th
Flagrant Fouls Per 48 Minutes
0.0
Tied-384th
Technical Fouls Per 48 Minutes
0.0
Tied-1,664th
Ejections Per 48 Minutes
0.0
Tied-112th
Disqualifications Per 48 Minutes
0.0
Tied-352nd
R/40
4.1
—
Games Played
13
13th
Games Started
5
Tied-158th
Double Double
0
Tied-121st
Triple Double
0
Tied-13th
Offensive
Metric
Total
NBA rank
Assists
22
Tied-176th
Effective Field Goal Percentage
44.3
—
Field Goals
27/70
—
Field Goals Attempted
70
Tied-203rd
Field Goals Made
27
Tied-233rd
Field Goal Percentage
38.6
—
Free Throws
27/34
—
Free Throw Percentage
79.4
129th
Free Throws Attempted
34
Tied-98th
Free Throws Made
27
Tied-95th
Offensive Rebounds
12
Tied-141st
Points
89
Tied-210th
Turnovers
9
Tied-232nd
3-Point Field Goal Percentage
22.2
Tied-247th
3-Point Field Goals Attempted
36
Tied-195th
3-Point Field Goals Made
8
Tied-232nd
True Shooting Percentage
52.4
—
Total Turnovers
9
—
Assist Ratio
19.0
—
Points in the Paint
0
Tied-1st
Offensive Rebound Rate
0.0
—
Turnover Ratio
7.8
—
Brick Index
0.00
—
Usage Rate
0.0
—
Average Field Goals Made
2.1
—
Average Field Goals Attempted
5.4
Tied-228th
Average 3-Point Field Goals Made
0.6
—
Average 3-Point Field Goals Attempted
2.8
191st
Average Free Throws Made
2.1
Tied-105th
Average Free Throws Attempted
2.6
Tied-98th
Points Per Game
6.8
Tied-206th
Offensive Rebounds Per Game
0.9
Tied-139th
Assists Per Game
1.7
Tied-175th
Turnovers Per Game
0.7
223rd
Offensive Rebound Percentage
0.3
—
Estimated Possessions
80.6
—
Estimated Possessions Per Game
6.2
—
Points Per Estimated Possession
1.1
—
Team Turnovers Per Game
0.0
—
Total Turnovers Per Game
0.7
—
3-Point Field Goal Percentage
22.2
—
2-Point Field Goals Made
19.0
Tied-1st
2-Point Field Goals Attempted
34.0
Tied-8th
2-Point Field Goals Made per Game
1.5
—
2-Point Field Goals Attempted per Game
2.6
—
2-Point Field Goal Percentage
55.9
—
Shooting Efficiency
0.44
—
Scoring Efficiency
1.271
—
Fieldgoals Made Per 48
4.4
Tied-3,728th
Fieldgoals Attempted Per 48
11.4
Tied-3,248th
3-Point Fieldgoals Made Per 48
1.3
Tied-3,712th
3-Point Fieldgoals Attempted Per 48
5.8
Tied-3,120th
Freethrows Made Per 48
4.4
Tied-1,520th
Freethrows Attempted Per 48
5.5
Tied-1,568th
Points Scored Per 48
14.4
Tied-3,360th
Offensive Rebounds Per 48
1.9
Tied-2,256th
Assists Per 48
3.6
Tied-2,816th
Turnovers
1.5
Tied-3,712th
P/40
12.0
—
A/40
3.0
—
04 / EFFICIENCY, SHOOTING PROFILE, PER-36
Advanced metrics
True shooting %52.0%
Effective FG %44.4%
2-point FG %57.7%
3-point attempt rate51.9%
Free throw rate48.1%
Points per shot attempt1.26
% of points from 3s26.5%
Assist-to-turnover2.43
Points per 36 min10.7
Rebounds per 36 min3.6
Assists per 36 min2.7
Steals per 36 min1.11
Blocks per 36 min0.47
Turnovers per 36 min1.11
Stocks (STL + BLK) per game1.00
Pts + Reb + Ast per game10.8
Efficiency (EFF) per game7.3
Game Score per game (Hollinger)5.2
Minutes per game22.8
Calculated by BallersCulture from the supplied 2026-27 box-score totals using standard formulas (hover a tile to see the formula). Tracking-based metrics such as BPM, VORP, on/off and RAPTOR are not available from this data source.
05 / 13 GAMES IN 2026-27
Game log: Regular season
Date
Opp
Result
MIN
FG
FG%
3PT
3P%
FT
FT%
REB
AST
BLK
STL
PF
TO
PTS
Nov 17
@ CLE
L 126-115
32
5-12
41.7
3-7
42.9
0-0
0.0
6
2
0
4
3
0
13
Nov 15
@ MIN
W 117-106
31
3-9
33.3
0-3
0.0
3-5
60.0
7
4
0
0
2
0
9
Nov 14
vs ATL
W 125-117 OT
41
5-10
50.0
2-6
33.3
3-4
75.0
3
2
1
1
1
2
15
Nov 12
vs SA
L 124-119
23
0-2
0.0
0-1
0.0
0-0
0.0
2
4
0
0
0
1
0
Nov 9
vs PHI
L 127-121
25
4-5
80.0
0-1
0.0
4-5
80.0
2
1
0
1
5
2
12
Nov 5
@ NY
L 135-105
15
3-6
50.0
0-1
0.0
0-0
0.0
1
0
0
1
3
0
6
Nov 3
@ PHI
L 126-107
21
0-6
0.0
0-4
0.0
4-4
100.0
1
0
0
0
1
0
4
Oct 31
@ BOS
L 125-111
18
2-5
40.0
1-4
25.0
1-1
100.0
3
2
1
0
3
1
6
Oct 29
vs NY
L 133-127
18
1-4
25.0
1-2
50.0
4-6
66.7
0
1
0
1
0
0
7
Oct 27
@ BOS
L 134-99
11
0-2
0.0
0-2
0.0
1-2
50.0
1
4
1
1
1
0
1
Oct 25
vs WSH
L 124-120
14
0-1
0.0
0-0
0.0
0-0
0.0
1
0
0
0
4
1
0
Oct 24
@ MIL
W 132-125
28
4-7
57.1
1-4
25.0
3-3
100.0
3
1
1
0
1
2
12
Oct 22
@ TOR
L 135-92
18
0-1
0.0
0-1
0.0
4-4
100.0
0
1
0
0
4
0
4
06 / 2026-27 HOME / AWAY, RESULTS, MONTHS AND OPPONENTS
Splits
split
Split
GP
MIN
FG
FG%
3PT
3P%
FT
FT%
OR
DR
REB
AST
BLK
STL
PF
TO
PTS
All Splits
13
22.8
2.1-5.4
38.6
0.6-2.8
22.2
2.1-2.6
79.4
0.9
1.4
2.3
1.7
0.3
0.7
2.2
0.7
6.8
Home
5
24.2
2.0-4.4
45.5
0.6-2.0
30.0
2.2-3.0
73.3
0.6
1.0
1.6
1.6
0.2
0.6
2.0
1.2
6.8
Road
8
21.9
2.1-6.0
35.4
0.6-3.3
19.2
2.0-2.4
84.2
1.1
1.6
2.8
1.8
0.4
0.8
2.3
0.4
6.9
vs. Division
2
30.0
4.5-9.5
47.4
2.0-5.5
36.4
1.5-1.5
100.0
2.5
2.0
4.5
1.5
0.5
2.0
2.0
1.0
12.5
vs. Conference
11
21.9
2.2-5.4
40.7
0.7-2.9
25.0
2.2-2.6
82.8
0.9
1.0
1.9
1.3
0.4
0.8
2.4
0.7
7.3
3+ Days Rest
2
21.5
2.0-3.0
66.7
0.0-1.0
0.0
4.0-4.5
88.9
0.5
0.5
1.0
1.0
0.0
0.5
4.5
1.0
8.0
Month
Split
GP
MIN
FG
FG%
3PT
3P%
FT
FT%
OR
DR
REB
AST
BLK
STL
PF
TO
PTS
October
6
17.8
1.2-3.3
35.0
0.5-2.2
23.1
2.2-2.7
81.3
0.5
0.8
1.3
1.5
0.5
0.3
2.2
0.7
5.0
November
7
27.0
2.9-7.1
40.0
0.7-3.3
21.7
2.0-2.6
77.8
1.3
1.9
3.1
1.9
0.1
1.0
2.1
0.7
8.4
Pre All-Star
13
22.8
2.1-5.4
38.6
0.6-2.8
22.2
2.1-2.6
79.4
0.9
1.4
2.3
1.7
0.3
0.7
2.2
0.7
6.8
Result
Split
GP
MIN
FG
FG%
3PT
3P%
FT
FT%
OR
DR
REB
AST
BLK
STL
PF
TO
PTS
Wins
3
33.3
4.0-8.7
46.2
1.0-4.3
23.1
3.0-4.0
75.0
1.7
2.7
4.3
2.3
0.7
0.3
1.3
1.3
12.0
Losses
10
19.6
1.5-4.4
34.1
0.5-2.3
21.7
1.8-2.2
81.8
0.7
1.0
1.7
1.5
0.2
0.8
2.4
0.5
5.3
Position
Split
GP
MIN
FG
FG%
3PT
3P%
FT
FT%
OR
DR
REB
AST
BLK
STL
PF
TO
PTS
As Starter
5
30.6
3.4-7.6
44.7
1.0-3.6
27.8
2.0-2.8
71.4
1.4
2.6
4.0
2.6
0.2
1.2
2.2
1.0
9.8
Day
Split
GP
MIN
FG
FG%
3PT
3P%
FT
FT%
OR
DR
REB
AST
BLK
STL
PF
TO
PTS
Monday
3
21.7
1.7-6.7
25.0
1.0-4.3
23.1
1.7-2.0
83.3
1.3
1.3
2.7
2.0
0.3
1.7
1.7
0.0
6.0
Wednesday
4
18.5
1.0-3.3
30.8
0.3-1.3
20.0
2.0-2.5
80.0
0.3
0.5
0.8
1.5
0.0
0.5
1.8
0.3
4.3
Friday
3
29.0
3.7-7.3
50.0
1.3-4.7
28.6
2.3-2.7
87.5
1.0
2.0
3.0
1.7
1.0
0.3
1.7
1.7
11.0
Saturday
2
22.5
1.5-5.0
30.0
0.0-1.5
0.0
1.5-2.5
60.0
1.5
2.5
4.0
2.0
0.0
0.0
3.0
0.5
4.5
Sunday
1
25.0
4.0-5.0
80.0
0.0-1.0
0.0
4.0-5.0
80.0
1.0
1.0
2.0
1.0
0.0
1.0
5.0
2.0
12.0
Opponent
Split
GP
MIN
FG
FG%
3PT
3P%
FT
FT%
OR
DR
REB
AST
BLK
STL
PF
TO
PTS
Atlanta Hawks
1
41.0
5.0-10.0
50.0
2.0-6.0
33.3
3.0-4.0
75.0
1.0
2.0
3.0
2.0
1.0
1.0
1.0
2.0
15.0
Boston Celtics
2
15.0
1.0-3.5
28.6
0.5-3.0
16.7
1.0-1.5
66.7
0.0
2.0
2.0
3.0
1.0
0.5
2.0
0.5
3.5
Cleveland Cavaliers
1
32.0
5.0-12.0
41.7
3.0-7.0
42.9
0.0-0.0
0.0
3.0
3.0
6.0
2.0
0.0
4.0
3.0
0.0
13.0
Milwaukee Bucks
1
28.0
4.0-7.0
57.1
1.0-4.0
25.0
3.0-3.0
100.0
2.0
1.0
3.0
1.0
1.0
0.0
1.0
2.0
12.0
Minnesota Timberwolves
1
31.0
3.0-9.0
33.3
0.0-3.0
0.0
3.0-5.0
60.0
2.0
5.0
7.0
4.0
0.0
0.0
2.0
0.0
9.0
New York Knicks
2
16.5
2.0-5.0
40.0
0.5-1.5
33.3
2.0-3.0
66.7
0.5
0.0
0.5
0.5
0.0
1.0
1.5
0.0
6.5
Philadelphia 76ers
2
23.0
2.0-5.5
36.4
0.0-2.5
0.0
4.0-4.5
88.9
1.0
0.5
1.5
0.5
0.0
0.5
3.0
1.0
8.0
San Antonio Spurs
1
23.0
0.0-2.0
0.0
0.0-1.0
0.0
0.0-0.0
0.0
0.0
2.0
2.0
4.0
0.0
0.0
0.0
1.0
0.0
Toronto Raptors
1
18.0
0.0-1.0
0.0
0.0-1.0
0.0
4.0-4.0
100.0
0.0
0.0
0.0
1.0
0.0
0.0
4.0
0.0
4.0
Washington Wizards
1
14.0
0.0-1.0
0.0
0.0-0.0
0.0
0.0-0.0
0.0
1.0
0.0
1.0
0.0
0.0
0.0
4.0
1.0
0.0
07 / SEASON-BY-SEASON HISTORY
Career statistics
Regular Season Averages
Season
Team
GP
GS
MIN
FG
FG%
3PT
3P%
FT
FT%
OR
DR
REB
AST
BLK
STL
PF
TO
PTS
2020-21
Cleveland Cavaliers
67
67
32.4
3.5-8.3
42.0
0.9-3.2
29.0
1.7-2.3
72.6
1.0
2.1
3.1
1.9
0.4
0.9
2.8
1.3
9.6
2021-22
Cleveland Cavaliers
67
61
29.6
3.1-6.4
48.0
0.8-2.3
35.0
1.8-2.3
76.8
1.1
1.9
3.0
1.8
0.3
0.8
2.4
0.9
8.8
2022-23
Cleveland Cavaliers
76
46
21.8
2.3-4.7
49.4
0.8-2.3
36.3
1.0-1.4
75.7
0.7
1.8
2.5
1.1
0.4
0.7
2.1
0.6
6.4
2023-24
Cleveland Cavaliers
69
42
27.3
3.4-7.0
49.0
1.2-3.1
39.1
1.3-2.0
67.9
1.0
2.0
3.0
1.9
0.5
0.8
2.0
0.8
9.4
2024-25
Cleveland Cavaliers
55
22
19.1
2.3-4.9
46.4
1.0-2.7
37.1
0.6-0.8
71.7
0.9
1.5
2.4
1.2
0.3
0.6
1.9
0.4
6.1
2025-26
Chicago Bulls
63
62
26.9
3.3-7.3
46.0
1.2-3.5
33.0
1.4-1.8
79.5
1.1
1.7
2.7
1.6
0.5
0.7
2.6
0.7
9.3
2026-27
Chicago Bulls
13
5
22.8
2.1-5.4
38.6
0.6-2.8
22.2
2.1-2.6
79.4
0.9
1.4
2.3
1.7
0.3
0.7
2.2
0.7
6.8
Career
—
410
305
26.2
3.0-6.4
46.3
1.0-2.8
34.3
1.3-1.8
74.3
0.9
1.8
2.8
1.6
0.4
0.8
2.3
0.8
8.2
Regular Season Totals
Season
Team
FG
FG%
3PT
3P%
FT
FT%
OR
DR
REB
AST
BLK
STL
PF
TO
PTS
2020-21
Cleveland Cavaliers
235-559
42.0
62-214
29.0
114-157
72.6
68
138
206
128
24
62
185
86
646
2021-22
Cleveland Cavaliers
207-431
48.0
55-157
35.0
119-155
76.8
72
129
201
121
22
56
164
58
588
2022-23
Cleveland Cavaliers
175-354
49.4
62-171
36.3
78-103
75.7
52
135
187
87
30
56
158
42
490
2023-24
Cleveland Cavaliers
235-480
49.0
84-215
39.1
93-137
67.9
67
140
207
132
34
57
140
54
647
2024-25
Cleveland Cavaliers
124-267
46.4
56-151
37.1
33-46
71.7
49
81
130
68
16
32
104
23
337
2025-26
Chicago Bulls
211-459
46.0
73-221
33.0
89-112
79.5
69
104
173
100
29
46
162
46
584
2026-27
Chicago Bulls
27-70
38.6
8-36
22.2
27-34
79.4
12
18
30
22
4
9
28
9
89
Career
—
1214-2620
46.3
400-1165
34.3
553-744
74.3
389
745
1134
658
159
318
941
318
3381
Regular Season Misc Totals
Season
Team
DD2
TD3
DQ
EJECT
TECH
FLAG
AST/TO
STL/TO
SC-EFF
SH-EFF
2020-21
Cleveland Cavaliers
1
0
2
0
0
0
1.5
0.7
1.156
0.48
2021-22
Cleveland Cavaliers
0
0
1
0
0
1
2.1
1.0
1.364
0.54
2022-23
Cleveland Cavaliers
0
0
1
0
0
0
2.1
1.3
1.384
0.58
2023-24
Cleveland Cavaliers
0
0
0
0
0
0
2.4
1.1
1.348
0.58
2024-25
Cleveland Cavaliers
0
0
0
0
0
0
3.0
1.4
1.262
0.57
2025-26
Chicago Bulls
0
0
0
0
0
0
2.2
1.0
1.272
0.54
2026-27
Chicago Bulls
0
0
0
0
0
0
2.4
1.0
1.271
0.44
Career
—
1
0
4
0
0
1
2.1
1.0
1.290
0.54
Scoring, rebounding and assist trend
08 / SHOT CHART AND ZONE SHOOTING
Shot profile
Shot-location data is not connected. Add a BALLDONTLIE GOAT-tier NBA API key in NBA Players → Settings to enable shot charts and zone shooting.
LATEST UPDATEOkoro ended with 15 points (5-10 FG, 2-6 3Pt, 3-4 FT), three rebounds, two assists, one block and one steal across 41 minutes during Friday's 125-117 overtime victory over the Hawks.
Okoro made his presence felt Friday and played a season-high 41 minutes, but fantasy managers shouldn't overreact to one performance since Okoro is not expected to become a 15-point-scorer overnight. His ability to contribute occasional steals, blocks and three-pointers makes him a situational option in deeper leagues, though managers should be cautious about expecting this level of playing time or production regularly. He's averaging just 6.1 points per game this season, and this was just the third time he scored in double digits thus far.




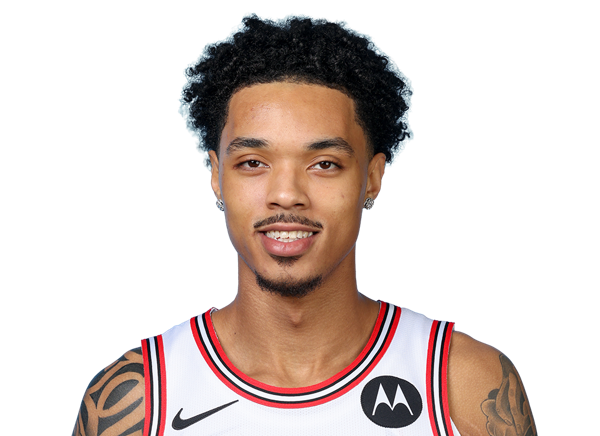 Brandon Boston Jr.G #13
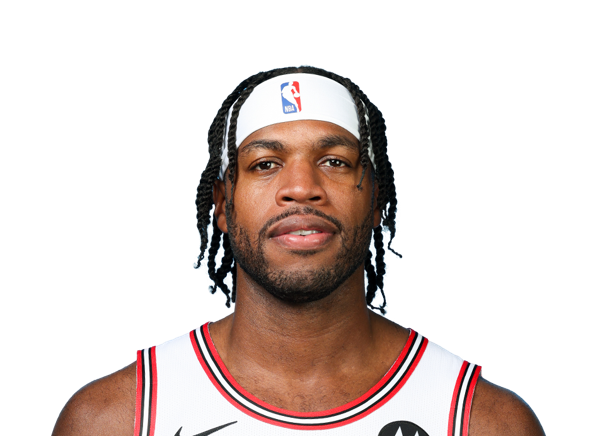 Buddy HieldG #7
 Caleb WilsonF #8
 Dailyn SwainG #5
 Drew PetersonF #21
 Guerschon YabuseleF #28
 Isaiah StevensG #99
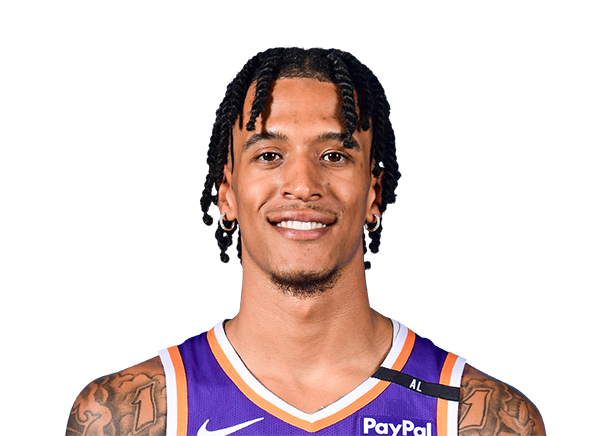 Jalen BridgesF #20
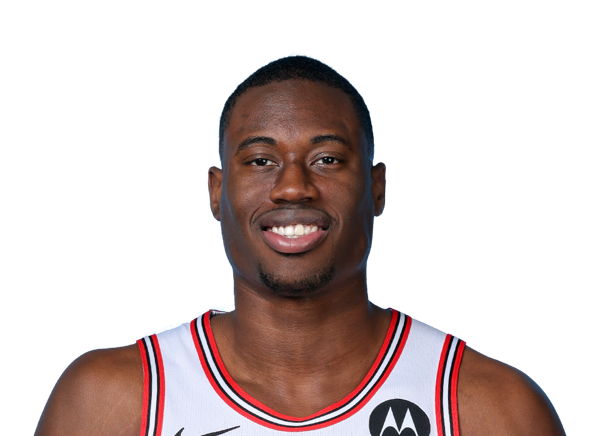 Jalen SmithF #25
 Jaylin SellersG #22
 Jordan HawkinsG #15
 Josh GiddeyG #3
 Lachlan OlbrichC #47
 Leonard MillerF #11
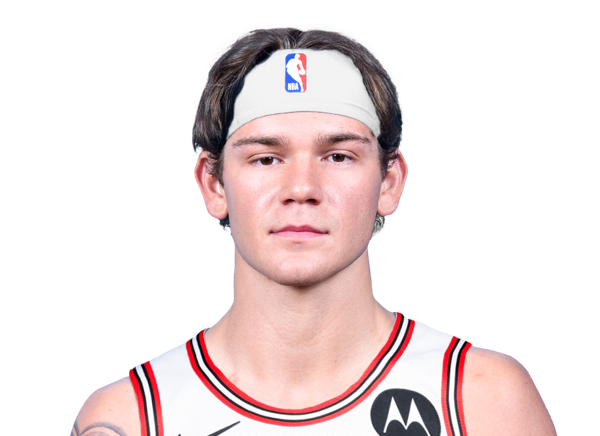 Mac McClungG #5
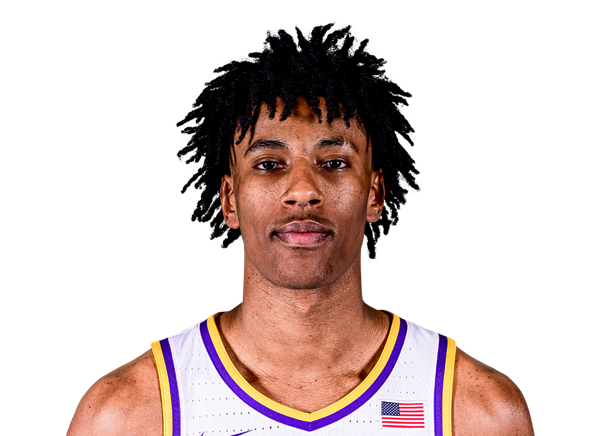 Marquel SuttonF
 Matas BuzelisF #14
 Nic ClaxtonC #9
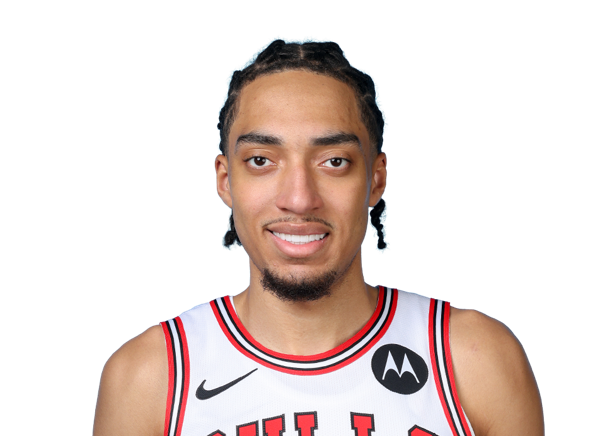 Noa EssengueF #2
 Norman PowellG #24
 Orlando RobinsonC #00
 Patrick WilliamsF #44
 Peter SuderG #15
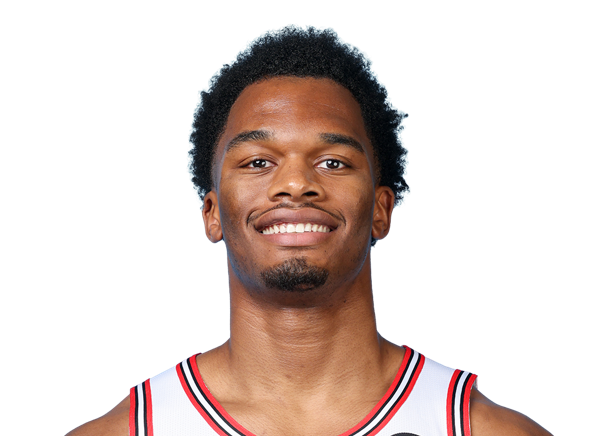 Tobe AwakaF #19
 Tre JonesG #30
 Zach CollinsF #12