Click a season to open this player’s full game log, splits and advanced stats for that year; click a team to open its page. A dash means no NBA games were recorded.
03 / EVERY CATEGORY THE PROVIDER REPORTS
Full statistical breakdown
Regular season 2026-27
Defensive
Metric
Total
NBA rank
Blocks
4
Tied-160th
Defensive Rebounds
12
Tied-320th
Steals
1
Tied-364th
Defensive Rebound Rate
0.0
—
Defensive Rebounds Per Game
3.0
—
Blocks Per Game
1.0
—
Steals Per Game
0.3
—
Defensive Rebounds Per 48
8.0
2,560th
Blocks Per 48
2.7
1,280th
Steals Per 48
0.7
2,912th
General
Metric
Total
NBA rank
Disqualifications
0
Tied-22nd
Flagrant Fouls
0
Tied-24th
Fouls
5
Tied-368th
Player Efficiency Rating
19.72
—
Rebound Rate
0.0
—
Ejections
0
Tied-7th
Technical Fouls
0
Tied-104th
Rebounds
18
—
Value Over Replacement Player
0.0
—
Minutes
72
Tied-6th
Minutes Per Game
18.0
—
Rating
17.7
Tied-412th
Plus-Minus
+1
Tied-1st
Rebounds Per Game
4.5
—
Fouls Per Game
1.3
—
Flagrant Fouls Per Game
0.0
—
Technical Fouls Per Game
0.0
—
Ejections Per Game
0.0
—
Disqualifications Per Game
0.0
—
Assist To Turnover Ratio
2.7
—
Steal To Foul Ratio
0.2
—
Block To Foul Ratio
0.8
—
Team Rebounds Per Game
0.0
—
Rebounds
18
—
Total Technical Fouls
0
—
Assist To Turnover Ratio
0.0
—
Steal To Turnover Ratio
0.3
—
Rebounds Per 48 Minutes
12.0
—
Fouls Per 48 Minutes
3.3
2,944th
Flagrant Fouls Per 48 Minutes
0.0
192nd
Technical Fouls Per 48 Minutes
0.0
832nd
Ejections Per 48 Minutes
0.0
56th
Disqualifications Per 48 Minutes
0.0
176th
R/40
10.0
—
Games Played
4
4th
Games Started
0
Tied-258th
Double Double
0
Tied-121st
Triple Double
0
Tied-13th
Offensive
Metric
Total
NBA rank
Assists
8
Tied-308th
Effective Field Goal Percentage
61.1
—
Field Goals
11/18
—
Field Goals Attempted
18
Tied-352nd
Field Goals Made
11
Tied-328th
Field Goal Percentage
61.1
—
Free Throws
9/11
—
Free Throw Percentage
81.8
—
Free Throws Attempted
11
Tied-250th
Free Throws Made
9
Tied-237th
Offensive Rebounds
6
Tied-258th
Points
31
Tied-325th
Turnovers
3
Tied-343rd
3-Point Field Goal Percentage
0.0
—
3-Point Field Goals Attempted
0
Tied-421st
3-Point Field Goals Made
0
Tied-379th
True Shooting Percentage
67.9
—
Total Turnovers
3
—
Assist Ratio
23.6
—
Points in the Paint
0
Tied-1st
Offensive Rebound Rate
0.0
—
Turnover Ratio
8.9
—
Brick Index
0.00
—
Usage Rate
0.0
—
Average Field Goals Made
2.8
—
Average Field Goals Attempted
4.5
—
Average 3-Point Field Goals Made
0.0
—
Average 3-Point Field Goals Attempted
0.0
—
Average Free Throws Made
2.3
—
Average Free Throws Attempted
2.8
—
Points Per Game
7.8
—
Offensive Rebounds Per Game
1.5
—
Assists Per Game
2.0
—
Turnovers Per Game
0.8
—
Offensive Rebound Percentage
0.9
—
Estimated Possessions
19.4
—
Estimated Possessions Per Game
4.9
—
Points Per Estimated Possession
1.6
—
Team Turnovers Per Game
0.0
—
Total Turnovers Per Game
0.8
—
3-Point Field Goal Percentage
0.0
—
2-Point Field Goals Made
11.0
51st
2-Point Field Goals Attempted
18.0
69th
2-Point Field Goals Made per Game
2.8
—
2-Point Field Goals Attempted per Game
4.5
—
2-Point Field Goal Percentage
61.1
—
Shooting Efficiency
0.61
—
Scoring Efficiency
1.722
—
Fieldgoals Made Per 48
7.3
2,624th
Fieldgoals Attempted Per 48
12.0
2,816th
3-Point Fieldgoals Made Per 48
0.0
3,032nd
3-Point Fieldgoals Attempted Per 48
0.0
3,368th
Freethrows Made Per 48
6.0
1,896th
Freethrows Attempted Per 48
7.3
2,000th
Points Scored Per 48
20.7
2,600th
Offensive Rebounds Per 48
4.0
2,064th
Assists Per 48
5.3
2,464th
Turnovers
2.0
2,744th
P/40
17.2
—
A/40
4.4
—
04 / EFFICIENCY, SHOOTING PROFILE, PER-36
Advanced metrics
True shooting %68.0%
Effective FG %62.2%
2-point FG %62.2%
3-point attempt rate0.0%
Free throw rate62.2%
Points per shot attempt1.73
% of points from 3s0.0%
Assist-to-turnover2.50
Points per 36 min15.6
Rebounds per 36 min9.0
Assists per 36 min4.0
Steals per 36 min0.60
Blocks per 36 min2.00
Turnovers per 36 min1.60
Stocks (STL + BLK) per game1.30
Pts + Reb + Ast per game14.3
Efficiency (EFF) per game12.6
Game Score per game (Hollinger)8.6
Minutes per game18.0
Calculated by BallersCulture from the supplied 2026-27 box-score totals using standard formulas (hover a tile to see the formula). Tracking-based metrics such as BPM, VORP, on/off and RAPTOR are not available from this data source.
05 / 4 GAMES IN 2026-27
Game log: Regular season
Date
Opp
Result
MIN
FG
FG%
3PT
3P%
FT
FT%
REB
AST
BLK
STL
PF
TO
PTS
Nov 17
@ CLE
L 126-115
17
3-6
50.0
0-0
0.0
2-2
100.0
2
1
0
1
0
1
8
Nov 14
vs ATL
W 125-117 OT
22
1-3
33.3
0-0
0.0
0-0
0.0
6
2
1
0
2
1
2
Nov 12
vs SA
L 124-119
16
5-6
83.3
0-0
0.0
7-9
77.8
6
1
1
0
2
0
17
Nov 9
vs PHI
L 127-121
18
2-3
66.7
0-0
0.0
0-0
0.0
4
4
2
0
1
1
4
06 / 2026-27 HOME / AWAY, RESULTS, MONTHS AND OPPONENTS
Splits
split
Split
GP
MIN
FG
FG%
3PT
3P%
FT
FT%
OR
DR
REB
AST
BLK
STL
PF
TO
PTS
All Splits
4
18.0
2.8-4.5
61.1
0.0-0.0
0.0
2.3-2.8
81.8
1.5
3.0
4.5
2.0
1.0
0.3
1.3
0.8
7.8
Home
3
18.3
2.7-4.0
66.7
0.0-0.0
0.0
2.3-3.0
77.8
2.0
3.3
5.3
2.3
1.3
0.0
1.7
0.7
7.7
Road
1
17.0
3.0-6.0
50.0
0.0-0.0
0.0
2.0-2.0
100.0
0.0
2.0
2.0
1.0
0.0
1.0
0.0
1.0
8.0
vs. Division
1
17.0
3.0-6.0
50.0
0.0-0.0
0.0
2.0-2.0
100.0
0.0
2.0
2.0
1.0
0.0
1.0
0.0
1.0
8.0
vs. Conference
3
18.7
2.0-4.0
50.0
0.0-0.0
0.0
0.7-0.7
100.0
1.0
3.0
4.0
2.3
1.0
0.3
1.0
1.0
4.7
3+ Days Rest
1
18.0
2.0-3.0
66.7
0.0-0.0
0.0
0.0-0.0
0.0
1.0
3.0
4.0
4.0
2.0
0.0
1.0
1.0
4.0
Month
Split
GP
MIN
FG
FG%
3PT
3P%
FT
FT%
OR
DR
REB
AST
BLK
STL
PF
TO
PTS
November
4
18.0
2.8-4.5
61.1
0.0-0.0
0.0
2.3-2.8
81.8
1.5
3.0
4.5
2.0
1.0
0.3
1.3
0.8
7.8
Pre All-Star
4
18.0
2.8-4.5
61.1
0.0-0.0
0.0
2.3-2.8
81.8
1.5
3.0
4.5
2.0
1.0
0.3
1.3
0.8
7.8
Result
Split
GP
MIN
FG
FG%
3PT
3P%
FT
FT%
OR
DR
REB
AST
BLK
STL
PF
TO
PTS
Wins
1
22.0
1.0-3.0
33.3
0.0-0.0
0.0
0.0-0.0
0.0
2.0
4.0
6.0
2.0
1.0
0.0
2.0
1.0
2.0
Losses
3
16.7
3.3-5.0
66.7
0.0-0.0
0.0
3.0-3.7
81.8
1.3
2.7
4.0
2.0
1.0
0.3
1.0
0.7
9.7
Day
Split
GP
MIN
FG
FG%
3PT
3P%
FT
FT%
OR
DR
REB
AST
BLK
STL
PF
TO
PTS
Monday
1
17.0
3.0-6.0
50.0
0.0-0.0
0.0
2.0-2.0
100.0
0.0
2.0
2.0
1.0
0.0
1.0
0.0
1.0
8.0
Wednesday
1
16.0
5.0-6.0
83.3
0.0-0.0
0.0
7.0-9.0
77.8
3.0
3.0
6.0
1.0
1.0
0.0
2.0
0.0
17.0
Friday
1
22.0
1.0-3.0
33.3
0.0-0.0
0.0
0.0-0.0
0.0
2.0
4.0
6.0
2.0
1.0
0.0
2.0
1.0
2.0
Sunday
1
18.0
2.0-3.0
66.7
0.0-0.0
0.0
0.0-0.0
0.0
1.0
3.0
4.0
4.0
2.0
0.0
1.0
1.0
4.0
Opponent
Split
GP
MIN
FG
FG%
3PT
3P%
FT
FT%
OR
DR
REB
AST
BLK
STL
PF
TO
PTS
Atlanta Hawks
1
22.0
1.0-3.0
33.3
0.0-0.0
0.0
0.0-0.0
0.0
2.0
4.0
6.0
2.0
1.0
0.0
2.0
1.0
2.0
Cleveland Cavaliers
1
17.0
3.0-6.0
50.0
0.0-0.0
0.0
2.0-2.0
100.0
0.0
2.0
2.0
1.0
0.0
1.0
0.0
1.0
8.0
Philadelphia 76ers
1
18.0
2.0-3.0
66.7
0.0-0.0
0.0
0.0-0.0
0.0
1.0
3.0
4.0
4.0
2.0
0.0
1.0
1.0
4.0
San Antonio Spurs
1
16.0
5.0-6.0
83.3
0.0-0.0
0.0
7.0-9.0
77.8
3.0
3.0
6.0
1.0
1.0
0.0
2.0
0.0
17.0
07 / SEASON-BY-SEASON HISTORY
Career statistics
Regular Season Averages
Season
Team
GP
GS
MIN
FG
FG%
3PT
3P%
FT
FT%
OR
DR
REB
AST
BLK
STL
PF
TO
PTS
2019-20
Brooklyn Nets
15
0
12.5
1.8-3.2
56.3
0.1-0.5
14.3
0.7-1.4
52.4
1.3
1.7
2.9
1.1
0.5
0.1
0.9
0.6
4.4
2020-21
Brooklyn Nets
32
1
18.6
2.8-4.5
62.1
0.0-0.2
20.0
1.0-2.0
48.4
1.3
3.8
5.2
0.9
1.3
0.7
2.1
0.6
6.6
2021-22
Brooklyn Nets
47
19
20.7
3.8-5.6
67.4
0.0-0.0
0.0
1.1-2.0
58.1
1.9
3.7
5.6
0.9
1.1
0.5
2.3
0.8
8.7
2022-23
Brooklyn Nets
76
76
29.9
5.4-7.7
70.5
0.0-0.0
0.0
1.8-3.2
54.1
2.4
6.8
9.2
1.9
2.5
0.9
2.8
1.3
12.6
2023-24
Brooklyn Nets
71
71
29.8
5.2-8.2
62.9
0.0-0.1
20.0
1.5-2.8
55.1
2.7
7.2
9.9
2.1
2.1
0.6
2.5
1.3
11.8
2024-25
Brooklyn Nets
70
62
26.9
4.6-8.1
56.3
0.1-0.3
23.8
1.1-2.2
51.3
2.2
5.1
7.4
2.2
1.4
0.9
2.1
1.2
10.3
2025-26
Brooklyn Nets
69
68
27.8
4.8-8.4
57.1
0.0-0.3
15.8
2.0-3.3
61.6
2.4
4.5
6.9
3.7
1.1
0.7
2.3
1.4
11.7
2026-27
Chicago Bulls
4
0
18.0
2.8-4.5
61.1
0.0-0.0
0.0
2.3-2.8
81.8
1.5
3.0
4.5
2.0
1.0
0.3
1.3
0.8
7.8
Career
—
384
297
26.1
4.5-7.3
62.2
0.0-0.2
18.6
1.5-2.6
55.8
2.2
5.3
7.5
2.1
1.6
0.7
2.3
1.1
10.6
Regular Season Totals
Season
Team
FG
FG%
3PT
3P%
FT
FT%
OR
DR
REB
AST
BLK
STL
PF
TO
PTS
2019-20
Brooklyn Nets
27-48
56.3
1-7
14.3
11-21
52.4
19
25
44
16
8
1
14
9
66
2020-21
Brooklyn Nets
90-145
62.1
1-5
20.0
31-64
48.4
43
123
166
28
40
23
68
18
212
2021-22
Brooklyn Nets
178-264
67.4
0-0
0.0
54-93
58.1
91
173
264
43
51
24
110
38
410
2022-23
Brooklyn Nets
414-587
70.5
0-2
0.0
133-246
54.1
184
518
702
144
189
65
212
96
961
2023-24
Brooklyn Nets
366-582
62.9
1-5
20.0
108-196
55.1
193
513
706
147
146
46
175
93
841
2024-25
Brooklyn Nets
320-568
56.3
5-21
23.8
79-154
51.3
157
358
515
157
100
62
150
87
724
2025-26
Brooklyn Nets
333-583
57.1
3-19
15.8
141-229
61.6
168
310
478
253
77
45
158
96
810
2026-27
Chicago Bulls
11-18
61.1
0-0
0.0
9-11
81.8
6
12
18
8
4
1
5
3
31
Career
—
1739-2795
62.2
11-59
18.6
566-1014
55.8
861
2032
2893
796
615
267
892
440
4055
Regular Season Misc Totals
Season
Team
DD2
TD3
DQ
EJECT
TECH
FLAG
AST/TO
STL/TO
SC-EFF
SH-EFF
2019-20
Brooklyn Nets
0
0
0
0
0
1
1.8
0.1
1.375
0.57
2020-21
Brooklyn Nets
1
0
0
0
1
0
1.6
1.3
1.462
0.62
2021-22
Brooklyn Nets
4
0
0
0
1
1
1.1
0.6
1.553
0.67
2022-23
Brooklyn Nets
28
0
2
0
11
1
1.5
0.7
1.637
0.71
2023-24
Brooklyn Nets
30
0
1
1
10
3
1.6
0.5
1.445
0.63
2024-25
Brooklyn Nets
13
0
0
3
7
4
1.8
0.7
1.275
0.57
2025-26
Brooklyn Nets
11
2
1
0
6
0
2.6
0.5
1.389
0.57
2026-27
Chicago Bulls
0
0
0
0
0
0
2.7
0.3
1.722
0.61
Career
—
87
2
4
4
36
10
1.8
0.6
1.451
0.62
Scoring, rebounding and assist trend
08 / SHOT CHART AND ZONE SHOOTING
Shot profile
Shot-location data is not connected. Add a BALLDONTLIE GOAT-tier NBA API key in NBA Players → Settings to enable shot charts and zone shooting.
LATEST UPDATEClaxton (hamstring) is not listed on the injury report for Monday's game against the Cavaliers.
Claxton missed the second night of Chicago's back-to-back against the Timberwolves on Saturday due to hamstring injury management. He missed the first eight outings of the season with the issue, but he's now set to suit up for the fourth time in the last five games. Claxton is averaging 7.7 points, 5.3 rebounds, 2.3 assists and 1.3 blocks in 18.3 minutes across three regular-season appearances.




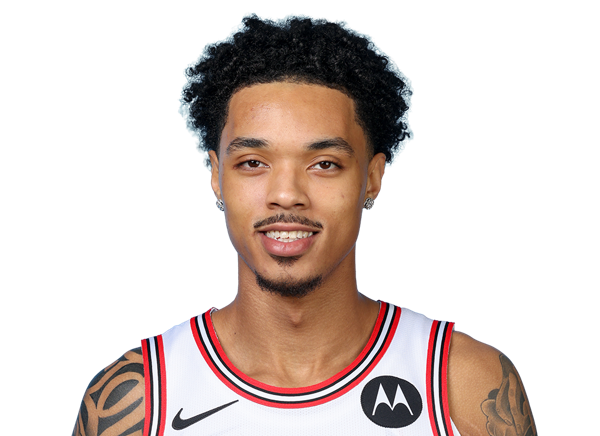 Brandon Boston Jr.G #13
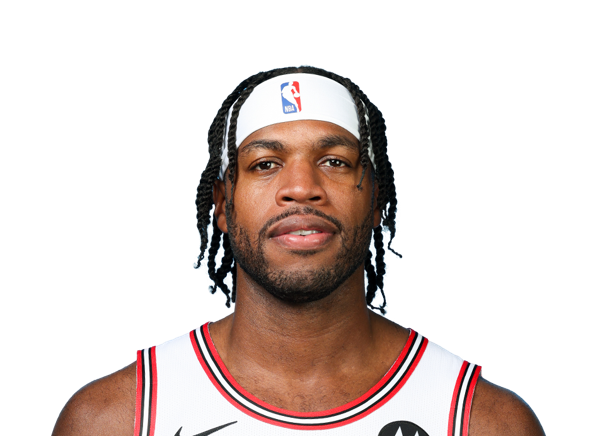 Buddy HieldG #7
 Caleb WilsonF #8
 Dailyn SwainG #5
 Drew PetersonF #21
 Guerschon YabuseleF #28
 Isaac OkoroF #35
 Isaiah StevensG #99
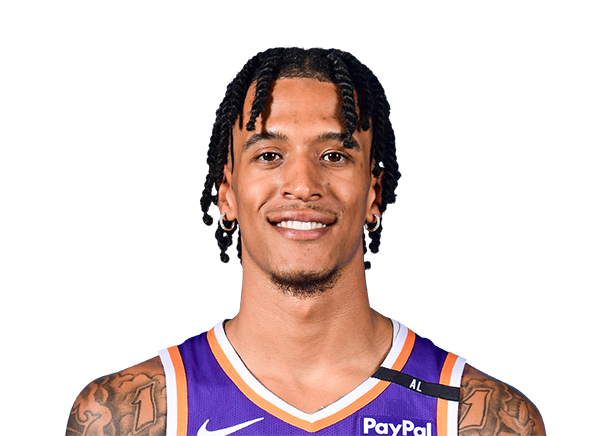 Jalen BridgesF #20
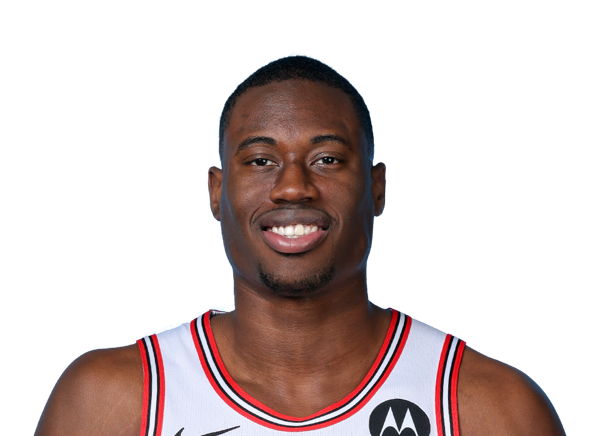 Jalen SmithF #25
 Jaylin SellersG #22
 Jordan HawkinsG #15
 Josh GiddeyG #3
 Lachlan OlbrichC #47
 Leonard MillerF #11
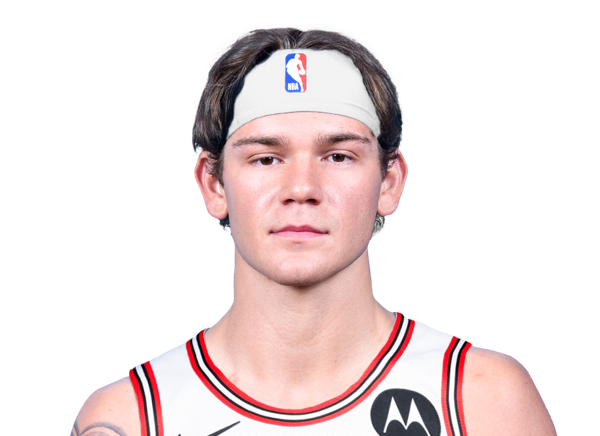 Mac McClungG #5
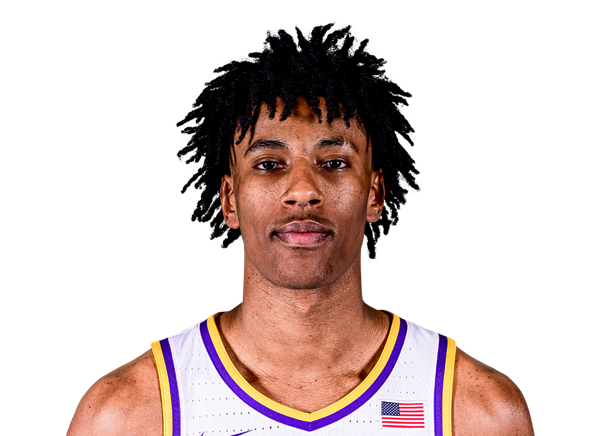 Marquel SuttonF
 Matas BuzelisF #14
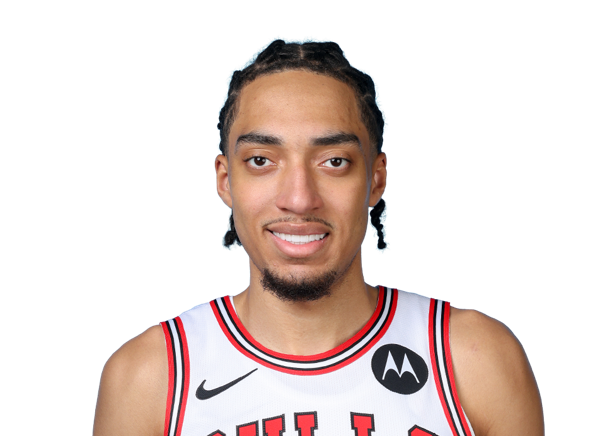 Noa EssengueF #2
 Norman PowellG #24
 Orlando RobinsonC #00
 Patrick WilliamsF #44
 Peter SuderG #15
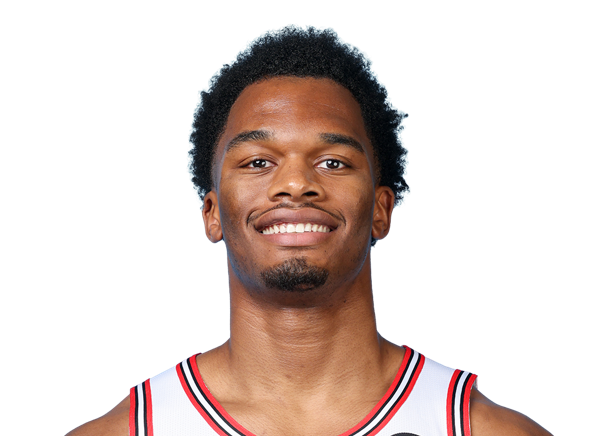 Tobe AwakaF #19
 Tre JonesG #30
 Zach CollinsF #12