Click a season to open this player’s full game log, splits and advanced stats for that year; click a team to open its page. A dash means no NBA games were recorded.
03 / EVERY CATEGORY THE PROVIDER REPORTS
Full statistical breakdown
Regular season 2026-27
Defensive
Metric
Total
NBA rank
Blocks
1
Tied-289th
Defensive Rebounds
2
Tied-405th
Steals
2
Tied-316th
Defensive Rebound Rate
0.0
—
Defensive Rebounds Per Game
0.3
—
Blocks Per Game
0.2
—
Steals Per Game
0.3
—
Defensive Rebounds Per 48
2.0
3,240th
Blocks Per 48
1.0
2,312th
Steals Per 48
2.0
2,528th
General
Metric
Total
NBA rank
Disqualifications
0
Tied-21st
Flagrant Fouls
0
Tied-22nd
Fouls
7
Tied-340th
Player Efficiency Rating
12.89
—
Rebound Rate
0.0
—
Ejections
0
Tied-7th
Technical Fouls
0
Tied-101st
Rebounds
4
—
Value Over Replacement Player
1.5
—
Minutes
48
Tied-6th
Minutes Per Game
8.0
—
Rating
7.0
Tied-304th
Plus-Minus
+1
Tied-1st
Rebounds Per Game
0.7
—
Fouls Per Game
1.2
—
Flagrant Fouls Per Game
0.0
—
Technical Fouls Per Game
0.0
—
Ejections Per Game
0.0
—
Disqualifications Per Game
0.0
—
Assist To Turnover Ratio
2.0
—
Steal To Foul Ratio
0.3
—
Block To Foul Ratio
0.1
—
Team Rebounds Per Game
0.0
—
Rebounds
4
—
Total Technical Fouls
0
—
Assist To Turnover Ratio
0.0
—
Steal To Turnover Ratio
0.5
—
Rebounds Per 48 Minutes
4.0
—
Fouls Per 48 Minutes
7.0
2,720th
Flagrant Fouls Per 48 Minutes
0.0
176th
Technical Fouls Per 48 Minutes
0.0
808th
Ejections Per 48 Minutes
0.0
56th
Disqualifications Per 48 Minutes
0.0
168th
R/40
3.3
—
Games Played
6
6th
Games Started
0
Tied-257th
Double Double
0
Tied-119th
Triple Double
0
Tied-12th
Offensive
Metric
Total
NBA rank
Assists
8
Tied-306th
Effective Field Goal Percentage
52.3
—
Field Goals
8/22
—
Field Goals Attempted
22
Tied-334th
Field Goals Made
8
Tied-345th
Field Goal Percentage
36.4
—
Free Throws
3/4
—
Free Throw Percentage
75.0
—
Free Throws Attempted
4
Tied-332nd
Free Throws Made
3
Tied-331st
Offensive Rebounds
2
Tied-358th
Points
26
Tied-336th
Turnovers
4
Tied-308th
3-Point Field Goal Percentage
41.2
—
3-Point Field Goals Attempted
17
Tied-267th
3-Point Field Goals Made
7
Tied-239th
True Shooting Percentage
54.7
—
Total Turnovers
4
—
Assist Ratio
22.4
—
Points in the Paint
0
Tied-1st
Offensive Rebound Rate
0.0
—
Turnover Ratio
11.2
—
Brick Index
0.00
—
Usage Rate
0.0
—
Average Field Goals Made
1.3
—
Average Field Goals Attempted
3.7
—
Average 3-Point Field Goals Made
1.2
—
Average 3-Point Field Goals Attempted
2.8
—
Average Free Throws Made
0.5
—
Average Free Throws Attempted
0.7
—
Points Per Game
4.3
—
Offensive Rebounds Per Game
0.3
—
Assists Per Game
1.3
—
Turnovers Per Game
0.7
—
Offensive Rebound Percentage
0.1
—
Estimated Possessions
25.6
—
Estimated Possessions Per Game
4.3
—
Points Per Estimated Possession
1.0
—
Team Turnovers Per Game
0.0
—
Total Turnovers Per Game
0.7
—
3-Point Field Goal Percentage
41.2
—
2-Point Field Goals Made
1.0
Tied-106th
2-Point Field Goals Attempted
5.0
Tied-67th
2-Point Field Goals Made per Game
0.2
—
2-Point Field Goals Attempted per Game
0.8
—
2-Point Field Goal Percentage
20.0
—
Shooting Efficiency
0.52
—
Scoring Efficiency
1.182
—
Fieldgoals Made Per 48
8.0
2,760th
Fieldgoals Attempted Per 48
22.0
2,672nd
3-Point Fieldgoals Made Per 48
7.0
1,912th
3-Point Fieldgoals Attempted Per 48
17.0
2,136th
Freethrows Made Per 48
3.0
2,648th
Freethrows Attempted Per 48
4.0
2,656th
Points Scored Per 48
26.0
2,688th
Offensive Rebounds Per 48
2.0
2,864th
Assists Per 48
8.0
2,448th
Turnovers
4.0
2,464th
P/40
21.7
—
A/40
6.7
—
04 / EFFICIENCY, SHOOTING PROFILE, PER-36
Advanced metrics
True shooting %53.6%
Effective FG %51.4%
2-point FG %11.1%
3-point attempt rate75.7%
Free throw rate18.9%
Points per shot attempt1.16
% of points from 3s83.7%
Assist-to-turnover1.86
Points per 36 min19.3
Rebounds per 36 min3.2
Assists per 36 min5.9
Steals per 36 min1.35
Blocks per 36 min0.90
Turnovers per 36 min3.15
Stocks (STL + BLK) per game0.50
Pts + Reb + Ast per game6.3
Efficiency (EFF) per game3.5
Game Score per game (Hollinger)2.6
Minutes per game8.0
Calculated by BallersCulture from the supplied 2026-27 box-score totals using standard formulas (hover a tile to see the formula). Tracking-based metrics such as BPM, VORP, on/off and RAPTOR are not available from this data source.
05 / 6 GAMES IN 2026-27
Game log: Regular season
Date
Opp
Result
MIN
FG
FG%
3PT
3P%
FT
FT%
REB
AST
BLK
STL
PF
TO
PTS
Nov 12
vs SA
L 124-119
2
1-1
100.0
1-1
100.0
0-0
0.0
0
3
0
0
0
0
3
Nov 5
@ NY
L 135-105
14
4-8
50.0
4-7
57.1
2-2
100.0
3
1
1
1
1
0
14
Nov 3
@ PHI
L 126-107
2
1-1
100.0
0-0
0.0
1-2
50.0
0
0
0
0
0
0
3
Oct 31
@ BOS
L 125-111
3
1-3
33.3
1-2
50.0
0-0
0.0
0
1
0
0
1
0
3
Oct 27
@ BOS
L 134-99
12
0-5
0.0
0-5
0.0
0-0
0.0
0
1
0
1
2
3
0
Oct 22
@ TOR
L 135-92
14
1-4
25.0
1-2
50.0
0-0
0.0
1
2
0
0
3
1
3
06 / 2026-27 HOME / AWAY, RESULTS, MONTHS AND OPPONENTS
Splits
split
Split
GP
MIN
FG
FG%
3PT
3P%
FT
FT%
OR
DR
REB
AST
BLK
STL
PF
TO
PTS
All Splits
6
8.0
1.3-3.7
36.4
1.2-2.8
41.2
0.5-0.7
75.0
0.3
0.3
0.7
1.3
0.2
0.3
1.2
0.7
4.3
Home
1
2.0
1.0-1.0
100.0
1.0-1.0
100.0
0.0-0.0
0.0
0.0
0.0
0.0
3.0
0.0
0.0
0.0
0.0
3.0
Road
5
9.2
1.4-4.2
33.3
1.2-3.2
37.5
0.6-0.8
75.0
0.4
0.4
0.8
1.0
0.2
0.4
1.4
0.8
4.6
vs. Conference
5
9.2
1.4-4.2
33.3
1.2-3.2
37.5
0.6-0.8
75.0
0.4
0.4
0.8
1.0
0.2
0.4
1.4
0.8
4.6
3+ Days Rest
4
8.0
0.8-3.3
23.1
0.8-2.5
30.0
0.0-0.0
0.0
0.0
0.3
0.3
1.8
0.0
0.3
1.5
1.0
2.3
Month
Split
GP
MIN
FG
FG%
3PT
3P%
FT
FT%
OR
DR
REB
AST
BLK
STL
PF
TO
PTS
October
3
10.0
0.7-4.0
16.7
0.7-3.0
22.2
0.0-0.0
0.0
0.0
0.3
0.3
1.3
0.0
0.3
2.0
1.3
2.0
November
3
6.3
2.0-3.3
60.0
1.7-2.7
62.5
1.0-1.3
75.0
0.7
0.3
1.0
1.3
0.3
0.3
0.3
0.0
6.7
Pre All-Star
6
8.0
1.3-3.7
36.4
1.2-2.8
41.2
0.5-0.7
75.0
0.3
0.3
0.7
1.3
0.2
0.3
1.2
0.7
4.3
Result
Split
GP
MIN
FG
FG%
3PT
3P%
FT
FT%
OR
DR
REB
AST
BLK
STL
PF
TO
PTS
Losses
6
8.0
1.3-3.7
36.4
1.2-2.8
41.2
0.5-0.7
75.0
0.3
0.3
0.7
1.3
0.2
0.3
1.2
0.7
4.3
Day
Split
GP
MIN
FG
FG%
3PT
3P%
FT
FT%
OR
DR
REB
AST
BLK
STL
PF
TO
PTS
Monday
2
7.0
0.5-3.0
16.7
0.0-2.5
0.0
0.5-1.0
50.0
0.0
0.0
0.0
0.5
0.0
0.5
1.0
1.5
1.5
Wednesday
3
10.3
2.0-4.3
46.2
2.0-3.3
60.0
0.7-0.7
100.0
0.7
0.7
1.3
2.0
0.3
0.3
1.3
0.3
6.7
Friday
1
3.0
1.0-3.0
33.3
1.0-2.0
50.0
0.0-0.0
0.0
0.0
0.0
0.0
1.0
0.0
0.0
1.0
0.0
3.0
Opponent
Split
GP
MIN
FG
FG%
3PT
3P%
FT
FT%
OR
DR
REB
AST
BLK
STL
PF
TO
PTS
Boston Celtics
2
7.5
0.5-4.0
12.5
0.5-3.5
14.3
0.0-0.0
0.0
0.0
0.0
0.0
1.0
0.0
0.5
1.5
1.5
1.5
New York Knicks
1
14.0
4.0-8.0
50.0
4.0-7.0
57.1
2.0-2.0
100.0
2.0
1.0
3.0
1.0
1.0
1.0
1.0
0.0
14.0
Philadelphia 76ers
1
2.0
1.0-1.0
100.0
0.0-0.0
0.0
1.0-2.0
50.0
0.0
0.0
0.0
0.0
0.0
0.0
0.0
0.0
3.0
San Antonio Spurs
1
2.0
1.0-1.0
100.0
1.0-1.0
100.0
0.0-0.0
0.0
0.0
0.0
0.0
3.0
0.0
0.0
0.0
0.0
3.0
Toronto Raptors
1
14.0
1.0-4.0
25.0
1.0-2.0
50.0
0.0-0.0
0.0
0.0
1.0
1.0
2.0
0.0
0.0
3.0
1.0
3.0
07 / SEASON-BY-SEASON HISTORY
Career statistics
Regular Season Averages
Season
Team
GP
GS
MIN
FG
FG%
3PT
3P%
FT
FT%
OR
DR
REB
AST
BLK
STL
PF
TO
PTS
2026-27
Chicago Bulls
6
0
8.0
1.3-3.7
36.4
1.2-2.8
41.2
0.5-0.7
75.0
0.3
0.3
0.7
1.3
0.2
0.3
1.2
0.7
4.3
Career
—
6
0
8.0
1.3-3.7
36.4
1.2-2.8
41.2
0.5-0.7
75.0
0.3
0.3
0.7
1.3
0.2
0.3
1.2
0.7
4.3
Regular Season Totals
Season
Team
FG
FG%
3PT
3P%
FT
FT%
OR
DR
REB
AST
BLK
STL
PF
TO
PTS
2026-27
Chicago Bulls
8-22
36.4
7-17
41.2
3-4
75.0
2
2
4
8
1
2
7
4
26
Career
—
8-22
36.4
7-17
41.2
3-4
75.0
2
2
4
8
1
2
7
4
26
Regular Season Misc Totals
Season
Team
DD2
TD3
DQ
EJECT
TECH
FLAG
AST/TO
STL/TO
SC-EFF
SH-EFF
2026-27
Chicago Bulls
0
0
0
0
0
0
2.0
0.5
1.182
0.52
Career
—
0
0
0
0
0
0
2.0
0.5
1.182
0.52
08 / SHOT CHART AND ZONE SHOOTING
Shot profile
Shot-location data is not connected. Add a BALLDONTLIE GOAT-tier NBA API key in NBA Players → Settings to enable shot charts and zone shooting.
LATEST UPDATESellers finished with 14 points (4-8 FG, 4-7 3Pt, 2-2 FT), three rebounds, one assist, one block and one steal over 14 minutes during Wednesday's 135-105 loss to the Knicks.
Sellers made the most of his limited opportunity, knocking down four triples while contributing on both ends of the floor. He tied Tre Jones for the team lead in scoring despite playing just 14 minutes, though the blowout afforded Chicago's reserves additional opportunities. Sellers will need to establish a more consistent role before becoming a viable fantasy option outside deeper leagues.




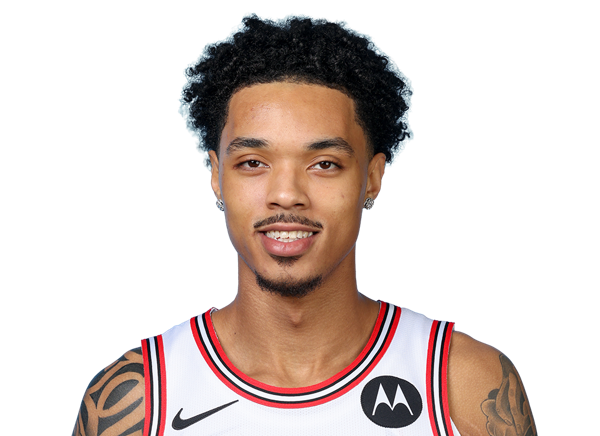 Brandon Boston Jr.G #13
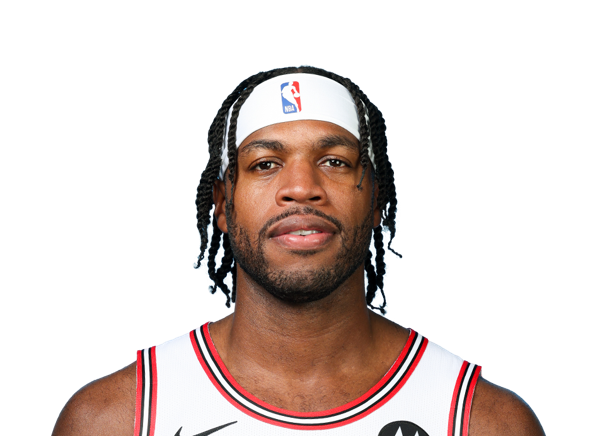 Buddy HieldG #7
 Caleb WilsonF #8
 Dailyn SwainG #5
 Drew PetersonF #21
 Guerschon YabuseleF #28
 Isaac OkoroF #35
 Isaiah StevensG #99
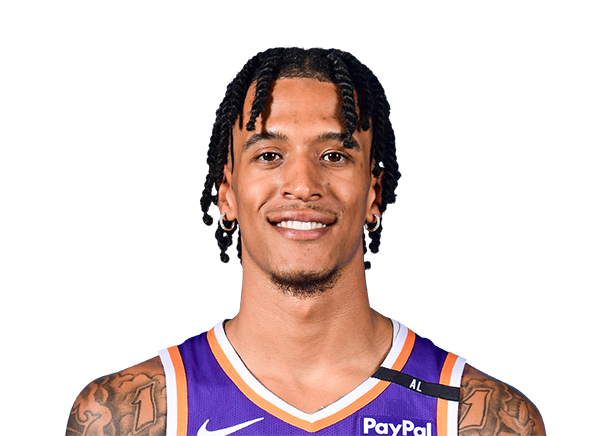 Jalen BridgesF #20
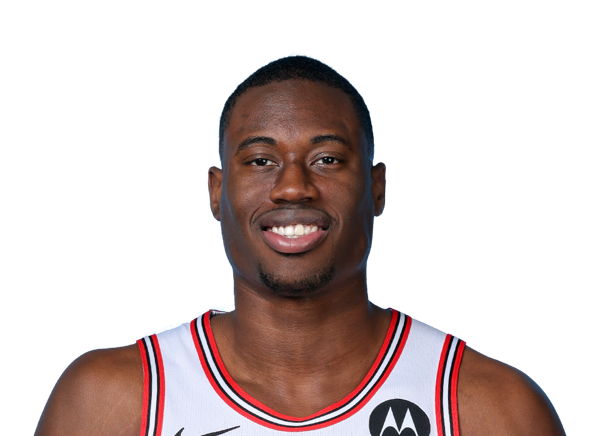 Jalen SmithF #25
 Jordan HawkinsG #15
 Josh GiddeyG #3
 Lachlan OlbrichC #47
 Leonard MillerF #11
 Mac McClungG #5
 Marquel SuttonF
 Matas BuzelisF #14
 Nic ClaxtonC #9
 Noa EssengueF #2
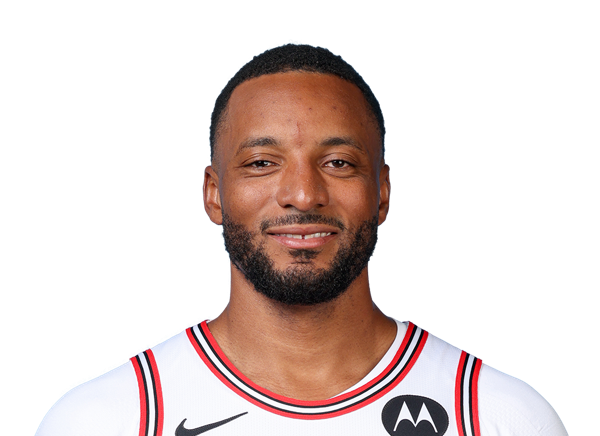 Norman PowellG #24
 Orlando RobinsonC #00
 Patrick WilliamsF #44
 Peter SuderG #15
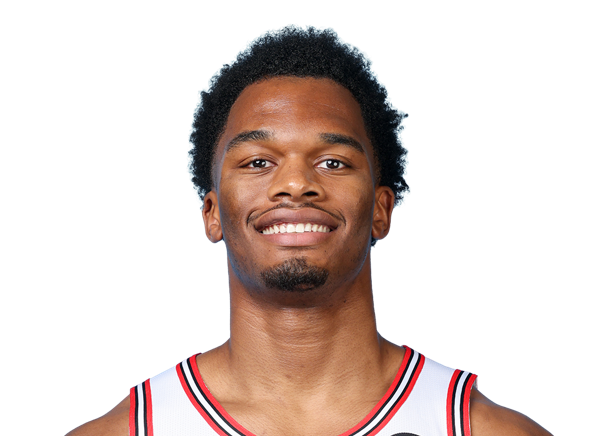 Tobe AwakaF #19
 Tre JonesG #30
 Zach CollinsF #12