


BALLERSCULTURE PLAYER PROFILE · 2026-27
Guerschon Yabusele
Chicago Bulls · F • #28 • 6' 7" 265 lbs

01 / 2026-27 PER-GAME AVERAGES
Season snapshot
No regular-season 2026-27 statistics are recorded for this player. Career history is shown further down.
02 / EVERY SEASON SINCE 2022-23, SIDE BY SIDE
2022-23 to 2026-27
Per game
| Season | Team | GP | GS | MIN | PTS | REB | AST | STL | BLK | TO | FG% | 3P% | FT% |
|---|---|---|---|---|---|---|---|---|---|---|---|---|---|
| 2022-23 | — | — | — | — | — | — | — | — | — | — | — | — | — |
| 2023-24 | — | — | — | — | — | — | — | — | — | — | — | — | — |
| 2024-25 | Philadelphia 76ers | 70 | 43 | 27.1 | 11.0 | 5.6 | 2.1 | 0.8 | 0.3 | 1.2 | 50.1 | 38.0 | 72.5 |
| 2025-26 | New York Knicks | 67 | 19 | 15.0 | 5.6 | 3.5 | 0.9 | 0.4 | 0.2 | 0.6 | 40.1 | 35.2 | 75.0 |
| 2026-27 | — | — | — | — | — | — | — | — | — | — | — | — | — |
Season totals
| Season | Team | GP | GS | MIN | PTS | REB | AST | STL | BLK | TO | FG% | 3P% | FT% |
|---|---|---|---|---|---|---|---|---|---|---|---|---|---|
| 2022-23 | — | — | — | — | — | — | — | — | — | — | — | — | — |
| 2023-24 | — | — | — | — | — | — | — | — | — | — | — | — | — |
| 2024-25 | Philadelphia 76ers | — | — | — | 768 | 395 | 148 | 58 | 24 | 87 | 50.1 | 38.0 | 72.5 |
| 2025-26 | New York Knicks | — | — | — | 112 | 87 | 18 | 6 | 5 | 15 | 39.3 | 29.4 | 66.7 |
| 2026-27 | — | — | — | — | — | — | — | — | — | — | — | — | — |
Click a season to open this player’s full game log, splits and advanced stats for that year; click a team to open its page. A dash means no NBA games were recorded.
03 / SEASON-BY-SEASON HISTORY
Career statistics
Regular Season Averages
| Season | Team | GP | GS | MIN | FG | FG% | 3PT | 3P% | FT | FT% | OR | DR | REB | AST | BLK | STL | PF | TO | PTS |
|---|---|---|---|---|---|---|---|---|---|---|---|---|---|---|---|---|---|---|---|
| 2017-18 | Boston Celtics | 33 | 4 | 7.1 | 0.8-1.8 | 42.6 | 0.4-1.1 | 32.4 | 0.5-0.7 | 68.2 | 0.5 | 1.1 | 1.6 | 0.5 | 0.2 | 0.1 | 0.7 | 0.4 | 2.4 |
| 2018-19 | Boston Celtics | 41 | 1 | 6.1 | 0.9-1.9 | 45.5 | 0.2-0.7 | 32.1 | 0.4-0.5 | 68.2 | 0.6 | 0.7 | 1.3 | 0.4 | 0.2 | 0.2 | 0.8 | 0.4 | 2.3 |
| 2024-25 | Philadelphia 76ers | 70 | 43 | 27.1 | 4.0-8.0 | 50.1 | 1.5-3.9 | 38.0 | 1.4-2.0 | 72.5 | 1.9 | 3.7 | 5.6 | 2.1 | 0.3 | 0.8 | 2.3 | 1.2 | 11.0 |
| 2025-26 | New York Knicks | 41 | 0 | 8.9 | 1.0-2.6 | 39.3 | 0.5-1.7 | 29.4 | 0.2-0.3 | 66.7 | 0.6 | 1.5 | 2.1 | 0.4 | 0.1 | 0.1 | 0.9 | 0.4 | 2.7 |
| 2025-26 | Chicago Bulls | 26 | 19 | 24.7 | 3.2-7.9 | 40.5 | 1.9-4.9 | 38.3 | 1.8-2.3 | 76.7 | 1.2 | 4.4 | 5.7 | 1.7 | 0.4 | 0.8 | 1.7 | 1.0 | 10.0 |
| 2025-26 | 2025 26 Totals | 67 | 19 | 15.0 | 1.9-4.7 | 40.1 | 1.0-2.9 | 35.2 | 0.8-1.1 | 75.0 | 0.8 | 2.7 | 3.5 | 0.9 | 0.2 | 0.4 | 1.2 | 0.6 | 5.6 |
| Career | — | 211 | 67 | 16.1 | 2.2-4.8 | 46.2 | 0.9-2.5 | 36.3 | 0.9-1.2 | 72.4 | 1.1 | 2.4 | 3.5 | 1.1 | 0.2 | 0.5 | 1.4 | 0.7 | 6.2 |
Regular Season Totals
| Season | Team | FG | FG% | 3PT | 3P% | FT | FT% | OR | DR | REB | AST | BLK | STL | PF | TO | PTS |
|---|---|---|---|---|---|---|---|---|---|---|---|---|---|---|---|---|
| 2017-18 | Boston Celtics | 26-61 | 42.6 | 12-37 | 32.4 | 15-22 | 68.2 | 17 | 35 | 52 | 16 | 5 | 4 | 23 | 12 | 79 |
| 2018-19 | Boston Celtics | 35-77 | 45.5 | 9-28 | 32.1 | 15-22 | 68.2 | 23 | 30 | 53 | 15 | 7 | 8 | 32 | 15 | 94 |
| 2024-25 | Philadelphia 76ers | 282-563 | 50.1 | 104-274 | 38.0 | 100-138 | 72.5 | 134 | 261 | 395 | 148 | 24 | 58 | 164 | 87 | 768 |
| 2025-26 | New York Knicks | 42-107 | 39.3 | 20-68 | 29.4 | 8-12 | 66.7 | 24 | 63 | 87 | 18 | 5 | 6 | 36 | 15 | 112 |
| 2025-26 | Chicago Bulls | 83-205 | 40.5 | 49-128 | 38.3 | 46-60 | 76.7 | 32 | 115 | 147 | 45 | 11 | 20 | 45 | 26 | 261 |
| 2025-26 | 2025 26 Totals | 125-312 | 40.1 | 69-196 | 35.2 | 54-72 | 75.0 | 56 | 178 | 234 | 63 | 16 | 26 | 81 | 41 | 373 |
| Career | — | 468-1013 | 46.2 | 194-535 | 36.3 | 184-254 | 72.4 | 230 | 504 | 734 | 242 | 52 | 96 | 300 | 155 | 1314 |
Regular Season Misc Totals
| Season | Team | DD2 | TD3 | DQ | EJECT | TECH | FLAG | AST/TO | STL/TO | SC-EFF | SH-EFF |
|---|---|---|---|---|---|---|---|---|---|---|---|
| 2017-18 | Boston Celtics | 0 | 0 | 0 | 0 | 0 | 0 | 1.3 | 0.3 | 1.295 | 0.52 |
| 2018-19 | Boston Celtics | 0 | 0 | 0 | 0 | 0 | 0 | 1.0 | 0.5 | 1.221 | 0.51 |
| 2024-25 | Philadelphia 76ers | 3 | 0 | 0 | 0 | 1 | 0 | 1.7 | 0.7 | 1.364 | 0.59 |
| 2025-26 | New York Knicks | 0 | 0 | 0 | 0 | 0 | 0 | 1.2 | 0.4 | 1.047 | 0.49 |
| 2025-26 | Chicago Bulls | 4 | 0 | 0 | 0 | 0 | 0 | 1.7 | 0.8 | 1.273 | 0.52 |
| 2025-26 | 2025 26 Totals | 4 | 0 | 0 | 0 | 0 | 0 | 1.5 | 0.6 | 1.196 | 0.51 |
| Career | — | 7 | 0 | 0 | 0 | 1 | 0 | 1.6 | 0.6 | 1.297 | 0.56 |
Scoring, rebounding and assist trend
04 / SHOT CHART AND ZONE SHOOTING
Shot profile
Shot-location data is not connected. Add a BALLDONTLIE GOAT-tier NBA API key in NBA Players → Settings to enable shot charts and zone shooting.
05 / RECORD, TEAM STATS AND TEAMMATES
Team
Overall3-10
Home1-4
Road2-6
DIV1-1
CONF2-9
Last Ten Games2-8
Team records for 2026-27 (regular season).
Team statistics 2026-27
Defensive
| Metric | Total | Per game | NBA rank |
|---|---|---|---|
| Blocks | 75 | 5.769 | 3rd |
| Defensive Rebounds | 407 | 31.308 | 4th |
| Steals | 108 | 8.308 | 3rd |
| Points Conceded Off Turnovers | 0 | 22 | — |
| Defensive Rebound Rate | 0.0 | — | — |
| Defensive Rebounds Per Game | 31.3 | — | — |
| Blocks Per Game | 5.8 | — | — |
| Steals Per Game | 8.3 | — | — |
| Defensive Rebounds Per 48 | 0.0 | — | — |
| Blocks Per 48 | 0.0 | — | — |
| Steals Per 48 | 0.0 | — | — |
General
| Metric | Total | Per game | NBA rank |
|---|---|---|---|
| Disqualifications | 0 | — | — |
| Flagrant Fouls | 2 | 0.154 | Tied-1st |
| Fouls | 304 | 23.385 | 3rd |
| Rebound Rate | 50.0 | — | 2nd |
| Ejections | 0 | — | — |
| Technical Fouls | 26 | 1 | Tied-1st |
| Rebounds | 569 | 43.77 | — |
| Minutes | 0 | — | — |
| Minutes Per Game | 0.0 | — | — |
| Fantasy Rating | 0.0 | — | — |
| Rating | 207.6 | — | 4th |
| Plus-Minus | -1 | -1 | Tied-1st |
| Game Day of Year | 0 | — | — |
| Rebounds Per Game | 43.8 | — | — |
| Fouls Per Game | 23.4 | — | — |
| Flagrant Fouls Per Game | 0.2 | — | — |
| Technical Fouls Per Game | 2.0 | — | — |
| Ejections Per Game | 0.0 | — | — |
| Disqualifications Per Game | 0.0 | — | — |
| Assist To Turnover Ratio | 1.6 | 1.605 | — |
| Steal To Foul Ratio | 0.4 | 0.355 | — |
| Block To Foul Ratio | 0.2 | 0.247 | — |
| Team Rebounds Per Game | 0.0 | — | — |
| Rebounds | 569 | 43.77 | — |
| Total Technical Fouls | 26 | 1 | — |
| Assist To Turnover Ratio | 70.6 | — | — |
| Team Rebounds | 0 | — | — |
| Steal To Turnover Ratio | 0.5 | 0.491 | — |
| Rebounds Per 48 Minutes | 0.0 | — | — |
| Fouls Per 48 Minutes | 0.0 | — | — |
| Flagrant Fouls Per 48 Minutes | 0.0 | — | — |
| Technical Fouls Per 48 Minutes | 0.0 | — | — |
| Ejections Per 48 Minutes | 0.0 | — | — |
| Disqualifications Per 48 Minutes | 0.0 | — | — |
| Games Played | 13 | — | 4th |
| Games Started | 0 | — | — |
| Double Double | 0 | — | — |
| Triple Double | 0 | — | — |
Offensive
| Metric | Total | Per game | NBA rank |
|---|---|---|---|
| Assists | 353 | 27.154 | 3rd |
| Effective Field Goal Percentage | 51.8 | — | 4th |
| Field Goals | 520/1163 | 0.447 | — |
| Field Goals Attempted | 1163 | 89.462 | 4th |
| Field Goals Made | 520 | 40 | 4th |
| Field Goal Percentage | 44.7 | 0.447 | 4th |
| Free Throws | 286/376 | 0.761 | — |
| Free Throw Percentage | 76.1 | 0.761 | 3rd |
| Free Throws Attempted | 376 | 28.923 | 1st |
| Free Throws Made | 286 | 22 | 1st |
| Offensive Rebounds | 162 | 12.462 | 3rd |
| Points | 1490 | 114.615 | 3rd |
| Turnovers | 220 | 16.923 | 2nd |
| 3-Point Field Goal Percentage | 30.8 | 0.308 | 5th |
| 3-Point Field Goals Attempted | 532 | 40.923 | 3rd |
| 3-Point Field Goals Made | 164 | 12.615 | 4th |
| True Shooting Percentage | 56.1 | — | 4th |
| Team Turnovers | 5 | — | 5th |
| Total Turnovers | 225 | 16.923 | — |
| Assist Ratio | 18.5 | — | 4th |
| Points in the Paint | 644 | 49 | 3rd |
| Offensive Rebound Rate | 28.7 | — | 1st |
| Turnover Ratio | 14.5 | — | 2nd |
| Fast Break Points | 210 | — | — |
| Possessions | 1391 | — | 4th |
| Pace Factor | 102.4 | — | 2nd |
| Average Field Goals Made | 40.0 | — | — |
| Average Field Goals Attempted | 89.5 | — | — |
| Average 3-Point Field Goals Made | 12.6 | — | — |
| Average 3-Point Field Goals Attempted | 40.9 | — | — |
| Average Free Throws Made | 22.0 | — | — |
| Average Free Throws Attempted | 28.9 | — | — |
| Points Per Game | 114.6 | — | — |
| Offensive Rebounds Per Game | 12.5 | — | — |
| Assists Per Game | 27.2 | — | — |
| Turnovers Per Game | 16.9 | — | — |
| Offensive Rebound Percentage | 0.3 | 0.252 | — |
| Estimated Possessions | 1376.4 | 105.492 | — |
| Estimated Possessions Per Game | 105.9 | — | — |
| Points Per Estimated Possession | 1.1 | 1.086 | — |
| Team Turnovers Per Game | 0.4 | — | — |
| Total Turnovers Per Game | 17.3 | — | — |
| 3-Point Field Goal Percentage | 30.8 | 0.308 | 1st |
| 2-Point Field Goals Made | 356.0 | 27.385 | — |
| 2-Point Field Goals Attempted | 631.0 | 48.539 | 1st |
| 2-Point Field Goals Made per Game | 27.4 | — | — |
| 2-Point Field Goals Attempted per Game | 48.5 | — | — |
| 2-Point Field Goal Percentage | 56.4 | 0.564 | — |
| Shooting Efficiency | 0.52 | 0.518 | — |
| Scoring Efficiency | 1.281 | 1.281 | — |
| Fieldgoals Made Per 48 | 0.0 | — | — |
| Fieldgoals Attempted Per 48 | 0.0 | — | — |
| 3-Point Fieldgoals Made Per 48 | 0.0 | — | — |
| 3-Point Fieldgoals Attempted Per 48 | 0.0 | — | — |
| Freethrows Made Per 48 | 0.0 | — | — |
| Freethrows Attempted Per 48 | 0.0 | — | — |
| Points Scored Per 48 | 0.0 | — | — |
| Offensive Rebounds Per 48 | 0.0 | — | — |
| Assists Per 48 | 0.0 | — | — |
| Turnovers | 0.0 | — | — |
Teammates
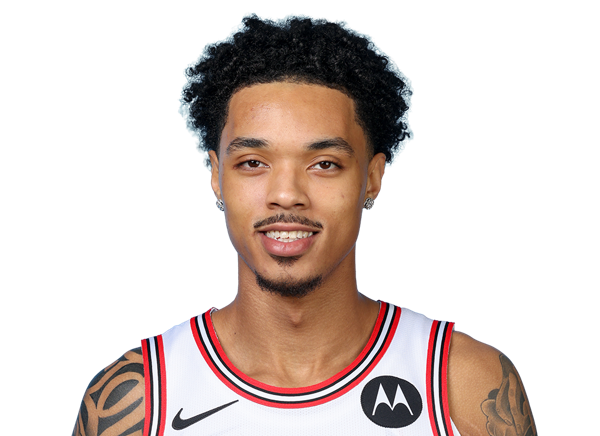 Brandon Boston Jr.G #13
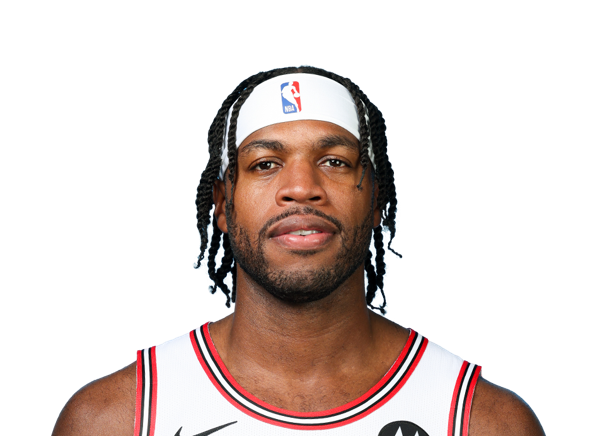 Buddy HieldG #7
 Caleb WilsonF #8
 Dailyn SwainG #5
 Drew PetersonF #21
 Isaac OkoroF #35
 Isaiah StevensG #99
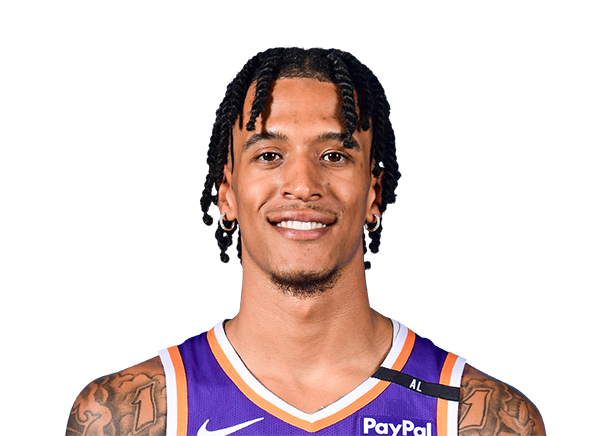 Jalen BridgesF #20
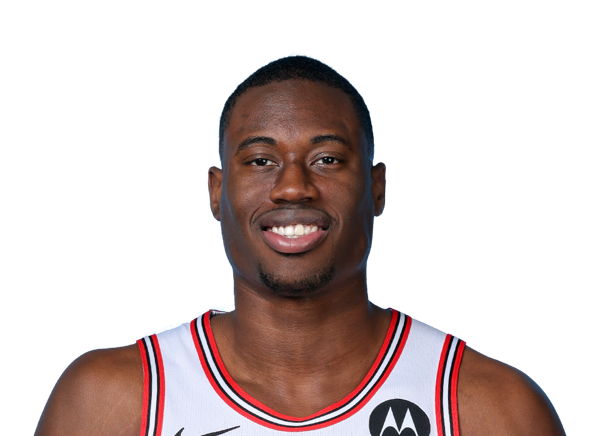 Jalen SmithF #25
 Jaylin SellersG #22
 Jordan HawkinsG #15
 Josh GiddeyG #3
 Lachlan OlbrichC #47
 Leonard MillerF #11
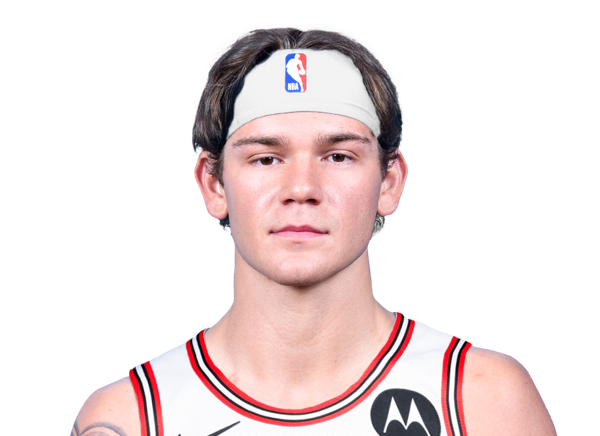 Mac McClungG #5
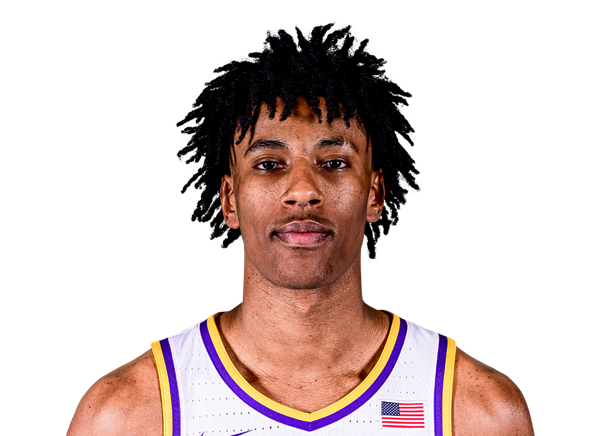 Marquel SuttonF
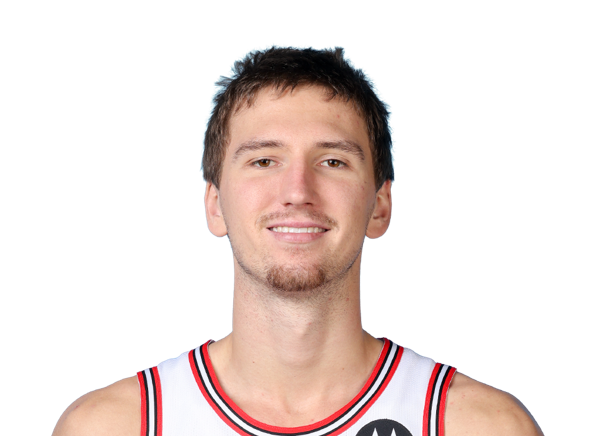 Matas BuzelisF #14
 Nic ClaxtonC #9
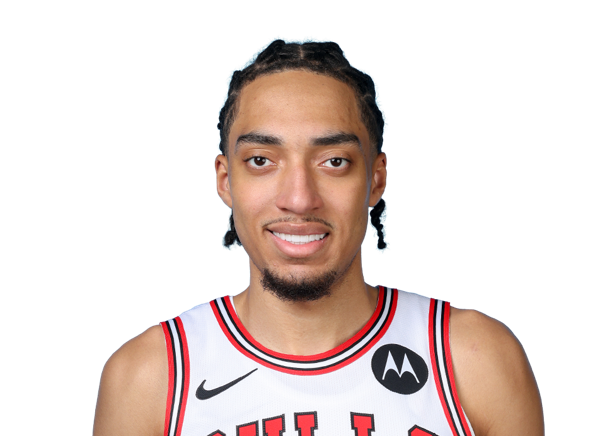 Noa EssengueF #2
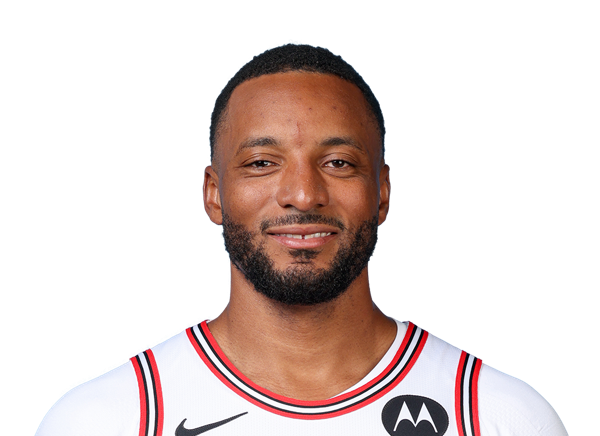 Norman PowellG #24
 Orlando RobinsonC #00
 Patrick WilliamsF #44
 Peter SuderG #15
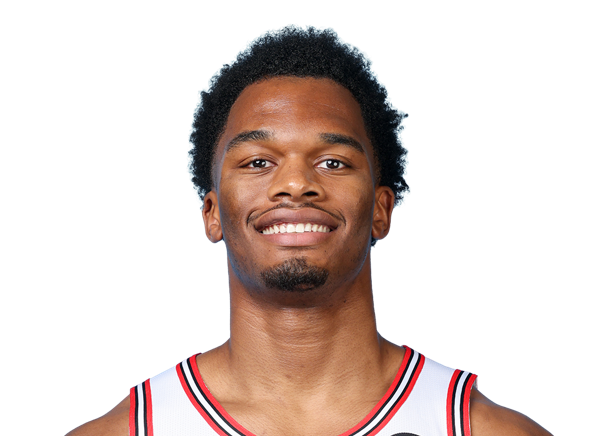 Tobe AwakaF #19
 Tre JonesG #30
 Zach CollinsF #12
06 / SALARY BY SEASON
Contract
| Season | Salary |
|---|---|
| 2017-18 | $2.25M |
| 2018-19 | $2.67M |
| 2024-25 | $2.09M |
| 2025-26 | $5.5M |
Total listed: $12.5M · source: espn.
07 / LATEST REPORT
Injury status
No current injury report entry for this player.
08 / SIGNINGS, TRADES AND ROSTER MOVES
Transactions
No recorded transactions for this player.
09 / LATEST COVERAGE
Player news
LATEST UPDATEYabusele agreed to a three-year deal with Panathinaikos in Greece on Tuesday, Michael Scotto of USA Today reports.
Yabusele will head overseas after spending the last two seasons in the NBA. He saw an inconsistent role with the Knicks last season before being traded to the Bulls, finishing the campaign with averages of 5.6 points, 3.5 rebounds and 0.9 assists in 15.0 minutes per game across 67 regular-season appearances (19 starts).
24 March 2026Ranking the 10 best and 10 worst NBA deals since 2025 offseason↗
9 March 2026Fantasy basketball picks, DFS and betting tips for Sunday's NBA games↗
25 February 2026Fantasy basketball picks, DFS and betting tips for Tuesday's NBA games↗
9 January 2026NBA trade deadline: Six offers that reshape the playoff chase↗
6 November 2025New-look Knicks: Early-season intel, numbers, what's next in New York↗
2 July 2025Sources: Knicks land C Guerschon Yabusele on 2-year, $12M deal↗
10 / BIO, DRAFT AND CONTACT DETAILS
Biography & profile
TeamChicago Bulls
PositionForward
Jersey28
Height6' 7"
Weight265 lbs
Age30
StatusFree Agent