Click a season to open this player’s full game log, splits and advanced stats for that year; click a team to open its page. A dash means no NBA games were recorded.
03 / EVERY CATEGORY THE PROVIDER REPORTS
Full statistical breakdown
Regular season 2026-27
Defensive
Metric
Total
NBA rank
Blocks
0
Tied-376th
Defensive Rebounds
4
Tied-382nd
Steals
4
Tied-275th
Defensive Rebound Rate
0.0
—
Defensive Rebounds Per Game
0.4
—
Blocks Per Game
0.0
—
Steals Per Game
0.4
—
Defensive Rebounds Per 48
4.6
3,056th
Blocks Per 48
0.0
3,008th
Steals Per 48
4.6
2,200th
General
Metric
Total
NBA rank
Disqualifications
0
Tied-22nd
Flagrant Fouls
0
Tied-24th
Fouls
5
Tied-368th
Player Efficiency Rating
14.02
—
Rebound Rate
0.0
—
Ejections
0
Tied-7th
Technical Fouls
0
Tied-104th
Rebounds
5
—
Value Over Replacement Player
2.0
—
Minutes
42
Tied-6th
Minutes Per Game
4.7
—
Rating
3.6
Tied-227th
Plus-Minus
+28
Tied-1st
Rebounds Per Game
0.6
—
Fouls Per Game
0.6
—
Flagrant Fouls Per Game
0.0
—
Technical Fouls Per Game
0.0
—
Ejections Per Game
0.0
—
Disqualifications Per Game
0.0
—
Assist To Turnover Ratio
1.6
—
Steal To Foul Ratio
0.8
—
Block To Foul Ratio
0.0
—
Team Rebounds Per Game
0.0
—
Rebounds
5
—
Total Technical Fouls
0
—
Assist To Turnover Ratio
0.0
—
Steal To Turnover Ratio
0.8
—
Rebounds Per 48 Minutes
5.7
—
Fouls Per 48 Minutes
5.7
2,944th
Flagrant Fouls Per 48 Minutes
0.0
192nd
Technical Fouls Per 48 Minutes
0.0
832nd
Ejections Per 48 Minutes
0.0
56th
Disqualifications Per 48 Minutes
0.0
176th
R/40
4.8
—
Games Played
9
9th
Games Started
0
Tied-258th
Double Double
0
Tied-121st
Triple Double
0
Tied-13th
Offensive
Metric
Total
NBA rank
Assists
8
Tied-308th
Effective Field Goal Percentage
42.9
—
Field Goals
3/7
—
Field Goals Attempted
7
Tied-410th
Field Goals Made
3
Tied-407th
Field Goal Percentage
42.9
—
Free Throws
9/11
—
Free Throw Percentage
81.8
—
Free Throws Attempted
11
Tied-250th
Free Throws Made
9
Tied-237th
Offensive Rebounds
1
Tied-392nd
Points
15
Tied-379th
Turnovers
5
Tied-297th
3-Point Field Goal Percentage
0.0
—
3-Point Field Goals Attempted
0
Tied-421st
3-Point Field Goals Made
0
Tied-379th
True Shooting Percentage
63.3
—
Total Turnovers
5
—
Assist Ratio
32.2
—
Points in the Paint
0
Tied-1st
Offensive Rebound Rate
0.0
—
Turnover Ratio
20.1
—
Brick Index
0.00
—
Usage Rate
0.0
—
Average Field Goals Made
0.3
—
Average Field Goals Attempted
0.8
—
Average 3-Point Field Goals Made
0.0
—
Average 3-Point Field Goals Attempted
0.0
—
Average Free Throws Made
1.0
—
Average Free Throws Attempted
1.2
—
Points Per Game
1.7
—
Offensive Rebounds Per Game
0.1
—
Assists Per Game
0.9
—
Turnovers Per Game
0.6
—
Offensive Rebound Percentage
0.3
—
Estimated Possessions
15.4
—
Estimated Possessions Per Game
1.7
—
Points Per Estimated Possession
1.0
—
Team Turnovers Per Game
0.0
—
Total Turnovers Per Game
0.6
—
3-Point Field Goal Percentage
0.0
—
2-Point Field Goals Made
3.0
Tied-28th
2-Point Field Goals Attempted
7.0
11th
2-Point Field Goals Made per Game
0.3
—
2-Point Field Goals Attempted per Game
0.8
—
2-Point Field Goal Percentage
42.9
Tied-2nd
Shooting Efficiency
0.43
—
Scoring Efficiency
2.143
—
Fieldgoals Made Per 48
3.4
3,256th
Fieldgoals Attempted Per 48
8.0
3,280th
3-Point Fieldgoals Made Per 48
0.0
3,032nd
3-Point Fieldgoals Attempted Per 48
0.0
3,368th
Freethrows Made Per 48
10.3
1,896th
Freethrows Attempted Per 48
12.6
2,000th
Points Scored Per 48
17.1
3,032nd
Offensive Rebounds Per 48
1.1
3,136th
Assists Per 48
9.1
2,464th
Turnovers
5.7
2,376th
P/40
14.3
—
A/40
7.6
—
04 / EFFICIENCY, SHOOTING PROFILE, PER-36
Advanced metrics
True shooting %64.0%
Effective FG %37.5%
2-point FG %37.5%
3-point attempt rate0.0%
Free throw rate150.0%
Points per shot attempt2.13
% of points from 3s0.0%
Assist-to-turnover1.50
Points per 36 min13.0
Rebounds per 36 min4.6
Assists per 36 min6.9
Steals per 36 min3.06
Blocks per 36 min0.00
Turnovers per 36 min4.60
Stocks (STL + BLK) per game0.40
Pts + Reb + Ast per game3.2
Efficiency (EFF) per game2.3
Game Score per game (Hollinger)1.6
Minutes per game4.7
Calculated by BallersCulture from the supplied 2026-27 box-score totals using standard formulas (hover a tile to see the formula). Tracking-based metrics such as BPM, VORP, on/off and RAPTOR are not available from this data source.
05 / 9 GAMES IN 2026-27
Game log: Regular season
Date
Opp
Result
MIN
FG
FG%
3PT
3P%
FT
FT%
REB
AST
BLK
STL
PF
TO
PTS
Nov 13
@ PHI
L 123-112
2
0-0
0.0
0-0
0.0
1-2
50.0
0
0
0
0
0
0
1
Nov 10
vs MEM
L 118-102
9
0-0
0.0
0-0
0.0
0-0
0.0
1
3
0
0
1
2
0
Nov 7
@ MIL
W 121-107
8
1-2
50.0
0-0
0.0
1-2
50.0
0
1
0
0
1
1
3
Nov 5
@ DEN
L 128-109
4
0-0
0.0
0-0
0.0
2-2
100.0
1
0
0
1
0
0
2
Nov 2
@ LAL
L 131-125
4
1-2
50.0
0-0
0.0
1-1
100.0
1
2
0
1
1
0
3
Oct 29
vs ORL
W 129-99
5
0-1
0.0
0-0
0.0
0-0
0.0
1
1
0
2
0
1
0
Oct 26
@ MIN
L 117-94
5
1-1
100.0
0-0
0.0
4-4
100.0
1
1
0
0
0
0
6
Oct 24
@ WSH
W 112-102
1
0-0
0.0
0-0
0.0
0-0
0.0
0
0
0
0
0
0
0
Oct 22
vs CHI
W 135-92
5
0-1
0.0
0-0
0.0
0-0
0.0
0
0
0
0
2
1
0
06 / 2026-27 HOME / AWAY, RESULTS, MONTHS AND OPPONENTS
Splits
split
Split
GP
MIN
FG
FG%
3PT
3P%
FT
FT%
OR
DR
REB
AST
BLK
STL
PF
TO
PTS
All Splits
9
4.7
0.3-0.8
42.9
0.0-0.0
0.0
1.0-1.2
81.8
0.1
0.4
0.6
0.9
0.0
0.4
0.6
0.6
1.7
Home
3
6.3
0.0-0.7
0.0
0.0-0.0
0.0
0.0-0.0
0.0
0.0
0.7
0.7
1.3
0.0
0.7
1.0
1.3
0.0
Road
6
3.8
0.5-0.8
60.0
0.0-0.0
0.0
1.5-1.8
81.8
0.2
0.3
0.5
0.7
0.0
0.3
0.3
0.2
2.5
vs. Division
1
2.0
0.0-0.0
0.0
0.0-0.0
0.0
1.0-2.0
50.0
0.0
0.0
0.0
0.0
0.0
0.0
0.0
0.0
1.0
vs. Conference
5
4.0
0.2-0.8
25.0
0.0-0.0
0.0
0.4-0.8
50.0
0.0
0.2
0.2
0.4
0.0
0.4
0.6
0.6
0.8
3+ Days Rest
2
4.5
0.5-1.5
33.3
0.0-0.0
0.0
0.5-0.5
100.0
0.5
0.0
0.5
1.0
0.0
0.5
1.5
0.5
1.5
Month
Split
GP
MIN
FG
FG%
3PT
3P%
FT
FT%
OR
DR
REB
AST
BLK
STL
PF
TO
PTS
October
4
3.8
0.3-0.8
33.3
0.0-0.0
0.0
1.0-1.0
100.0
0.0
0.5
0.5
0.5
0.0
0.5
0.5
0.5
1.5
November
5
5.4
0.4-0.8
50.0
0.0-0.0
0.0
1.0-1.4
71.4
0.2
0.4
0.6
1.2
0.0
0.4
0.6
0.6
1.8
Pre All-Star
9
4.7
0.3-0.8
42.9
0.0-0.0
0.0
1.0-1.2
81.8
0.1
0.4
0.6
0.9
0.0
0.4
0.6
0.6
1.7
Result
Split
GP
MIN
FG
FG%
3PT
3P%
FT
FT%
OR
DR
REB
AST
BLK
STL
PF
TO
PTS
Wins
4
4.8
0.3-1.0
25.0
0.0-0.0
0.0
0.3-0.5
50.0
0.0
0.3
0.3
0.5
0.0
0.5
0.8
0.8
0.8
Losses
5
4.6
0.4-0.6
66.7
0.0-0.0
0.0
1.6-1.8
88.9
0.2
0.6
0.8
1.2
0.0
0.4
0.4
0.4
2.4
Day
Split
GP
MIN
FG
FG%
3PT
3P%
FT
FT%
OR
DR
REB
AST
BLK
STL
PF
TO
PTS
Monday
1
9.0
0.0-0.0
0.0
0.0-0.0
0.0
0.0-0.0
0.0
0.0
1.0
1.0
3.0
0.0
0.0
1.0
2.0
0.0
Wednesday
3
4.7
0.0-0.7
0.0
0.0-0.0
0.0
0.7-0.7
100.0
0.0
0.7
0.7
0.3
0.0
1.0
0.7
0.7
0.7
Thursday
1
2.0
0.0-0.0
0.0
0.0-0.0
0.0
1.0-2.0
50.0
0.0
0.0
0.0
0.0
0.0
0.0
0.0
0.0
1.0
Friday
2
4.5
0.5-1.0
50.0
0.0-0.0
0.0
0.5-1.0
50.0
0.0
0.0
0.0
0.5
0.0
0.0
0.5
0.5
1.5
Sunday
2
4.5
1.0-1.5
66.7
0.0-0.0
0.0
2.5-2.5
100.0
0.5
0.5
1.0
1.5
0.0
0.5
0.5
0.0
4.5
Opponent
Split
GP
MIN
FG
FG%
3PT
3P%
FT
FT%
OR
DR
REB
AST
BLK
STL
PF
TO
PTS
Chicago Bulls
1
5.0
0.0-1.0
0.0
0.0-0.0
0.0
0.0-0.0
0.0
0.0
0.0
0.0
0.0
0.0
0.0
2.0
1.0
0.0
Denver Nuggets
1
4.0
0.0-0.0
0.0
0.0-0.0
0.0
2.0-2.0
100.0
0.0
1.0
1.0
0.0
0.0
1.0
0.0
0.0
2.0
Los Angeles Lakers
1
4.0
1.0-2.0
50.0
0.0-0.0
0.0
1.0-1.0
100.0
1.0
0.0
1.0
2.0
0.0
1.0
1.0
0.0
3.0
Memphis Grizzlies
1
9.0
0.0-0.0
0.0
0.0-0.0
0.0
0.0-0.0
0.0
0.0
1.0
1.0
3.0
0.0
0.0
1.0
2.0
0.0
Milwaukee Bucks
1
8.0
1.0-2.0
50.0
0.0-0.0
0.0
1.0-2.0
50.0
0.0
0.0
0.0
1.0
0.0
0.0
1.0
1.0
3.0
Minnesota Timberwolves
1
5.0
1.0-1.0
100.0
0.0-0.0
0.0
4.0-4.0
100.0
0.0
1.0
1.0
1.0
0.0
0.0
0.0
0.0
6.0
Orlando Magic
1
5.0
0.0-1.0
0.0
0.0-0.0
0.0
0.0-0.0
0.0
0.0
1.0
1.0
1.0
0.0
2.0
0.0
1.0
0.0
Philadelphia 76ers
1
2.0
0.0-0.0
0.0
0.0-0.0
0.0
1.0-2.0
50.0
0.0
0.0
0.0
0.0
0.0
0.0
0.0
0.0
1.0
Washington Wizards
1
1.0
0.0-0.0
0.0
0.0-0.0
0.0
0.0-0.0
0.0
0.0
0.0
0.0
0.0
0.0
0.0
0.0
0.0
0.0
07 / SEASON-BY-SEASON HISTORY
Career statistics
Regular Season Averages
Season
Team
GP
GS
MIN
FG
FG%
3PT
3P%
FT
FT%
OR
DR
REB
AST
BLK
STL
PF
TO
PTS
2026-27
Toronto Raptors
9
0
4.7
0.3-0.8
42.9
0.0-0.0
0.0
1.0-1.2
81.8
0.1
0.4
0.6
0.9
0.0
0.4
0.6
0.6
1.7
Career
—
9
0
4.7
0.3-0.8
42.9
0.0-0.0
0.0
1.0-1.2
81.8
0.1
0.4
0.6
0.9
0.0
0.4
0.6
0.6
1.7
Regular Season Totals
Season
Team
FG
FG%
3PT
3P%
FT
FT%
OR
DR
REB
AST
BLK
STL
PF
TO
PTS
2026-27
Toronto Raptors
3-7
42.9
0-0
0.0
9-11
81.8
1
4
5
8
0
4
5
5
15
Career
—
3-7
42.9
0-0
0.0
9-11
81.8
1
4
5
8
0
4
5
5
15
Regular Season Misc Totals
Season
Team
DD2
TD3
DQ
EJECT
TECH
FLAG
AST/TO
STL/TO
SC-EFF
SH-EFF
2026-27
Toronto Raptors
0
0
0
0
0
0
1.6
0.8
2.143
0.43
Career
—
0
0
0
0
0
0
1.6
0.8
2.143
0.43
08 / SHOT CHART AND ZONE SHOOTING
Shot profile
Shot-location data is not connected. Add a BALLDONTLIE GOAT-tier NBA API key in NBA Players → Settings to enable shot charts and zone shooting.
LATEST UPDATEThe Raptors recalled Bradley from the G League's Raptors 905 on Tuesday.
Bradley returns to Toronto after a brief stint with the 905, where he was assigned earlier Tuesday to participate in training camp. The rookie guard has yet to establish a role in Toronto's rotation and figures to continue splitting time between the NBA and G League throughout the season.


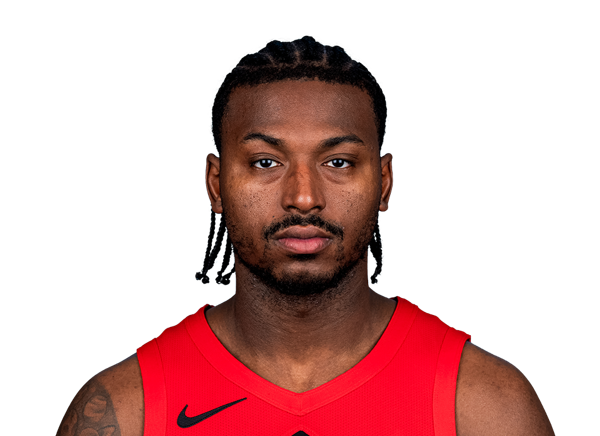

 A.J. LawsonG
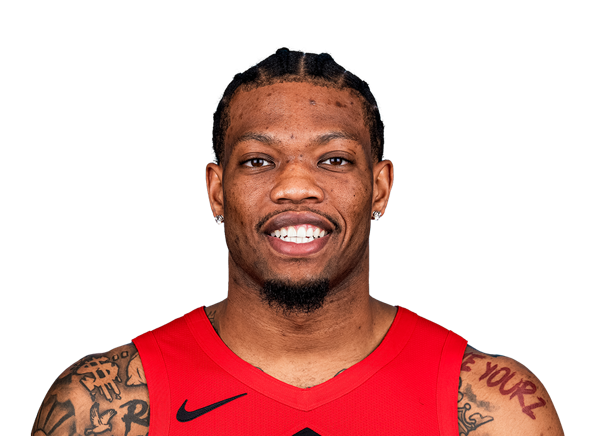 Alijah MartinG #55
 Allen GravesF #22
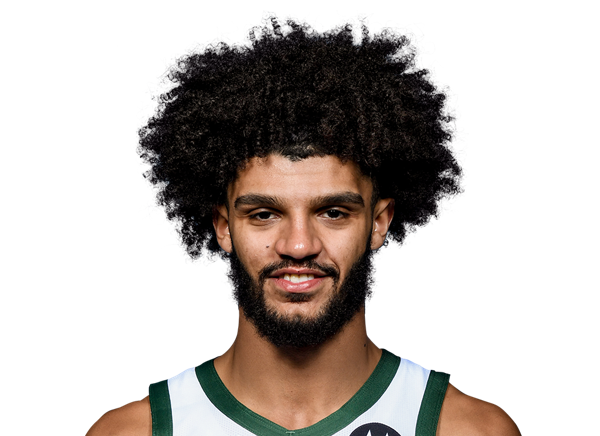 Andre Jackson Jr.G #44
 Chucky HepburnG #24
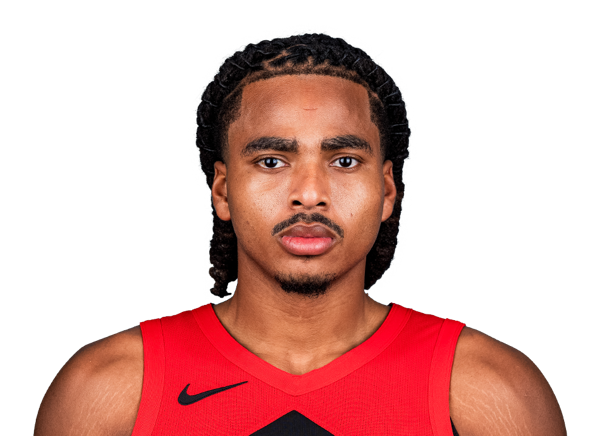 Collin Murray-BoylesF #30
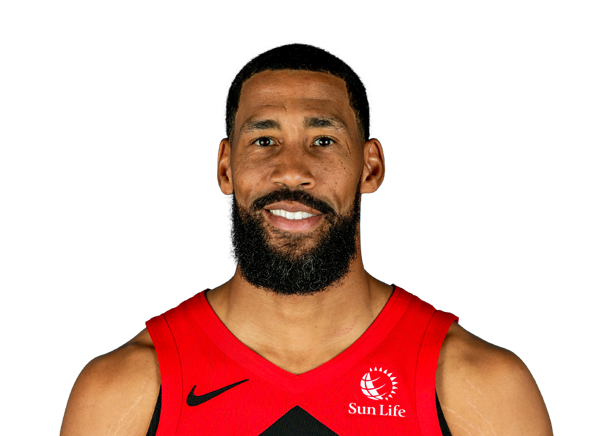 Garrett TempleG #17
 Immanuel QuickleyG #5
 Ja’Kobe WalterG #14
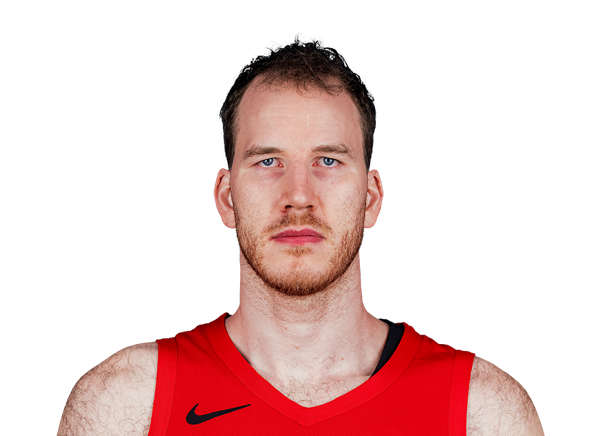 Jakob PoeltlC #19
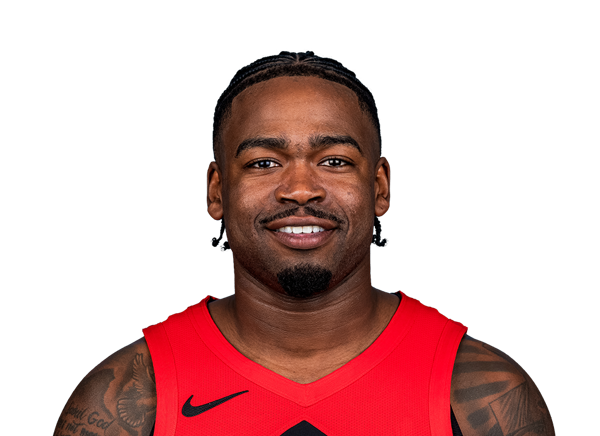 Jamal SheadG #23
 Jamarion SharpC
 Jamison BattleF #77
 Kawhi LeonardF #2
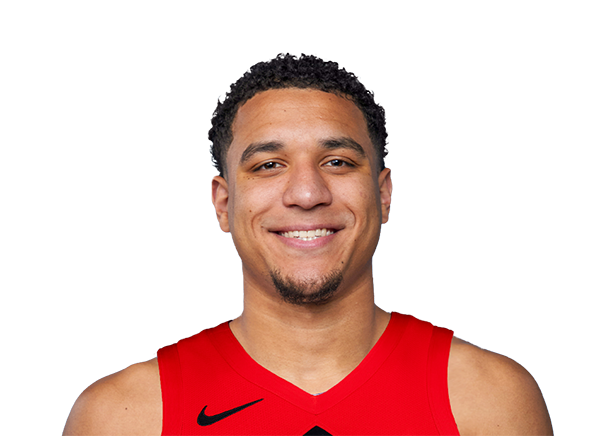 Kevin McCullar Jr.G #9
 Kyle AndersonF #12
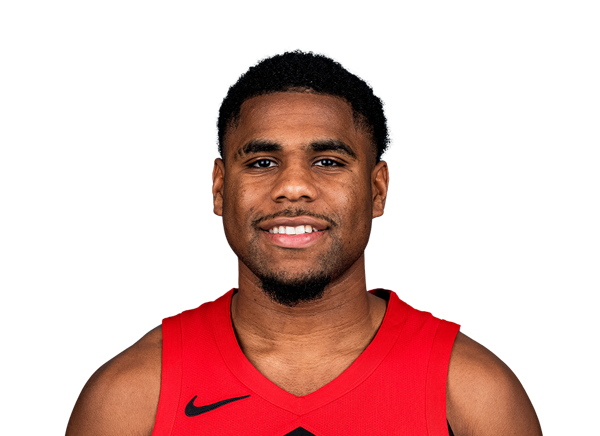 Malachi SmithG #18
 Nate BittleC #12
 Nimari BurnettG #25
 RJ BarrettF #9
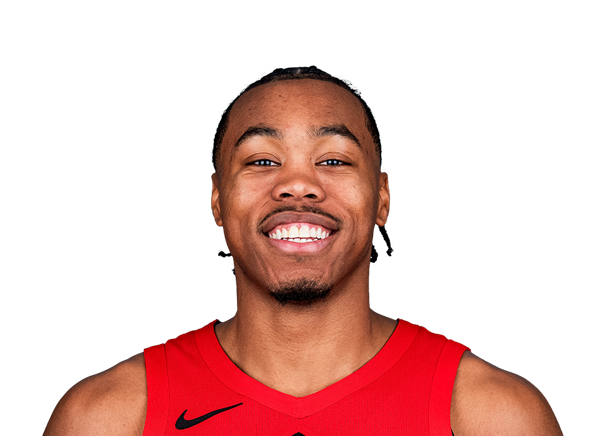 Scottie BarnesF #4
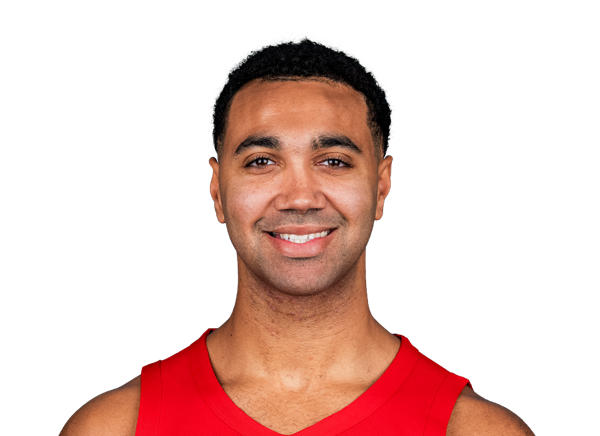 Trayce Jackson-DavisF #32
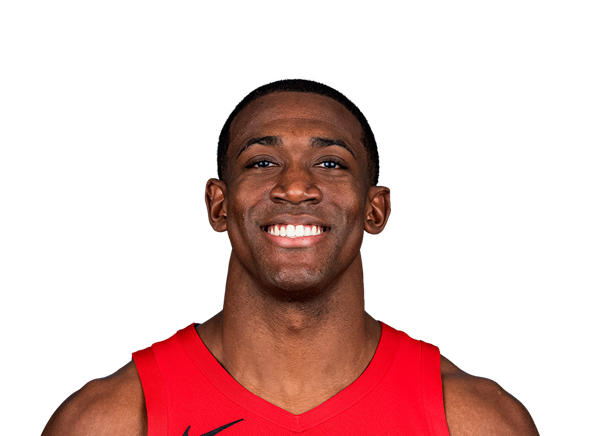 Trey Jemison IIIC #50
 Tyreke KeyG #11
 Tyson DegenhartF #20