Click a season to open this player’s full game log, splits and advanced stats for that year; click a team to open its page. A dash means no NBA games were recorded.
03 / EVERY CATEGORY THE PROVIDER REPORTS
Full statistical breakdown
Regular season 2026-27
Defensive
Metric
Total
NBA rank
Blocks
13
Tied-23rd
Defensive Rebounds
40
Tied-117th
Steals
13
Tied-74th
Defensive Rebound Rate
0.0
—
Defensive Rebounds Per Game
3.3
Tied-106th
Blocks Per Game
1.1
Tied-25th
Steals Per Game
1.1
70th
Defensive Rebounds Per 48
6.6
1,872nd
Blocks Per 48
2.1
368th
Steals Per 48
2.1
1,184th
General
Metric
Total
NBA rank
Disqualifications
0
Tied-21st
Flagrant Fouls
0
Tied-22nd
Fouls
44
Tied-8th
Player Efficiency Rating
13.65
172nd
Rebound Rate
0.0
—
Ejections
0
Tied-7th
Technical Fouls
0
Tied-101st
Rebounds
62
—
Value Over Replacement Player
12.4
—
Minutes
291
Tied-3rd
Minutes Per Game
24.3
—
Rating
19.8
Tied-59th
Plus-Minus
+26
Tied-1st
Rebounds Per Game
5.2
Tied-91st
Fouls Per Game
3.7
Tied-4th
Flagrant Fouls Per Game
0.0
Tied-19th
Technical Fouls Per Game
0.0
Tied-82nd
Ejections Per Game
0.0
Tied-6th
Disqualifications Per Game
0.0
Tied-20th
Assist To Turnover Ratio
1.0
—
Steal To Foul Ratio
0.3
—
Block To Foul Ratio
0.3
—
Team Rebounds Per Game
0.0
—
Rebounds
62
—
Total Technical Fouls
0
—
Assist To Turnover Ratio
0.0
—
Steal To Turnover Ratio
0.6
—
Rebounds Per 48 Minutes
10.2
—
Fouls Per 48 Minutes
7.3
128th
Flagrant Fouls Per 48 Minutes
0.0
352nd
Technical Fouls Per 48 Minutes
0.0
1,616th
Ejections Per 48 Minutes
0.0
112th
Disqualifications Per 48 Minutes
0.0
336th
R/40
8.5
—
Games Played
12
12th
Games Started
6
Tied-149th
Double Double
0
Tied-119th
Triple Double
0
Tied-12th
Offensive
Metric
Total
NBA rank
Assists
21
Tied-182nd
Effective Field Goal Percentage
50.0
—
Field Goals
45/97
—
Field Goals Attempted
97
Tied-148th
Field Goals Made
45
Tied-140th
Field Goal Percentage
46.4
—
Free Throws
24/29
—
Free Throw Percentage
82.8
Tied-105th
Free Throws Attempted
29
Tied-118th
Free Throws Made
24
Tied-107th
Offensive Rebounds
22
Tied-58th
Points
121
Tied-149th
Turnovers
22
Tied-90th
3-Point Field Goal Percentage
29.2
Tied-204th
3-Point Field Goals Attempted
24
Tied-238th
3-Point Field Goals Made
7
Tied-239th
True Shooting Percentage
55.1
—
Total Turnovers
22
—
Assist Ratio
13.7
—
Points in the Paint
0
Tied-1st
Offensive Rebound Rate
0.0
—
Turnover Ratio
14.4
—
Brick Index
0.00
—
Usage Rate
0.0
—
Average Field Goals Made
3.8
—
Average Field Goals Attempted
8.1
Tied-314th
Average 3-Point Field Goals Made
0.6
—
Average 3-Point Field Goals Attempted
2.0
Tied-219th
Average Free Throws Made
2.0
Tied-107th
Average Free Throws Attempted
2.4
Tied-109th
Points Per Game
10.1
143rd
Offensive Rebounds Per Game
1.8
55th
Assists Per Game
1.8
Tied-169th
Turnovers Per Game
1.8
83rd
Offensive Rebound Percentage
0.4
—
Estimated Possessions
108.6
—
Estimated Possessions Per Game
9.1
—
Points Per Estimated Possession
1.1
—
Team Turnovers Per Game
0.0
—
Total Turnovers Per Game
1.8
—
3-Point Field Goal Percentage
29.2
—
2-Point Field Goals Made
38.0
99th
2-Point Field Goals Attempted
73.0
90th
2-Point Field Goals Made per Game
3.2
—
2-Point Field Goals Attempted per Game
6.1
—
2-Point Field Goal Percentage
52.1
1st
Shooting Efficiency
0.50
—
Scoring Efficiency
1.247
—
Fieldgoals Made Per 48
7.4
2,240th
Fieldgoals Attempted Per 48
16.0
2,368th
3-Point Fieldgoals Made Per 48
1.2
3,824th
3-Point Fieldgoals Attempted Per 48
4.0
3,808th
Freethrows Made Per 48
4.0
1,712th
Freethrows Attempted Per 48
4.8
1,888th
Points Scored Per 48
20.0
2,384th
Offensive Rebounds Per 48
3.6
928th
Assists Per 48
3.5
2,912th
Turnovers
3.6
1,440th
P/40
16.6
—
A/40
2.9
—
04 / EFFICIENCY, SHOOTING PROFILE, PER-36
Advanced metrics
True shooting %55.2%
Effective FG %50.6%
2-point FG %52.5%
3-point attempt rate24.7%
Free throw rate29.6%
Points per shot attempt1.25
% of points from 3s17.8%
Assist-to-turnover1.00
Points per 36 min15.0
Rebounds per 36 min7.7
Assists per 36 min2.7
Steals per 36 min1.63
Blocks per 36 min1.63
Turnovers per 36 min2.67
Stocks (STL + BLK) per game2.20
Pts + Reb + Ast per game17.1
Efficiency (EFF) per game12.8
Game Score per game (Hollinger)7.9
Minutes per game24.3
Calculated by BallersCulture from the supplied 2026-27 box-score totals using standard formulas (hover a tile to see the formula). Tracking-based metrics such as BPM, VORP, on/off and RAPTOR are not available from this data source.
05 / 12 GAMES IN 2026-27
Game log: Regular season
Date
Opp
Result
MIN
FG
FG%
3PT
3P%
FT
FT%
REB
AST
BLK
STL
PF
TO
PTS
Nov 16
vs NY
L 112-108 OT
40
2-6
33.3
0-2
0.0
2-2
100.0
13
2
2
1
5
4
6
Nov 13
@ PHI
L 123-112
32
5-9
55.6
1-1
100.0
3-4
75.0
0
4
5
1
3
2
14
Nov 12
vs BOS
L 98-93
20
1-9
11.1
1-5
20.0
2-4
50.0
4
3
1
0
4
2
5
Nov 7
@ MIL
W 121-107
34
7-12
58.3
0-2
0.0
5-5
100.0
7
2
1
4
4
3
19
Nov 5
@ DEN
L 128-109
23
6-10
60.0
1-2
50.0
0-0
0.0
3
2
0
0
3
1
13
Nov 3
@ LAC
W 125-118
28
7-14
50.0
1-3
33.3
3-4
75.0
7
0
2
0
3
2
18
Nov 2
@ LAL
L 131-125
20
1-6
16.7
0-2
0.0
2-2
100.0
3
1
0
3
3
1
4
Oct 31
vs ORL
L 121-114
23
7-10
70.0
1-2
50.0
0-0
0.0
5
1
0
0
4
1
15
Oct 29
vs ORL
W 129-99
15
3-5
60.0
2-3
66.7
2-2
100.0
2
1
0
0
5
3
10
Oct 26
@ MIN
L 117-94
19
1-3
33.3
0-1
0.0
1-2
50.0
7
2
1
0
3
2
3
Oct 24
@ WSH
W 112-102
18
3-6
50.0
0-0
0.0
2-2
100.0
3
0
0
3
5
1
8
Oct 22
vs CHI
W 135-92
20
2-7
28.6
0-1
0.0
2-2
100.0
8
3
1
1
2
0
6
06 / 2026-27 HOME / AWAY, RESULTS, MONTHS AND OPPONENTS
Splits
split
Split
GP
MIN
FG
FG%
3PT
3P%
FT
FT%
OR
DR
REB
AST
BLK
STL
PF
TO
PTS
All Splits
12
24.3
3.8-8.1
46.4
0.6-2.0
29.2
2.0-2.4
82.8
1.8
3.3
5.2
1.8
1.1
1.1
3.7
1.8
10.1
Home
5
23.6
3.0-7.4
40.5
0.8-2.6
30.8
1.6-2.0
80.0
2.2
4.2
6.4
2.0
0.8
0.4
4.0
2.0
8.4
Road
7
24.7
4.3-8.6
50.0
0.4-1.6
27.3
2.3-2.7
84.2
1.6
2.7
4.3
1.6
1.3
1.6
3.4
1.7
11.3
vs. Division
3
30.7
2.7-8.0
33.3
0.7-2.7
25.0
2.3-3.3
70.0
2.3
3.3
5.7
3.0
2.7
0.7
4.0
2.7
8.3
vs. Conference
8
25.1
3.8-8.0
46.9
0.6-2.0
31.3
2.3-2.6
85.7
1.9
3.4
5.3
2.0
1.3
1.3
4.0
2.0
10.4
3+ Days Rest
2
20.0
1.5-8.0
18.8
0.5-3.0
16.7
2.0-3.0
66.7
3.0
3.0
6.0
3.0
1.0
0.5
3.0
1.0
5.5
Month
Split
GP
MIN
FG
FG%
3PT
3P%
FT
FT%
OR
DR
REB
AST
BLK
STL
PF
TO
PTS
October
5
18.8
3.2-6.2
51.6
0.6-1.4
42.9
1.4-1.6
87.5
1.8
3.2
5.0
1.4
0.4
0.8
3.8
1.4
8.4
November
7
28.1
4.1-9.4
43.9
0.6-2.4
23.5
2.4-3.0
81.0
1.9
3.4
5.3
2.0
1.6
1.3
3.6
2.1
11.3
Pre All-Star
12
24.3
3.8-8.1
46.4
0.6-2.0
29.2
2.0-2.4
82.8
1.8
3.3
5.2
1.8
1.1
1.1
3.7
1.8
10.1
Result
Split
GP
MIN
FG
FG%
3PT
3P%
FT
FT%
OR
DR
REB
AST
BLK
STL
PF
TO
PTS
Wins
5
22.8
4.4-8.8
50.0
0.6-1.8
33.3
2.8-3.0
93.3
1.4
4.0
5.4
1.2
0.8
1.6
3.8
1.8
12.2
Losses
7
25.3
3.3-7.6
43.4
0.6-2.1
26.7
1.4-2.0
71.4
2.1
2.9
5.0
2.1
1.3
0.7
3.6
1.9
8.6
Position
Split
GP
MIN
FG
FG%
3PT
3P%
FT
FT%
OR
DR
REB
AST
BLK
STL
PF
TO
PTS
As Starter
6
29.5
4.7-10.0
46.7
0.7-2.5
26.7
2.5-3.2
78.9
2.0
3.7
5.7
2.2
1.8
1.0
3.7
2.3
12.5
Day
Split
GP
MIN
FG
FG%
3PT
3P%
FT
FT%
OR
DR
REB
AST
BLK
STL
PF
TO
PTS
Monday
1
28.0
7.0-14.0
50.0
1.0-3.0
33.3
3.0-4.0
75.0
0.0
7.0
7.0
0.0
2.0
0.0
3.0
2.0
18.0
Wednesday
4
19.3
3.0-7.8
38.7
1.0-2.8
36.4
1.5-2.0
75.0
2.0
2.3
4.3
2.3
0.5
0.3
3.5
1.5
8.5
Thursday
1
32.0
5.0-9.0
55.6
1.0-1.0
100.0
3.0-4.0
75.0
0.0
0.0
0.0
4.0
5.0
1.0
3.0
2.0
14.0
Friday
3
25.0
5.7-9.3
60.7
0.3-1.3
25.0
2.3-2.3
100.0
1.7
3.3
5.0
1.0
0.3
2.3
4.3
1.7
14.0
Sunday
3
26.3
1.3-5.0
26.7
0.0-1.7
0.0
1.7-2.0
83.3
3.0
4.7
7.7
1.7
1.0
1.3
3.7
2.3
4.3
Opponent
Split
GP
MIN
FG
FG%
3PT
3P%
FT
FT%
OR
DR
REB
AST
BLK
STL
PF
TO
PTS
Boston Celtics
1
20.0
1.0-9.0
11.1
1.0-5.0
20.0
2.0-4.0
50.0
3.0
1.0
4.0
3.0
1.0
0.0
4.0
2.0
5.0
Chicago Bulls
1
20.0
2.0-7.0
28.6
0.0-1.0
0.0
2.0-2.0
100.0
3.0
5.0
8.0
3.0
1.0
1.0
2.0
0.0
6.0
Denver Nuggets
1
23.0
6.0-10.0
60.0
1.0-2.0
50.0
0.0-0.0
0.0
2.0
1.0
3.0
2.0
0.0
0.0
3.0
1.0
13.0
Los Angeles Clippers
1
28.0
7.0-14.0
50.0
1.0-3.0
33.3
3.0-4.0
75.0
0.0
7.0
7.0
0.0
2.0
0.0
3.0
2.0
18.0
Los Angeles Lakers
1
20.0
1.0-6.0
16.7
0.0-2.0
0.0
2.0-2.0
100.0
1.0
2.0
3.0
1.0
0.0
3.0
3.0
1.0
4.0
Milwaukee Bucks
1
34.0
7.0-12.0
58.3
0.0-2.0
0.0
5.0-5.0
100.0
3.0
4.0
7.0
2.0
1.0
4.0
4.0
3.0
19.0
Minnesota Timberwolves
1
19.0
1.0-3.0
33.3
0.0-1.0
0.0
1.0-2.0
50.0
4.0
3.0
7.0
2.0
1.0
0.0
3.0
2.0
3.0
New York Knicks
1
40.0
2.0-6.0
33.3
0.0-2.0
0.0
2.0-2.0
100.0
4.0
9.0
13.0
2.0
2.0
1.0
5.0
4.0
6.0
Orlando Magic
2
19.0
5.0-7.5
66.7
1.5-2.5
60.0
1.0-1.0
100.0
0.5
3.0
3.5
1.0
0.0
0.0
4.5
2.0
12.5
Philadelphia 76ers
1
32.0
5.0-9.0
55.6
1.0-1.0
100.0
3.0-4.0
75.0
0.0
0.0
0.0
4.0
5.0
1.0
3.0
2.0
14.0
Washington Wizards
1
18.0
3.0-6.0
50.0
0.0-0.0
0.0
2.0-2.0
100.0
1.0
2.0
3.0
0.0
0.0
3.0
5.0
1.0
8.0
07 / SEASON-BY-SEASON HISTORY
Career statistics
Regular Season Averages
Season
Team
GP
GS
MIN
FG
FG%
3PT
3P%
FT
FT%
OR
DR
REB
AST
BLK
STL
PF
TO
PTS
2025-26
Toronto Raptors
57
22
21.9
3.5-6.0
57.9
0.3-0.9
34.0
1.2-1.9
65.7
2.3
2.7
5.0
1.9
0.9
0.9
2.6
1.0
8.5
2026-27
Toronto Raptors
12
6
24.3
3.8-8.1
46.4
0.6-2.0
29.2
2.0-2.4
82.8
1.8
3.3
5.2
1.8
1.1
1.1
3.7
1.8
10.1
Career
—
69
28
22.3
3.5-6.4
55.4
0.3-1.1
32.4
1.4-2.0
69.3
2.2
2.8
5.0
1.8
1.0
0.9
2.8
1.2
8.8
Regular Season Totals
Season
Team
FG
FG%
3PT
3P%
FT
FT%
OR
DR
REB
AST
BLK
STL
PF
TO
PTS
2025-26
Toronto Raptors
198-342
57.9
17-50
34.0
71-108
65.7
133
152
285
106
53
52
147
59
484
2026-27
Toronto Raptors
45-97
46.4
7-24
29.2
24-29
82.8
22
40
62
21
13
13
44
22
121
Career
—
243-439
55.4
24-74
32.4
95-137
69.3
155
192
347
127
66
65
191
81
605
Regular Season Misc Totals
Season
Team
DD2
TD3
DQ
EJECT
TECH
FLAG
AST/TO
STL/TO
SC-EFF
SH-EFF
2025-26
Toronto Raptors
4
0
0
0
0
0
1.8
0.9
1.415
0.60
2026-27
Toronto Raptors
0
0
0
0
0
0
1.0
0.6
1.247
0.50
Career
—
4
0
0
0
0
0
1.6
0.8
1.378
0.58
Scoring, rebounding and assist trend
08 / SHOT CHART AND ZONE SHOOTING
Shot profile
Shot-location data is not connected. Add a BALLDONTLIE GOAT-tier NBA API key in NBA Players → Settings to enable shot charts and zone shooting.
LATEST UPDATEMurray-Boyles ended with 14 points (5-9 FG, 1-1 3Pt, 3-4 FT), four assists, five blocks and one steal over 32 minutes during Thursday's 123-112 loss to the 76ers.
Murray-Boyles made up for a rough showing in Wednesday's 98-93 loss to the Celtics with a career-high-tying five blocks. However, he did fail to record a rebound despite playing 30-plus minutes, making it the second-year Raptors' first such outing this season. Murray-Boyles could continue providing solid fantasy contributions across several categories, especially if his minutes keep climbing with Scottie Barnes (groin) and Kawhi Leonard (knee) sidelined.


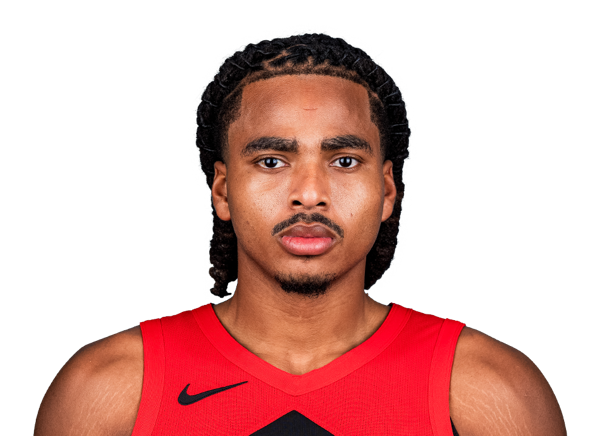

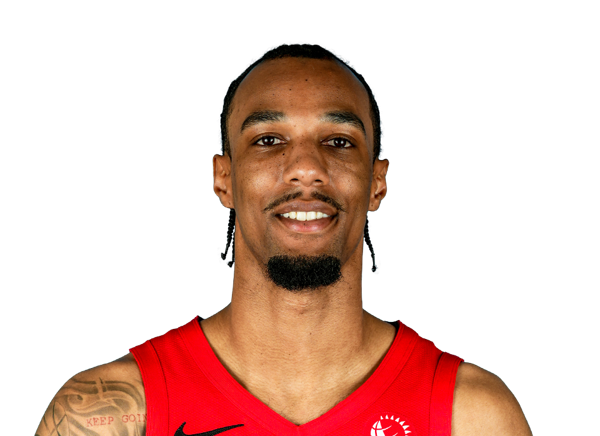 A.J. LawsonG
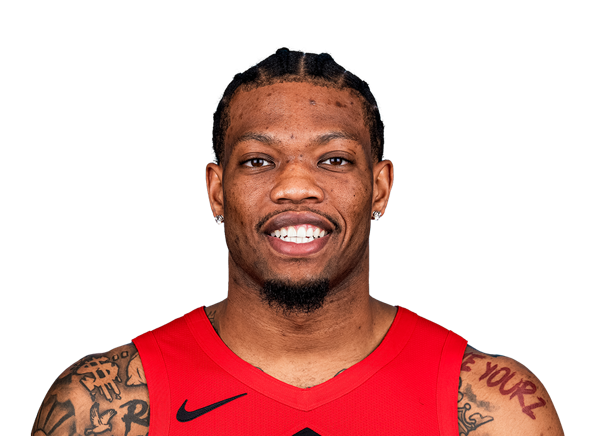 Alijah MartinG #55
 Allen GravesF #22
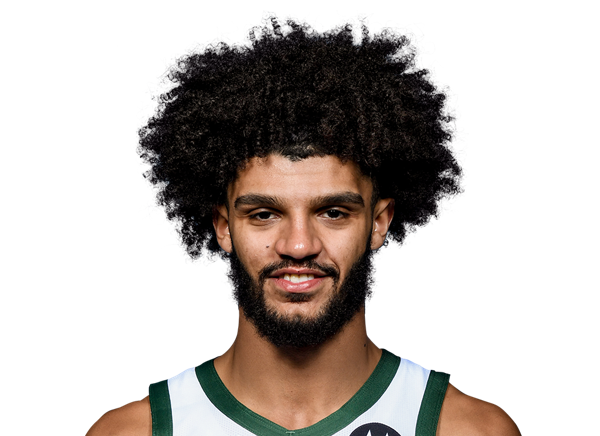 Andre Jackson Jr.G #44
 Chucky HepburnG #24
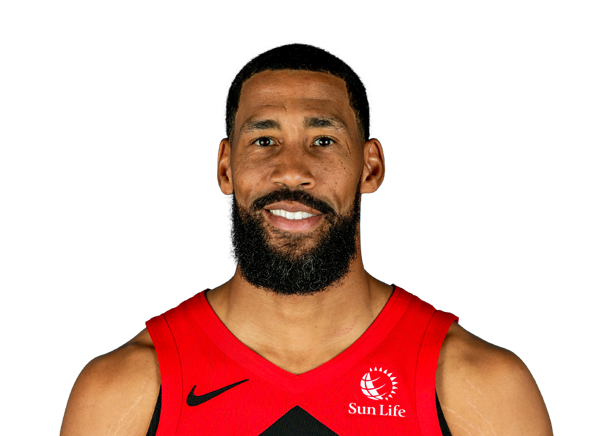 Garrett TempleG #17
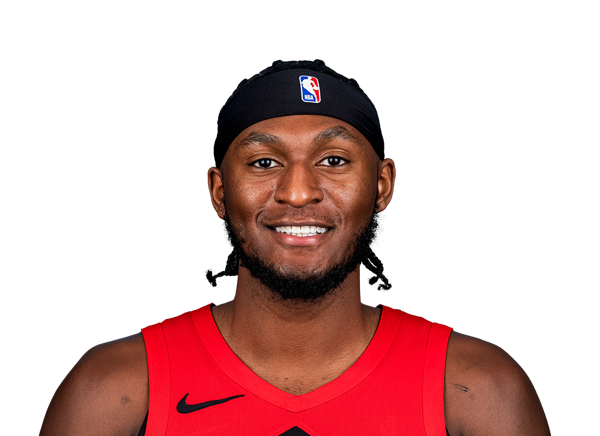 Immanuel QuickleyG #5
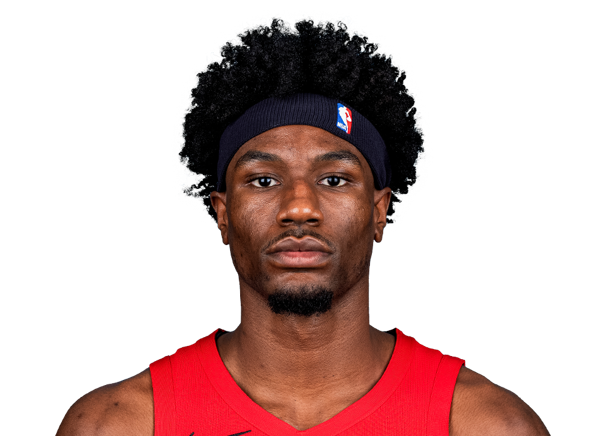 Ja’Kobe WalterG #14
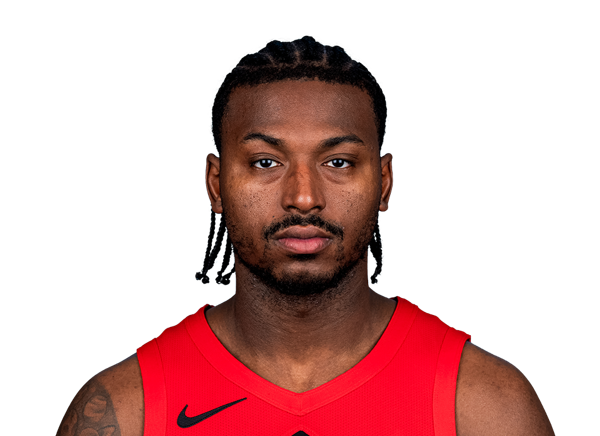 Jaden BradleyG #8
 Jakob PoeltlC #19
 Jamal SheadG #23
 Jamarion SharpC
 Jamison BattleF #77
 Kawhi LeonardF #2
 Kevin McCullar Jr.G #9
 Kyle AndersonF #12
 Malachi SmithG #18
 Nate BittleC #12
 Nimari BurnettG #25
 RJ BarrettF #9
 Scottie BarnesF #4
 Trayce Jackson-DavisF #32
 Trey Jemison IIIC #50
 Tyreke KeyG #11
 Tyson DegenhartF #20