

BALLERSCULTURE PLAYER PROFILE · 2026-27
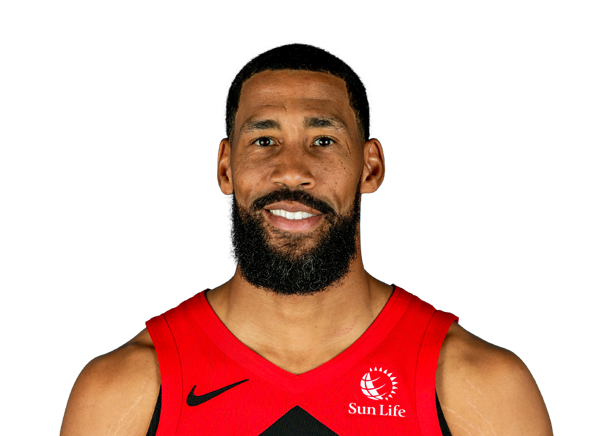
Garrett Temple
Toronto Raptors · G • #17 • 6' 5" 195 lbs

01 / 2026-27 PER-GAME AVERAGES
Season snapshot
No regular-season 2026-27 statistics are recorded for this player. Career history is shown further down.
02 / EVERY SEASON SINCE 2022-23, SIDE BY SIDE
2022-23 to 2026-27
Per game
| Season | Team | GP | GS | MIN | PTS | REB | AST | STL | BLK | TO | FG% | 3P% | FT% |
|---|---|---|---|---|---|---|---|---|---|---|---|---|---|
| 2022-23 | New Orleans Pelicans | 25 | 0 | 6.5 | 2.0 | 0.7 | 0.5 | 0.4 | 0.1 | 0.2 | 40.0 | 42.3 | 75.0 |
| 2023-24 | Toronto Raptors | 27 | 2 | 10.7 | 3.3 | 1.7 | 1.0 | 0.4 | 0.1 | 0.5 | 37.2 | 30.0 | 81.8 |
| 2024-25 | Toronto Raptors | 28 | 0 | 8.1 | 1.9 | 1.0 | 1.1 | 0.6 | 0.1 | 0.4 | 30.0 | 21.4 | 91.7 |
| 2025-26 | Toronto Raptors | 22 | 0 | 3.3 | 0.8 | 0.4 | 0.4 | 0.2 | 0.1 | 0.3 | 26.7 | 25.0 | 66.7 |
| 2026-27 | — | — | — | — | — | — | — | — | — | — | — | — | — |
Season totals
| Season | Team | GP | GS | MIN | PTS | REB | AST | STL | BLK | TO | FG% | 3P% | FT% |
|---|---|---|---|---|---|---|---|---|---|---|---|---|---|
| 2022-23 | New Orleans Pelicans | — | — | — | 50 | 17 | 13 | 9 | 2 | 4 | 40.0 | 42.3 | 75.0 |
| 2023-24 | Toronto Raptors | — | — | — | 88 | 45 | 28 | 12 | 3 | 14 | 37.2 | 30.0 | 81.8 |
| 2024-25 | Toronto Raptors | — | — | — | 53 | 29 | 31 | 17 | 2 | 10 | 30.0 | 21.4 | 91.7 |
| 2025-26 | Toronto Raptors | — | — | — | 17 | 9 | 9 | 4 | 2 | 7 | 26.7 | 25.0 | 66.7 |
| 2026-27 | — | — | — | — | — | — | — | — | — | — | — | — | — |
Click a season to open this player’s full game log, splits and advanced stats for that year; click a team to open its page. A dash means no NBA games were recorded.
03 / SEASON-BY-SEASON HISTORY
Career statistics
Regular Season Averages
| Season | Team | GP | GS | MIN | FG | FG% | 3PT | 3P% | FT | FT% | OR | DR | REB | AST | BLK | STL | PF | TO | PTS |
|---|---|---|---|---|---|---|---|---|---|---|---|---|---|---|---|---|---|---|---|
| 2009-10 | Houston Rockets | 9 | 0 | 13.1 | 1.4-3.2 | 44.8 | 0.3-1.3 | 25.0 | 1.8-2.7 | 66.7 | 0.2 | 1.3 | 1.6 | 0.8 | 0.4 | 0.4 | 1.8 | 1.6 | 5.0 |
| 2009-10 | Sacramento Kings | 5 | 0 | 4.6 | 0.6-1.6 | 37.5 | 0.0-0.4 | 0.0 | 1.0-1.0 | 100.0 | 0.2 | 0.4 | 0.6 | 0.4 | 0.0 | 0.2 | 0.2 | 0.4 | 2.2 |
| 2009-10 | San Antonio Spurs | 13 | 4 | 14.8 | 2.2-4.9 | 43.8 | 0.8-1.8 | 43.5 | 1.1-1.6 | 66.7 | 0.2 | 0.8 | 1.1 | 0.9 | 0.2 | 0.6 | 1.9 | 0.8 | 6.2 |
| 2009-10 | 2009 10 Totals | 27 | 4 | 12.4 | 1.6-3.7 | 43.6 | 0.5-1.4 | 35.1 | 1.3-1.9 | 70.0 | 0.2 | 0.9 | 1.1 | 0.8 | 0.2 | 0.5 | 1.6 | 1.0 | 5.0 |
| 2010-11 | San Antonio Spurs | 3 | 0 | 7.0 | 0.3-1.7 | 20.0 | 0.0-0.3 | 0.0 | 0.0-0.7 | 0.0 | 0.3 | 0.3 | 0.7 | 0.7 | 0.3 | 0.3 | 0.7 | 0.3 | 0.7 |
| 2010-11 | Milwaukee Bucks | 9 | 0 | 9.2 | 0.8-2.3 | 33.3 | 0.3-1.1 | 30.0 | 0.0-0.4 | 0.0 | 0.0 | 0.7 | 0.7 | 0.7 | 0.1 | 0.1 | 0.9 | 0.2 | 1.9 |
| 2010-11 | Charlotte Bobcats | 12 | 0 | 10.5 | 1.0-3.5 | 28.6 | 0.6-2.2 | 26.9 | 0.6-0.9 | 63.6 | 0.0 | 1.3 | 1.3 | 2.0 | 0.3 | 0.8 | 1.2 | 1.7 | 3.2 |
| 2010-11 | 2010 11 Totals | 24 | 0 | 9.6 | 0.8-2.8 | 29.4 | 0.4-1.5 | 27.0 | 0.3-0.7 | 41.2 | 0.0 | 0.9 | 1.0 | 1.3 | 0.3 | 0.5 | 1.0 | 1.0 | 2.4 |
| 2012-13 | Washington Wizards | 51 | 36 | 22.7 | 2.1-5.1 | 40.7 | 0.5-1.6 | 32.5 | 0.5-0.7 | 70.3 | 0.6 | 1.8 | 2.4 | 2.3 | 0.3 | 1.0 | 1.8 | 1.2 | 5.1 |
| 2013-14 | Washington Wizards | 75 | 0 | 8.5 | 0.7-1.9 | 36.2 | 0.1-0.4 | 20.7 | 0.4-0.6 | 69.8 | 0.3 | 0.6 | 0.9 | 1.0 | 0.1 | 0.5 | 1.0 | 0.6 | 1.8 |
| 2014-15 | Washington Wizards | 52 | 18 | 14.2 | 1.3-3.3 | 40.0 | 0.6-1.7 | 37.5 | 0.7-0.9 | 72.9 | 0.5 | 1.3 | 1.7 | 1.1 | 0.2 | 0.8 | 1.5 | 0.7 | 3.9 |
| 2015-16 | Washington Wizards | 80 | 43 | 24.4 | 2.5-6.3 | 39.8 | 1.1-3.2 | 34.5 | 1.1-1.6 | 72.8 | 0.5 | 2.2 | 2.7 | 1.8 | 0.2 | 0.9 | 2.4 | 0.8 | 7.3 |
| 2016-17 | Sacramento Kings | 65 | 20 | 26.6 | 2.8-6.6 | 42.4 | 1.3-3.4 | 37.3 | 0.9-1.1 | 78.4 | 0.5 | 2.3 | 2.8 | 2.6 | 0.4 | 1.3 | 2.2 | 1.2 | 7.8 |
| 2017-18 | Sacramento Kings | 65 | 35 | 24.8 | 3.1-7.3 | 41.8 | 1.4-3.5 | 39.2 | 0.9-1.2 | 76.9 | 0.3 | 2.0 | 2.3 | 1.9 | 0.4 | 0.9 | 2.1 | 1.2 | 8.4 |
| 2018-19 | Memphis Grizzlies | 49 | 49 | 31.2 | 3.4-7.9 | 42.9 | 1.5-4.3 | 35.2 | 1.2-1.6 | 75.0 | 0.4 | 2.7 | 3.1 | 1.4 | 0.5 | 1.0 | 2.7 | 1.1 | 9.4 |
| 2018-19 | La Clippers | 26 | 6 | 19.6 | 1.6-4.1 | 39.6 | 0.6-2.1 | 29.6 | 0.9-1.2 | 74.2 | 0.4 | 2.1 | 2.5 | 1.4 | 0.2 | 1.0 | 2.7 | 0.6 | 4.7 |
| 2018-19 | 2018 19 Totals | 75 | 55 | 27.2 | 2.8-6.6 | 42.2 | 1.2-3.5 | 34.1 | 1.1-1.4 | 74.8 | 0.4 | 2.5 | 2.9 | 1.4 | 0.4 | 1.0 | 2.7 | 0.9 | 7.8 |
| 2019-20 | Brooklyn Nets | 62 | 35 | 27.9 | 3.6-9.5 | 37.8 | 2.0-6.2 | 32.9 | 1.1-1.4 | 80.5 | 0.5 | 3.0 | 3.5 | 2.5 | 0.5 | 0.8 | 1.7 | 1.0 | 10.3 |
| 2020-21 | Chicago Bulls | 56 | 25 | 27.3 | 2.8-6.8 | 41.5 | 1.2-3.6 | 33.5 | 0.7-0.9 | 80.0 | 0.5 | 2.3 | 2.9 | 2.2 | 0.5 | 0.8 | 2.3 | 1.0 | 7.6 |
| 2021-22 | New Orleans Pelicans | 59 | 16 | 18.6 | 1.9-5.0 | 37.6 | 1.0-3.1 | 31.9 | 0.5-0.7 | 68.3 | 0.5 | 1.9 | 2.4 | 1.3 | 0.4 | 0.7 | 1.4 | 0.7 | 5.2 |
| 2022-23 | New Orleans Pelicans | 25 | 0 | 6.5 | 0.7-1.8 | 40.0 | 0.4-1.0 | 42.3 | 0.1-0.2 | 75.0 | 0.2 | 0.5 | 0.7 | 0.5 | 0.1 | 0.4 | 0.6 | 0.2 | 2.0 |
| 2023-24 | Toronto Raptors | 27 | 2 | 10.7 | 1.1-2.9 | 37.2 | 0.4-1.5 | 30.0 | 0.7-0.8 | 81.8 | 0.7 | 1.0 | 1.7 | 1.0 | 0.1 | 0.4 | 1.0 | 0.5 | 3.3 |
| 2024-25 | Toronto Raptors | 28 | 0 | 8.1 | 0.6-2.1 | 30.0 | 0.2-1.0 | 21.4 | 0.4-0.4 | 91.7 | 0.3 | 0.7 | 1.0 | 1.1 | 0.1 | 0.6 | 0.8 | 0.4 | 1.9 |
| 2025-26 | Toronto Raptors | 22 | 0 | 3.3 | 0.2-0.7 | 26.7 | 0.1-0.5 | 25.0 | 0.3-0.4 | 66.7 | 0.0 | 0.4 | 0.4 | 0.4 | 0.1 | 0.2 | 0.3 | 0.3 | 0.8 |
| Career | — | 793 | 289 | 19.6 | 2.1-5.2 | 39.9 | 0.9-2.7 | 34.2 | 0.8-1.0 | 74.4 | 0.4 | 1.8 | 2.2 | 1.6 | 0.3 | 0.8 | 1.7 | 0.9 | 5.8 |
Regular Season Totals
| Season | Team | FG | FG% | 3PT | 3P% | FT | FT% | OR | DR | REB | AST | BLK | STL | PF | TO | PTS |
|---|---|---|---|---|---|---|---|---|---|---|---|---|---|---|---|---|
| 2009-10 | Houston Rockets | 13-29 | 44.8 | 3-12 | 25.0 | 16-24 | 66.7 | 2 | 12 | 14 | 7 | 4 | 4 | 16 | 14 | 45 |
| 2009-10 | Sacramento Kings | 3-8 | 37.5 | 0-2 | 0.0 | 5-5 | 100.0 | 1 | 2 | 3 | 2 | 0 | 1 | 1 | 2 | 11 |
| 2009-10 | San Antonio Spurs | 28-64 | 43.8 | 10-23 | 43.5 | 14-21 | 66.7 | 3 | 11 | 14 | 12 | 2 | 8 | 25 | 11 | 80 |
| 2009-10 | 2009 10 Totals | 44-101 | 43.6 | 13-37 | 35.1 | 35-50 | 70.0 | 6 | 25 | 31 | 21 | 6 | 13 | 42 | 27 | 136 |
| 2010-11 | San Antonio Spurs | 1-5 | 20.0 | 0-1 | 0.0 | 0-2 | 0.0 | 1 | 1 | 2 | 2 | 1 | 1 | 2 | 1 | 2 |
| 2010-11 | Milwaukee Bucks | 7-21 | 33.3 | 3-10 | 30.0 | 0-4 | 0.0 | 0 | 6 | 6 | 6 | 1 | 1 | 8 | 2 | 17 |
| 2010-11 | Charlotte Bobcats | 12-42 | 28.6 | 7-26 | 26.9 | 7-11 | 63.6 | 0 | 15 | 15 | 24 | 4 | 9 | 14 | 20 | 38 |
| 2010-11 | 2010 11 Totals | 20-68 | 29.4 | 10-37 | 27.0 | 7-17 | 41.2 | 1 | 22 | 23 | 32 | 6 | 11 | 24 | 23 | 57 |
| 2012-13 | Washington Wizards | 105-258 | 40.7 | 26-80 | 32.5 | 26-37 | 70.3 | 29 | 94 | 123 | 115 | 17 | 50 | 94 | 61 | 262 |
| 2013-14 | Washington Wizards | 51-141 | 36.2 | 6-29 | 20.7 | 30-43 | 69.8 | 21 | 47 | 68 | 72 | 11 | 35 | 72 | 42 | 138 |
| 2014-15 | Washington Wizards | 68-170 | 40.0 | 33-88 | 37.5 | 35-48 | 72.9 | 24 | 66 | 90 | 56 | 9 | 42 | 76 | 34 | 204 |
| 2015-16 | Washington Wizards | 201-505 | 39.8 | 89-258 | 34.5 | 91-125 | 72.8 | 36 | 176 | 212 | 140 | 18 | 69 | 195 | 64 | 582 |
| 2016-17 | Sacramento Kings | 183-432 | 42.4 | 82-220 | 37.3 | 58-74 | 78.4 | 32 | 152 | 184 | 168 | 28 | 84 | 141 | 78 | 506 |
| 2017-18 | Sacramento Kings | 199-476 | 41.8 | 89-227 | 39.2 | 60-78 | 76.9 | 22 | 130 | 152 | 124 | 27 | 57 | 135 | 79 | 547 |
| 2018-19 | Memphis Grizzlies | 166-387 | 42.9 | 74-210 | 35.2 | 57-76 | 75.0 | 18 | 134 | 152 | 69 | 25 | 50 | 134 | 54 | 463 |
| 2018-19 | La Clippers | 42-106 | 39.6 | 16-54 | 29.6 | 23-31 | 74.2 | 10 | 54 | 64 | 37 | 5 | 26 | 70 | 16 | 123 |
| 2018-19 | 2018 19 Totals | 208-493 | 42.2 | 90-264 | 34.1 | 80-107 | 74.8 | 28 | 188 | 216 | 106 | 30 | 76 | 204 | 70 | 586 |
| 2019-20 | Brooklyn Nets | 222-587 | 37.8 | 127-386 | 32.9 | 70-87 | 80.5 | 29 | 189 | 218 | 156 | 29 | 49 | 108 | 62 | 641 |
| 2020-21 | Chicago Bulls | 158-381 | 41.5 | 67-200 | 33.5 | 40-50 | 80.0 | 29 | 131 | 160 | 124 | 30 | 43 | 126 | 58 | 423 |
| 2021-22 | New Orleans Pelicans | 111-295 | 37.6 | 59-185 | 31.9 | 28-41 | 68.3 | 29 | 114 | 143 | 74 | 23 | 43 | 81 | 42 | 309 |
| 2022-23 | New Orleans Pelicans | 18-45 | 40.0 | 11-26 | 42.3 | 3-4 | 75.0 | 5 | 12 | 17 | 13 | 2 | 9 | 15 | 4 | 50 |
| 2023-24 | Toronto Raptors | 29-78 | 37.2 | 12-40 | 30.0 | 18-22 | 81.8 | 18 | 27 | 45 | 28 | 3 | 12 | 28 | 14 | 88 |
| 2024-25 | Toronto Raptors | 18-60 | 30.0 | 6-28 | 21.4 | 11-12 | 91.7 | 9 | 20 | 29 | 31 | 2 | 17 | 23 | 10 | 53 |
| 2025-26 | Toronto Raptors | 4-15 | 26.7 | 3-12 | 25.0 | 6-9 | 66.7 | 1 | 8 | 9 | 9 | 2 | 4 | 6 | 7 | 17 |
| Career | — | 1639-4105 | 39.9 | 723-2117 | 34.2 | 598-804 | 74.4 | 319 | 1401 | 1720 | 1269 | 243 | 614 | 1370 | 675 | 4599 |
Regular Season Misc Totals
| Season | Team | DD2 | TD3 | DQ | EJECT | TECH | FLAG | AST/TO | STL/TO | SC-EFF | SH-EFF |
|---|---|---|---|---|---|---|---|---|---|---|---|
| 2009-10 | Houston Rockets | 0 | 0 | 0 | 0 | 0 | 0 | 0.5 | 0.3 | 1.552 | 0.50 |
| 2009-10 | Sacramento Kings | 0 | 0 | 0 | 0 | 0 | 0 | 1.0 | 0.5 | 1.375 | 0.38 |
| 2009-10 | San Antonio Spurs | 0 | 0 | 1 | 0 | 0 | 0 | 1.1 | 0.7 | 1.250 | 0.52 |
| 2009-10 | 2009 10 Totals | 0 | 0 | 1 | 0 | 0 | 0 | 0.8 | 0.5 | 1.347 | 0.50 |
| 2010-11 | San Antonio Spurs | 0 | 0 | 0 | 0 | 0 | 0 | 2.0 | 1.0 | 0.400 | 0.20 |
| 2010-11 | Milwaukee Bucks | 0 | 0 | 0 | 0 | 0 | 0 | 3.0 | 0.5 | 0.810 | 0.40 |
| 2010-11 | Charlotte Bobcats | 0 | 0 | 0 | 0 | 0 | 0 | 1.2 | 0.5 | 0.905 | 0.37 |
| 2010-11 | 2010 11 Totals | 0 | 0 | 0 | 0 | 0 | 0 | 1.4 | 0.5 | 0.838 | 0.37 |
| 2012-13 | Washington Wizards | 0 | 0 | 1 | 0 | 0 | 0 | 1.9 | 0.8 | 1.016 | 0.46 |
| 2013-14 | Washington Wizards | 0 | 0 | 0 | 0 | 0 | 0 | 1.7 | 0.8 | 0.979 | 0.38 |
| 2014-15 | Washington Wizards | 0 | 0 | 0 | 0 | 0 | 0 | 1.6 | 1.2 | 1.200 | 0.50 |
| 2015-16 | Washington Wizards | 0 | 0 | 3 | 0 | 0 | 0 | 2.2 | 1.1 | 1.152 | 0.49 |
| 2016-17 | Sacramento Kings | 0 | 0 | 0 | 0 | 0 | 0 | 2.2 | 1.1 | 1.171 | 0.52 |
| 2017-18 | Sacramento Kings | 0 | 0 | 0 | 0 | 0 | 0 | 1.6 | 0.7 | 1.149 | 0.51 |
| 2018-19 | Memphis Grizzlies | 0 | 0 | 1 | 0 | 1 | 0 | 1.3 | 0.9 | 1.196 | 0.52 |
| 2018-19 | La Clippers | 0 | 0 | 0 | 0 | 0 | 0 | 2.3 | 1.6 | 1.160 | 0.47 |
| 2018-19 | 2018 19 Totals | 0 | 0 | 1 | 0 | 1 | 0 | 1.5 | 1.1 | 1.189 | 0.51 |
| 2019-20 | Brooklyn Nets | 2 | 0 | 0 | 0 | 0 | 0 | 2.5 | 0.8 | 1.092 | 0.49 |
| 2020-21 | Chicago Bulls | 0 | 0 | 1 | 0 | 1 | 0 | 2.1 | 0.7 | 1.110 | 0.50 |
| 2021-22 | New Orleans Pelicans | 0 | 0 | 0 | 0 | 0 | 0 | 1.8 | 1.0 | 1.047 | 0.48 |
| 2022-23 | New Orleans Pelicans | 0 | 0 | 0 | 0 | 0 | 0 | 3.3 | 2.3 | 1.111 | 0.52 |
| 2023-24 | Toronto Raptors | 0 | 0 | 0 | 0 | 1 | 0 | 2.0 | 0.9 | 1.128 | 0.45 |
| 2024-25 | Toronto Raptors | 0 | 0 | 0 | 0 | 0 | 0 | 3.1 | 1.7 | 0.883 | 0.35 |
| 2025-26 | Toronto Raptors | 0 | 0 | 0 | 0 | 0 | 0 | 1.3 | 0.6 | 1.133 | 0.37 |
| Career | — | 2 | 0 | 7 | 0 | 3 | 0 | 1.9 | 0.9 | 1.120 | 0.49 |
Scoring, rebounding and assist trend
04 / SHOT CHART AND ZONE SHOOTING
Shot profile
Shot-location data is not connected. Add a BALLDONTLIE GOAT-tier NBA API key in NBA Players → Settings to enable shot charts and zone shooting.
05 / RECORD, TEAM STATS AND TEAMMATES
Team
Overall5-8
Home2-4
Road3-4
DIV0-3
CONF4-4
Last Ten Games3-7
Team records for 2026-27 (regular season).
Team statistics 2026-27
Defensive
| Metric | Total | Per game | NBA rank |
|---|---|---|---|
| Blocks | 57 | 4.385 | Tied-3rd |
| Defensive Rebounds | 363 | 27.923 | 5th |
| Steals | 133 | 10.231 | 1st |
| Points Conceded Off Turnovers | 0 | 20 | — |
| Defensive Rebound Rate | 0.0 | — | — |
| Defensive Rebounds Per Game | 27.9 | — | — |
| Blocks Per Game | 4.4 | — | — |
| Steals Per Game | 10.2 | — | — |
| Defensive Rebounds Per 48 | 0.0 | — | — |
| Blocks Per 48 | 0.0 | — | — |
| Steals Per 48 | 0.0 | — | — |
General
| Metric | Total | Per game | NBA rank |
|---|---|---|---|
| Disqualifications | 1 | — | Tied-2nd |
| Flagrant Fouls | 1 | 0.077 | Tied-3rd |
| Fouls | 333 | 25.615 | 1st |
| Rebound Rate | 52.3 | — | 3rd |
| Ejections | 0 | — | — |
| Technical Fouls | 6 | 0.231 | 5th |
| Rebounds | 545 | 41.923 | — |
| Minutes | 0 | — | — |
| Minutes Per Game | 0.0 | — | — |
| Fantasy Rating | 0.0 | — | — |
| Rating | 207.9 | — | — |
| Plus-Minus | -1 | -1 | Tied-1st |
| Game Day of Year | 0 | — | — |
| Rebounds Per Game | 41.9 | — | — |
| Fouls Per Game | 25.6 | — | — |
| Flagrant Fouls Per Game | 0.1 | — | — |
| Technical Fouls Per Game | 0.5 | — | — |
| Ejections Per Game | 0.0 | — | — |
| Disqualifications Per Game | 0.1 | — | — |
| Assist To Turnover Ratio | 2.0 | 2.022 | — |
| Steal To Foul Ratio | 0.4 | 0.399 | — |
| Block To Foul Ratio | 0.2 | 0.171 | — |
| Team Rebounds Per Game | 0.0 | — | — |
| Rebounds | 545 | 41.923 | — |
| Total Technical Fouls | 6 | 0.231 | — |
| Assist To Turnover Ratio | 45.5 | — | — |
| Team Rebounds | 0 | — | — |
| Steal To Turnover Ratio | 0.7 | 0.739 | — |
| Rebounds Per 48 Minutes | 0.0 | — | — |
| Fouls Per 48 Minutes | 0.0 | — | — |
| Flagrant Fouls Per 48 Minutes | 0.0 | — | — |
| Technical Fouls Per 48 Minutes | 0.0 | — | — |
| Ejections Per 48 Minutes | 0.0 | — | — |
| Disqualifications Per 48 Minutes | 0.0 | — | — |
| Games Played | 13 | — | Tied-2nd |
| Games Started | 0 | — | — |
| Double Double | 0 | — | — |
| Triple Double | 0 | — | — |
Offensive
| Metric | Total | Per game | NBA rank |
|---|---|---|---|
| Assists | 364 | 28 | 2nd |
| Effective Field Goal Percentage | 51.7 | — | 5th |
| Field Goals | 540/1192 | 0.453 | — |
| Field Goals Attempted | 1192 | 91.692 | 2nd |
| Field Goals Made | 540 | 41.538 | 2nd |
| Field Goal Percentage | 45.3 | 0.453 | 3rd |
| Free Throws | 246/338 | 0.728 | — |
| Free Throw Percentage | 72.8 | 0.728 | 5th |
| Free Throws Attempted | 338 | 26 | 3rd |
| Free Throws Made | 246 | 18.923 | 3rd |
| Offensive Rebounds | 182 | 14 | 1st |
| Points | 1479 | 113.769 | 3rd |
| Turnovers | 180 | 13.846 | 3rd |
| 3-Point Field Goal Percentage | 32.8 | 0.328 | 5th |
| 3-Point Field Goals Attempted | 467 | 35.923 | 5th |
| 3-Point Field Goals Made | 153 | 11.769 | 5th |
| True Shooting Percentage | 55.2 | — | 5th |
| Team Turnovers | 8 | — | Tied-4th |
| Total Turnovers | 188 | 13.846 | — |
| Assist Ratio | 19.2 | — | 2nd |
| Points in the Paint | 646 | 49 | 1st |
| Offensive Rebound Rate | 32.9 | — | 1st |
| Turnover Ratio | 12.3 | — | 4th |
| Fast Break Points | 211 | — | — |
| Possessions | 1347 | — | 2nd |
| Pace Factor | 97.9 | — | 3rd |
| Average Field Goals Made | 41.5 | — | — |
| Average Field Goals Attempted | 91.7 | — | — |
| Average 3-Point Field Goals Made | 11.8 | — | — |
| Average 3-Point Field Goals Attempted | 35.9 | — | — |
| Average Free Throws Made | 18.9 | — | — |
| Average Free Throws Attempted | 26.0 | — | — |
| Points Per Game | 113.8 | — | — |
| Offensive Rebounds Per Game | 14.0 | — | — |
| Assists Per Game | 28.0 | — | — |
| Turnovers Per Game | 13.8 | — | — |
| Offensive Rebound Percentage | 0.3 | 0.279 | — |
| Estimated Possessions | 1333.2 | 101.938 | — |
| Estimated Possessions Per Game | 102.6 | — | — |
| Points Per Estimated Possession | 1.1 | 1.116 | — |
| Team Turnovers Per Game | 0.6 | — | — |
| Total Turnovers Per Game | 14.5 | — | — |
| 3-Point Field Goal Percentage | 32.8 | 0.328 | 1st |
| 2-Point Field Goals Made | 387.0 | 29.769 | Tied-3rd |
| 2-Point Field Goals Attempted | 725.0 | 55.769 | Tied-3rd |
| 2-Point Field Goals Made per Game | 29.8 | — | — |
| 2-Point Field Goals Attempted per Game | 55.8 | — | — |
| 2-Point Field Goal Percentage | 53.4 | 0.534 | — |
| Shooting Efficiency | 0.52 | 0.517 | — |
| Scoring Efficiency | 1.241 | 1.241 | — |
| Fieldgoals Made Per 48 | 0.0 | — | — |
| Fieldgoals Attempted Per 48 | 0.0 | — | — |
| 3-Point Fieldgoals Made Per 48 | 0.0 | — | — |
| 3-Point Fieldgoals Attempted Per 48 | 0.0 | — | — |
| Freethrows Made Per 48 | 0.0 | — | — |
| Freethrows Attempted Per 48 | 0.0 | — | — |
| Points Scored Per 48 | 0.0 | — | — |
| Offensive Rebounds Per 48 | 0.0 | — | — |
| Assists Per 48 | 0.0 | — | — |
| Turnovers | 0.0 | — | — |
Teammates
 A.J. LawsonG
 Alijah MartinG #55
 Allen GravesF #22
 Andre Jackson Jr.G #44
 Chucky HepburnG #24
 Collin Murray-BoylesF #30
 Immanuel QuickleyG #5
 Ja’Kobe WalterG #14
 Jaden BradleyG #8
 Jakob PoeltlC #19
 Jamal SheadG #23
 Jamarion SharpC
 Jamison BattleF #77
 Kawhi LeonardF #2
 Kevin McCullar Jr.G #9
 Kyle AndersonF #12
 Malachi SmithG #18
 Nate BittleC #12
 Nimari BurnettG #25
 RJ BarrettF #9
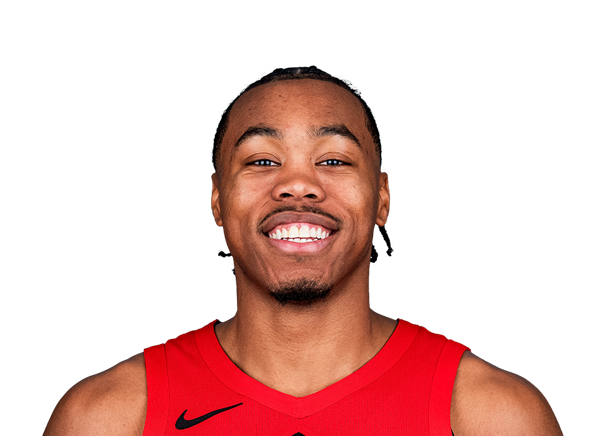 Scottie BarnesF #4
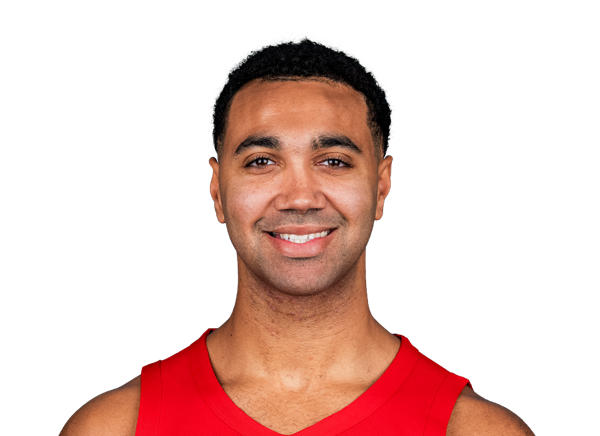 Trayce Jackson-DavisF #32
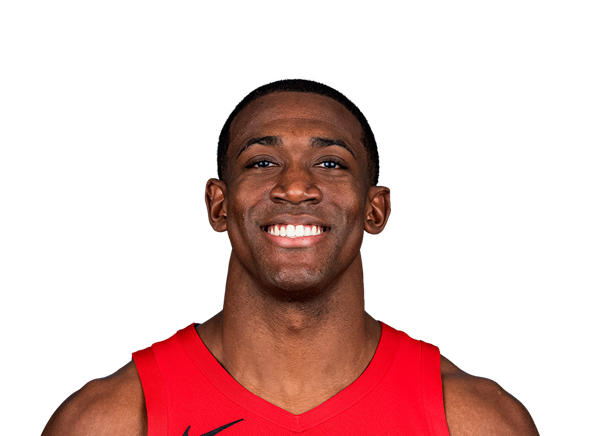 Trey Jemison IIIC #50
 Tyreke KeyG #11
 Tyson DegenhartF #20
06 / SALARY BY SEASON
Contract
| Season | Salary |
|---|---|
| 2014-15 | $981,084 |
| 2015-16 | $1.1M |
| 2016-17 | $8M |
| 2017-18 | $8M |
| 2018-19 | $8M |
| 2019-20 | $4.77M |
| 2020-21 | $4.77M |
| 2021-22 | $4.91M |
| 2022-23 | $4.91M |
| 2023-24 | $5.4M |
| 2024-25 | $2.09M |
| 2025-26 | $2.3M |
Total listed: $55.22M · source: espn.
07 / LATEST REPORT
Injury status
No current injury report entry for this player.
08 / SIGNINGS, TRADES AND ROSTER MOVES
Transactions
No recorded transactions for this player.
09 / LATEST COVERAGE
Player news
LATEST UPDATETemple is set to join the Mavs coaching staff for the 2026-27 season, NBA reporter Marc Stein reports.
Temple will transition into a coaching role on Dusty May's staff in Dallas, likely signaling the end of his playing days. Across 16 NBA seasons, Temple averaged 5.8 points, 2.2 rebounds and 1.6 assists per game.
6 July 2023Pelicans waive veteran F Garrett Temple in cost-cutting move↗
30 June 2023Sources: Pelicans decline Herb Jones option, hopeful of longer deal↗
7 December 2020Chicago Bulls' Garrett Temple says he's recovering from coronavirus↗
20 November 2020Brooklyn Nets declining Garrett Temple's 2020-21 option, source says↗
6 July 2020Nets' Garrett Temple has 'nervous anxiousness' about making trip to Orlando bubble↗
12 June 2020Brooklyn Nets' Garrett Temple: Playing, earning go long way in furthering cause↗
14 August 2020LSAT prep, DJ sets and virtual golf: How NBA players are staying sharp↗
24 January 2024Kyrie Irving talked to teammates after listing pillars of Nets' future↗
10 / BIO, DRAFT AND CONTACT DETAILS
Biography & profile
TeamToronto Raptors
PositionGuard
Jersey17
Height6' 5"
Weight195 lbs
Age40
CollegeLSU
StatusInactive