Click a season to open this player’s full game log, splits and advanced stats for that year; click a team to open its page. A dash means no NBA games were recorded.
03 / EVERY CATEGORY THE PROVIDER REPORTS
Full statistical breakdown
Regular season 2026-27
Defensive
Metric
Total
NBA rank
Blocks
4
Tied-160th
Defensive Rebounds
6
Tied-360th
Steals
3
Tied-300th
Defensive Rebound Rate
0.0
—
Defensive Rebounds Per Game
0.7
—
Blocks Per Game
0.4
—
Steals Per Game
0.3
—
Defensive Rebounds Per 48
4.2
2,880th
Blocks Per 48
2.8
1,280th
Steals Per 48
2.1
2,400th
General
Metric
Total
NBA rank
Disqualifications
0
Tied-22nd
Flagrant Fouls
0
Tied-24th
Fouls
13
Tied-297th
Player Efficiency Rating
11.01
—
Rebound Rate
0.0
—
Ejections
0
Tied-7th
Technical Fouls
0
Tied-104th
Rebounds
11
—
Value Over Replacement Player
0.0
—
Minutes
68
Tied-6th
Minutes Per Game
7.6
—
Rating
5.5
Tied-189th
Plus-Minus
+9
Tied-1st
Rebounds Per Game
1.2
—
Fouls Per Game
1.4
—
Flagrant Fouls Per Game
0.0
—
Technical Fouls Per Game
0.0
—
Ejections Per Game
0.0
—
Disqualifications Per Game
0.0
—
Assist To Turnover Ratio
3.5
—
Steal To Foul Ratio
0.2
—
Block To Foul Ratio
0.3
—
Team Rebounds Per Game
0.0
—
Rebounds
11
—
Total Technical Fouls
0
—
Assist To Turnover Ratio
0.0
—
Steal To Turnover Ratio
0.8
—
Rebounds Per 48 Minutes
7.8
—
Fouls Per 48 Minutes
9.2
2,376th
Flagrant Fouls Per 48 Minutes
0.0
192nd
Technical Fouls Per 48 Minutes
0.0
832nd
Ejections Per 48 Minutes
0.0
56th
Disqualifications Per 48 Minutes
0.0
176th
R/40
6.5
—
Games Played
9
9th
Games Started
1
Tied-222nd
Double Double
0
Tied-121st
Triple Double
0
Tied-13th
Offensive
Metric
Total
NBA rank
Assists
14
Tied-245th
Effective Field Goal Percentage
46.7
—
Field Goals
7/15
—
Field Goals Attempted
15
Tied-372nd
Field Goals Made
7
Tied-359th
Field Goal Percentage
46.7
—
Free Throws
0/2
—
Free Throw Percentage
0.0
—
Free Throws Attempted
2
Tied-374th
Free Throws Made
0
Tied-416th
Offensive Rebounds
5
Tied-280th
Points
14
Tied-384th
Turnovers
4
Tied-315th
3-Point Field Goal Percentage
0.0
—
3-Point Field Goals Attempted
0
Tied-421st
3-Point Field Goals Made
0
Tied-379th
True Shooting Percentage
44.1
—
Total Turnovers
4
—
Assist Ratio
41.3
—
Points in the Paint
0
Tied-1st
Offensive Rebound Rate
0.0
—
Turnover Ratio
11.8
—
Brick Index
0.00
—
Usage Rate
0.0
—
Average Field Goals Made
0.8
—
Average Field Goals Attempted
1.7
—
Average 3-Point Field Goals Made
0.0
—
Average 3-Point Field Goals Attempted
0.0
—
Average Free Throws Made
0.0
—
Average Free Throws Attempted
0.2
—
Points Per Game
1.6
—
Offensive Rebounds Per Game
0.6
—
Assists Per Game
1.6
—
Turnovers Per Game
0.4
—
Offensive Rebound Percentage
0.6
—
Estimated Possessions
14.8
—
Estimated Possessions Per Game
1.6
—
Points Per Estimated Possession
0.9
—
Team Turnovers Per Game
0.0
—
Total Turnovers Per Game
0.4
—
3-Point Field Goal Percentage
0.0
—
2-Point Field Goals Made
7.0
20th
2-Point Field Goals Attempted
15.0
49th
2-Point Field Goals Made per Game
0.8
—
2-Point Field Goals Attempted per Game
1.7
—
2-Point Field Goal Percentage
46.7
—
Shooting Efficiency
0.47
—
Scoring Efficiency
0.933
—
Fieldgoals Made Per 48
4.9
2,872nd
Fieldgoals Attempted Per 48
10.6
2,976th
3-Point Fieldgoals Made Per 48
0.0
3,032nd
3-Point Fieldgoals Attempted Per 48
0.0
3,368th
Freethrows Made Per 48
0.0
3,328th
Freethrows Attempted Per 48
1.4
2,992nd
Points Scored Per 48
9.9
3,072nd
Offensive Rebounds Per 48
3.5
2,240th
Assists Per 48
9.9
1,960th
Turnovers
2.8
2,520th
P/40
8.2
—
A/40
8.2
—
04 / EFFICIENCY, SHOOTING PROFILE, PER-36
Advanced metrics
True shooting %44.7%
Effective FG %47.1%
2-point FG %47.1%
3-point attempt rate0.0%
Free throw rate11.8%
Points per shot attempt0.94
% of points from 3s0.0%
Assist-to-turnover4.00
Points per 36 min7.6
Rebounds per 36 min5.7
Assists per 36 min7.6
Steals per 36 min1.42
Blocks per 36 min1.89
Turnovers per 36 min1.89
Stocks (STL + BLK) per game0.70
Pts + Reb + Ast per game4.4
Efficiency (EFF) per game3.6
Game Score per game (Hollinger)2.0
Minutes per game7.6
Calculated by BallersCulture from the supplied 2026-27 box-score totals using standard formulas (hover a tile to see the formula). Tracking-based metrics such as BPM, VORP, on/off and RAPTOR are not available from this data source.
05 / 9 GAMES IN 2026-27
Game log: Regular season
Date
Opp
Result
MIN
FG
FG%
3PT
3P%
FT
FT%
REB
AST
BLK
STL
PF
TO
PTS
Nov 13
@ PHI
L 123-112
5
0-0
0.0
0-0
0.0
0-0
0.0
0
1
0
0
2
1
0
Nov 12
vs BOS
L 98-93
11
1-4
25.0
0-0
0.0
0-2
0.0
3
4
1
0
5
0
2
Nov 10
vs MEM
L 118-102
16
3-4
75.0
0-0
0.0
0-0
0.0
2
2
1
0
1
0
6
Nov 5
@ DEN
L 128-109
4
1-2
50.0
0-0
0.0
0-0
0.0
0
1
0
0
1
0
2
Nov 3
@ LAC
W 125-118
8
1-1
100.0
0-0
0.0
0-0
0.0
0
0
1
1
2
1
2
Nov 2
@ LAL
L 131-125
4
1-2
50.0
0-0
0.0
0-0
0.0
3
3
0
0
1
1
2
Oct 29
vs ORL
W 129-99
5
0-0
0.0
0-0
0.0
0-0
0.0
0
1
0
1
0
0
0
Oct 26
@ MIN
L 117-94
11
0-1
0.0
0-0
0.0
0-0
0.0
2
0
1
0
1
1
0
Oct 22
vs CHI
W 135-92
5
0-1
0.0
0-0
0.0
0-0
0.0
1
2
0
1
0
0
0
06 / 2026-27 HOME / AWAY, RESULTS, MONTHS AND OPPONENTS
Splits
split
Split
GP
MIN
FG
FG%
3PT
3P%
FT
FT%
OR
DR
REB
AST
BLK
STL
PF
TO
PTS
All Splits
9
7.6
0.8-1.7
46.7
0.0-0.0
0.0
0.0-0.2
0.0
0.6
0.7
1.2
1.6
0.4
0.3
1.4
0.4
1.6
Home
4
9.3
1.0-2.3
44.4
0.0-0.0
0.0
0.0-0.5
0.0
0.5
1.0
1.5
2.3
0.5
0.5
1.5
0.0
2.0
Road
5
6.4
0.6-1.2
50.0
0.0-0.0
0.0
0.0-0.0
0.0
0.6
0.4
1.0
1.0
0.4
0.2
1.4
0.8
1.2
vs. Division
2
8.0
0.5-2.0
25.0
0.0-0.0
0.0
0.0-1.0
0.0
1.0
0.5
1.5
2.5
0.5
0.0
3.5
0.5
1.0
vs. Conference
4
6.5
0.3-1.3
20.0
0.0-0.0
0.0
0.0-0.5
0.0
0.5
0.5
1.0
2.0
0.3
0.5
1.8
0.3
0.5
3+ Days Rest
4
9.0
1.0-2.0
50.0
0.0-0.0
0.0
0.0-0.0
0.0
0.8
1.3
2.0
1.8
0.5
0.3
0.8
0.5
2.0
Month
Split
GP
MIN
FG
FG%
3PT
3P%
FT
FT%
OR
DR
REB
AST
BLK
STL
PF
TO
PTS
October
3
6.7
0.0-0.7
0.0
0.0-0.0
0.0
0.0-0.0
0.0
0.0
1.0
1.0
1.0
0.3
0.7
0.3
0.3
0.0
November
6
8.0
1.2-2.2
53.8
0.0-0.0
0.0
0.0-0.3
0.0
0.8
0.5
1.3
1.8
0.5
0.2
2.0
0.5
2.3
Pre All-Star
9
7.6
0.8-1.7
46.7
0.0-0.0
0.0
0.0-0.2
0.0
0.6
0.7
1.2
1.6
0.4
0.3
1.4
0.4
1.6
Result
Split
GP
MIN
FG
FG%
3PT
3P%
FT
FT%
OR
DR
REB
AST
BLK
STL
PF
TO
PTS
Wins
3
6.0
0.3-0.7
50.0
0.0-0.0
0.0
0.0-0.0
0.0
0.0
0.3
0.3
1.0
0.3
1.0
0.7
0.3
0.7
Losses
6
8.5
1.0-2.2
46.2
0.0-0.0
0.0
0.0-0.3
0.0
0.8
0.8
1.7
1.8
0.5
0.0
1.8
0.5
2.0
Position
Split
GP
MIN
FG
FG%
3PT
3P%
FT
FT%
OR
DR
REB
AST
BLK
STL
PF
TO
PTS
As Starter
1
16.0
3.0-4.0
75.0
0.0-0.0
0.0
0.0-0.0
0.0
0.0
2.0
2.0
2.0
1.0
0.0
1.0
0.0
6.0
Day
Split
GP
MIN
FG
FG%
3PT
3P%
FT
FT%
OR
DR
REB
AST
BLK
STL
PF
TO
PTS
Monday
2
12.0
2.0-2.5
80.0
0.0-0.0
0.0
0.0-0.0
0.0
0.0
1.0
1.0
1.0
1.0
0.5
1.5
0.5
4.0
Wednesday
4
6.3
0.5-1.8
28.6
0.0-0.0
0.0
0.0-0.5
0.0
0.5
0.5
1.0
2.0
0.3
0.5
1.5
0.0
1.0
Thursday
1
5.0
0.0-0.0
0.0
0.0-0.0
0.0
0.0-0.0
0.0
0.0
0.0
0.0
1.0
0.0
0.0
2.0
1.0
0.0
Sunday
2
7.5
0.5-1.5
33.3
0.0-0.0
0.0
0.0-0.0
0.0
1.5
1.0
2.5
1.5
0.5
0.0
1.0
1.0
1.0
Opponent
Split
GP
MIN
FG
FG%
3PT
3P%
FT
FT%
OR
DR
REB
AST
BLK
STL
PF
TO
PTS
Boston Celtics
1
11.0
1.0-4.0
25.0
0.0-0.0
0.0
0.0-2.0
0.0
2.0
1.0
3.0
4.0
1.0
0.0
5.0
0.0
2.0
Chicago Bulls
1
5.0
0.0-1.0
0.0
0.0-0.0
0.0
0.0-0.0
0.0
0.0
1.0
1.0
2.0
0.0
1.0
0.0
0.0
0.0
Denver Nuggets
1
4.0
1.0-2.0
50.0
0.0-0.0
0.0
0.0-0.0
0.0
0.0
0.0
0.0
1.0
0.0
0.0
1.0
0.0
2.0
Los Angeles Clippers
1
8.0
1.0-1.0
100.0
0.0-0.0
0.0
0.0-0.0
0.0
0.0
0.0
0.0
0.0
1.0
1.0
2.0
1.0
2.0
Los Angeles Lakers
1
4.0
1.0-2.0
50.0
0.0-0.0
0.0
0.0-0.0
0.0
3.0
0.0
3.0
3.0
0.0
0.0
1.0
1.0
2.0
Memphis Grizzlies
1
16.0
3.0-4.0
75.0
0.0-0.0
0.0
0.0-0.0
0.0
0.0
2.0
2.0
2.0
1.0
0.0
1.0
0.0
6.0
Minnesota Timberwolves
1
11.0
0.0-1.0
0.0
0.0-0.0
0.0
0.0-0.0
0.0
0.0
2.0
2.0
0.0
1.0
0.0
1.0
1.0
0.0
Orlando Magic
1
5.0
0.0-0.0
0.0
0.0-0.0
0.0
0.0-0.0
0.0
0.0
0.0
0.0
1.0
0.0
1.0
0.0
0.0
0.0
Philadelphia 76ers
1
5.0
0.0-0.0
0.0
0.0-0.0
0.0
0.0-0.0
0.0
0.0
0.0
0.0
1.0
0.0
0.0
2.0
1.0
0.0
07 / SEASON-BY-SEASON HISTORY
Career statistics
Regular Season Averages
Season
Team
GP
GS
MIN
FG
FG%
3PT
3P%
FT
FT%
OR
DR
REB
AST
BLK
STL
PF
TO
PTS
2014-15
San Antonio Spurs
33
8
10.8
0.9-2.7
34.8
0.1-0.3
27.3
0.3-0.4
64.3
0.2
2.0
2.2
0.8
0.2
0.5
0.8
0.3
2.2
2015-16
San Antonio Spurs
78
11
16.0
1.8-3.8
46.8
0.2-0.5
32.4
0.8-1.1
74.7
0.3
2.8
3.1
1.6
0.4
0.8
1.2
0.8
4.5
2016-17
San Antonio Spurs
72
14
14.2
1.3-2.9
44.5
0.2-0.6
37.5
0.6-0.8
78.9
0.5
2.4
2.9
1.3
0.4
0.7
0.9
0.5
3.4
2017-18
San Antonio Spurs
74
67
26.7
3.1-5.9
52.7
0.3-0.8
33.3
1.4-2.0
71.2
1.1
4.2
5.4
2.7
0.8
1.6
1.5
1.3
7.9
2018-19
Memphis Grizzlies
43
40
29.8
3.5-6.4
54.3
0.2-0.8
26.5
0.9-1.5
57.8
1.1
4.7
5.8
3.0
0.9
1.3
2.6
1.3
8.0
2019-20
Memphis Grizzlies
67
28
19.9
2.3-4.9
47.4
0.4-1.3
28.2
0.8-1.2
66.7
0.9
3.4
4.3
2.4
0.6
0.8
1.7
1.0
5.8
2020-21
Memphis Grizzlies
69
69
27.3
4.5-9.5
46.8
1.4-3.8
36.0
2.1-2.7
78.3
0.8
5.0
5.7
3.6
0.8
1.2
1.7
1.2
12.4
2021-22
Memphis Grizzlies
69
11
21.5
3.0-6.8
44.6
0.5-1.6
33.0
1.0-1.5
63.8
1.0
4.3
5.3
2.7
0.7
1.1
1.6
1.0
7.6
2022-23
Minnesota Timberwolves
69
46
28.4
3.7-7.2
50.9
0.6-1.5
41.0
1.4-2.0
73.5
1.0
4.4
5.3
4.9
0.9
1.1
2.1
1.5
9.4
2023-24
Minnesota Timberwolves
79
10
22.6
2.5-5.5
46.0
0.1-0.6
22.9
1.2-1.7
70.8
0.8
2.7
3.5
4.2
0.6
0.9
1.6
1.2
6.4
2024-25
Golden State Warriors
36
3
15.0
2.1-4.7
45.0
0.5-1.4
36.5
0.5-0.8
66.7
0.8
2.3
3.1
2.3
0.6
0.7
1.1
0.6
5.3
2024-25
Miami Heat
25
1
18.4
2.6-5.4
49.3
0.2-0.7
33.3
1.2-1.5
78.9
1.0
2.8
3.8
2.6
0.5
0.6
1.6
0.7
6.7
2024-25
2024 25 Totals
61
4
16.4
2.3-5.0
46.9
0.4-1.1
35.7
0.8-1.1
73.8
0.9
2.5
3.4
2.4
0.5
0.7
1.3
0.6
5.9
2025-26
Utah Jazz
20
0
20.1
2.9-5.5
52.3
0.2-0.3
60.0
1.3-1.9
65.8
1.0
2.4
3.3
3.1
0.5
1.2
2.3
0.9
7.1
2025-26
Memphis Grizzlies
4
3
22.3
3.8-4.8
78.9
0.3-0.3
100.0
1.5-2.0
75.0
0.8
2.8
3.5
0.8
1.0
1.5
3.0
1.8
9.3
2025-26
Minnesota Timberwolves
19
2
19.1
1.8-3.9
47.3
0.0-0.3
0.0
0.9-1.2
77.3
1.1
2.6
3.7
3.3
0.6
0.8
2.0
0.8
4.6
2025-26
2025 26 Totals
43
5
19.8
2.5-4.7
53.0
0.1-0.3
36.4
1.1-1.6
70.6
1.0
2.5
3.5
2.9
0.6
1.0
2.2
0.9
6.2
2026-27
Toronto Raptors
9
1
7.6
0.8-1.7
46.7
0.0-0.0
0.0
0.0-0.2
0.0
0.6
0.7
1.2
1.6
0.4
0.3
1.4
0.4
1.6
Career
—
766
314
21.2
2.6-5.5
48.0
0.4-1.1
34.0
1.1-1.5
71.4
0.8
3.4
4.2
2.8
0.6
1.0
1.6
1.0
6.7
Regular Season Totals
Season
Team
FG
FG%
3PT
3P%
FT
FT%
OR
DR
REB
AST
BLK
STL
PF
TO
PTS
2014-15
San Antonio Spurs
31-89
34.8
3-11
27.3
9-14
64.3
5
67
72
28
7
15
28
10
74
2015-16
San Antonio Spurs
138-295
46.8
12-37
32.4
62-83
74.7
25
219
244
123
29
60
97
59
350
2016-17
San Antonio Spurs
93-209
44.5
15-40
37.5
45-57
78.9
33
175
208
92
26
51
63
39
246
2017-18
San Antonio Spurs
231-438
52.7
19-57
33.3
104-146
71.2
84
312
396
202
60
115
114
94
585
2018-19
Memphis Grizzlies
150-276
54.3
9-34
26.5
37-64
57.8
48
203
251
128
37
54
112
58
346
2019-20
Memphis Grizzlies
157-331
47.4
24-85
28.2
52-78
66.7
58
227
285
162
37
54
111
66
390
2020-21
Memphis Grizzlies
308-658
46.8
94-261
36.0
144-184
78.3
52
344
396
250
57
84
120
86
854
2021-22
Memphis Grizzlies
209-469
44.6
36-109
33.0
67-105
63.8
69
299
368
183
45
77
108
71
521
2022-23
Minnesota Timberwolves
252-495
50.9
43-105
41.0
100-136
73.5
66
302
368
335
63
78
146
103
647
2023-24
Minnesota Timberwolves
199-433
46.0
11-48
22.9
97-137
70.8
60
213
273
331
47
71
128
91
506
2024-25
Golden State Warriors
76-169
45.0
19-52
36.5
18-27
66.7
27
83
110
81
20
26
40
20
189
2024-25
Miami Heat
66-134
49.3
6-18
33.3
30-38
78.9
26
70
96
64
13
14
41
17
168
2024-25
2024 25 Totals
142-303
46.9
25-70
35.7
48-65
73.8
53
153
206
145
33
40
81
37
357
2025-26
Utah Jazz
57-109
52.3
3-5
60.0
25-38
65.8
19
47
66
61
10
23
46
17
142
2025-26
Memphis Grizzlies
15-19
78.9
1-1
100.0
6-8
75.0
3
11
14
3
4
6
12
7
37
2025-26
Minnesota Timberwolves
35-74
47.3
0-5
0.0
17-22
77.3
20
50
70
62
12
16
38
15
87
2025-26
2025 26 Totals
107-202
53.0
4-11
36.4
48-68
70.6
42
108
150
126
26
45
96
39
266
2026-27
Toronto Raptors
7-15
46.7
0-0
0.0
0-2
0.0
5
6
11
14
4
3
13
4
14
Career
—
2024-4213
48.0
295-868
34.0
813-1139
71.4
600
2628
3228
2119
471
747
1217
757
5156
Regular Season Misc Totals
Season
Team
DD2
TD3
DQ
EJECT
TECH
FLAG
AST/TO
STL/TO
SC-EFF
SH-EFF
2014-15
San Antonio Spurs
0
0
0
0
0
0
2.8
1.5
0.831
0.37
2015-16
San Antonio Spurs
1
0
0
0
0
0
2.1
1.0
1.186
0.49
2016-17
San Antonio Spurs
0
0
0
0
0
0
2.4
1.3
1.177
0.48
2017-18
San Antonio Spurs
6
0
0
0
1
0
2.1
1.2
1.336
0.55
2018-19
Memphis Grizzlies
2
1
0
0
2
0
2.2
0.9
1.254
0.56
2019-20
Memphis Grizzlies
0
0
0
0
2
0
2.5
0.8
1.178
0.51
2020-21
Memphis Grizzlies
3
0
2
0
4
0
2.9
1.0
1.298
0.54
2021-22
Memphis Grizzlies
2
0
0
0
3
1
2.6
1.1
1.111
0.48
2022-23
Minnesota Timberwolves
10
3
0
1
7
1
3.3
0.8
1.307
0.55
2023-24
Minnesota Timberwolves
0
0
1
0
2
0
3.6
0.8
1.169
0.47
2024-25
Golden State Warriors
0
0
0
0
1
0
4.1
1.3
1.118
0.51
2024-25
Miami Heat
2
0
0
0
0
0
3.8
0.8
1.254
0.51
2024-25
2024 25 Totals
2
0
0
0
1
0
3.9
1.1
1.178
0.51
2025-26
Utah Jazz
0
0
0
0
0
0
3.6
1.4
1.303
0.54
2025-26
Memphis Grizzlies
0
0
0
0
0
0
0.4
0.9
1.947
0.82
2025-26
Minnesota Timberwolves
0
0
0
0
0
0
4.1
1.1
1.176
0.47
2025-26
2025 26 Totals
0
0
0
0
0
0
3.2
1.2
1.317
0.54
2026-27
Toronto Raptors
0
0
0
0
0
0
3.5
0.8
0.933
0.47
Career
—
26
4
3
1
22
2
2.8
1.0
1.224
0.52
Scoring, rebounding and assist trend
08 / SHOT CHART AND ZONE SHOOTING
Shot profile
Shot-location data is not connected. Add a BALLDONTLIE GOAT-tier NBA API key in NBA Players → Settings to enable shot charts and zone shooting.
LATEST UPDATEAnderson won't start Wednesday's game versus Boston, Sean Grande of NBC Sports Boston reports.
With Collin Murray-Boyles (illness) back from a one-game absence, Anderson will slide to the second unit. The veteran forward has averaged 6.2 minutes per game in six appearances off the bench this season.




 A.J. LawsonG
 Alijah MartinG #55
 Allen GravesF #22
 Andre Jackson Jr.G #44
 Chucky HepburnG #24
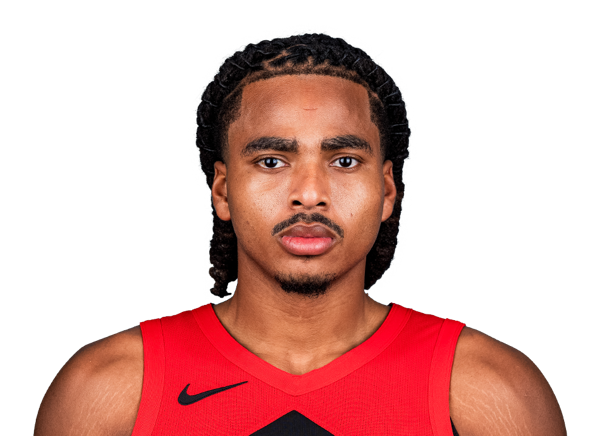 Collin Murray-BoylesF #30
 Garrett TempleG #17
 Immanuel QuickleyG #5
 Ja’Kobe WalterG #14
 Jaden BradleyG #8
 Jakob PoeltlC #19
 Jamal SheadG #23
 Jamarion SharpC
 Jamison BattleF #77
 Kawhi LeonardF #2
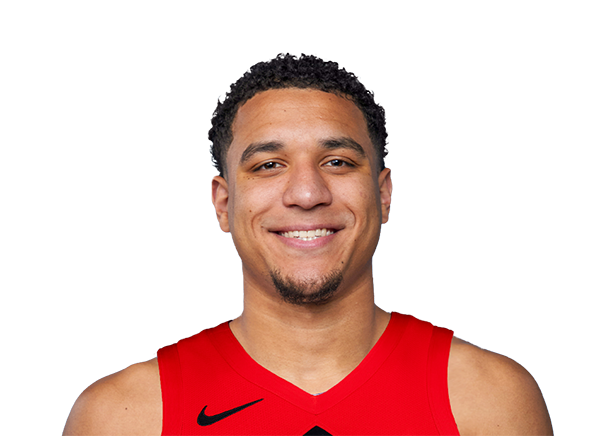 Kevin McCullar Jr.G #9
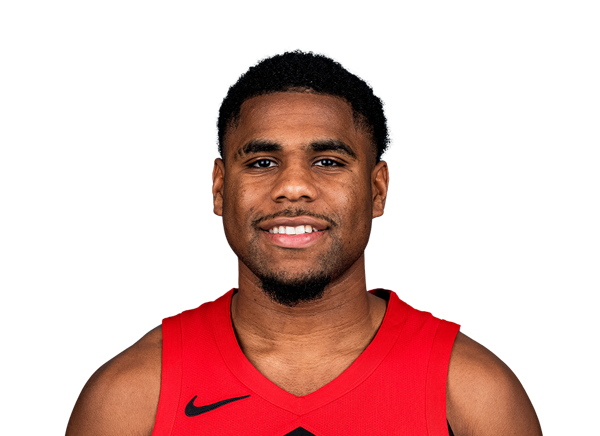 Malachi SmithG #18
 Nate BittleC #12
 Nimari BurnettG #25
 RJ BarrettF #9
 Scottie BarnesF #4
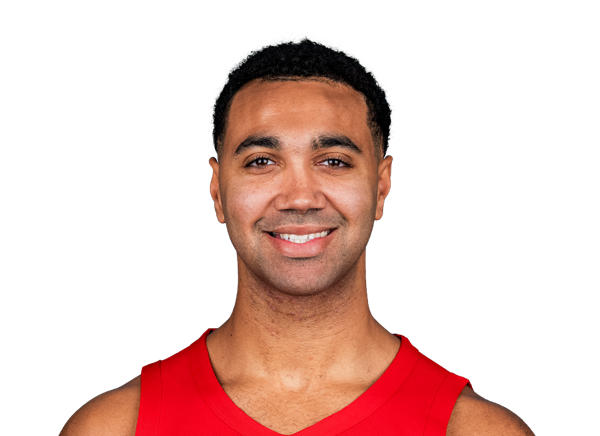 Trayce Jackson-DavisF #32
 Trey Jemison IIIC #50
 Tyreke KeyG #11
 Tyson DegenhartF #20