Click a season to open this player’s full game log, splits and advanced stats for that year; click a team to open its page. A dash means no NBA games were recorded.
03 / EVERY CATEGORY THE PROVIDER REPORTS
Full statistical breakdown
Regular season 2026-27
Defensive
Metric
Total
NBA rank
Blocks
0
Tied-370th
Defensive Rebounds
15
Tied-276th
Steals
6
Tied-217th
Defensive Rebound Rate
0.0
—
Defensive Rebounds Per Game
2.5
—
Blocks Per Game
0.0
—
Steals Per Game
1.0
—
Defensive Rebounds Per 48
5.3
2,649th
Blocks Per 48
0.0
3,552nd
Steals Per 48
2.1
2,083rd
General
Metric
Total
NBA rank
Disqualifications
0
Tied-21st
Flagrant Fouls
0
Tied-22nd
Fouls
17
Tied-250th
Player Efficiency Rating
14.87
—
Rebound Rate
0.0
—
Ejections
0
Tied-7th
Technical Fouls
0
Tied-101st
Rebounds
21
—
Value Over Replacement Player
0.0
—
Minutes
136
Tied-5th
Minutes Per Game
22.7
—
Rating
18.9
Tied-239th
Plus-Minus
0
Tied-1st
Rebounds Per Game
3.5
—
Fouls Per Game
2.8
—
Flagrant Fouls Per Game
0.0
—
Technical Fouls Per Game
0.0
—
Ejections Per Game
0.0
—
Disqualifications Per Game
0.0
—
Assist To Turnover Ratio
7.7
—
Steal To Foul Ratio
0.4
—
Block To Foul Ratio
0.0
—
Team Rebounds Per Game
0.0
—
Rebounds
21
—
Total Technical Fouls
0
—
Assist To Turnover Ratio
0.0
—
Steal To Turnover Ratio
2.0
—
Rebounds Per 48 Minutes
7.4
—
Fouls Per 48 Minutes
6.0
2,400th
Flagrant Fouls Per 48 Minutes
0.0
211th
Technical Fouls Per 48 Minutes
0.0
969th
Ejections Per 48 Minutes
0.0
67th
Disqualifications Per 48 Minutes
0.0
201st
R/40
6.2
—
Games Played
6
6th
Games Started
0
Tied-257th
Double Double
0
Tied-119th
Triple Double
0
Tied-12th
Offensive
Metric
Total
NBA rank
Assists
23
Tied-154th
Effective Field Goal Percentage
50.0
—
Field Goals
19/51
—
Field Goals Attempted
51
Tied-254th
Field Goals Made
19
Tied-279th
Field Goal Percentage
37.3
—
Free Throws
5/6
—
Free Throw Percentage
83.3
—
Free Throws Attempted
6
Tied-303rd
Free Throws Made
5
Tied-292nd
Offensive Rebounds
6
Tied-255th
Points
56
Tied-280th
Turnovers
3
Tied-340th
3-Point Field Goal Percentage
35.1
—
3-Point Field Goals Attempted
37
Tied-182nd
3-Point Field Goals Made
13
Tied-164th
True Shooting Percentage
52.2
—
Total Turnovers
3
—
Assist Ratio
28.9
—
Points in the Paint
0
Tied-1st
Offensive Rebound Rate
0.0
—
Turnover Ratio
3.8
—
Brick Index
0.00
—
Usage Rate
0.0
—
Average Field Goals Made
3.2
—
Average Field Goals Attempted
8.5
—
Average 3-Point Field Goals Made
2.2
Tied-59th
Average 3-Point Field Goals Attempted
6.2
—
Average Free Throws Made
0.8
—
Average Free Throws Attempted
1.0
—
Points Per Game
9.3
—
Offensive Rebounds Per Game
1.0
—
Assists Per Game
3.8
—
Turnovers Per Game
0.5
—
Offensive Rebound Percentage
0.2
—
Estimated Possessions
50.4
—
Estimated Possessions Per Game
8.4
—
Points Per Estimated Possession
1.1
—
Team Turnovers Per Game
0.0
—
Total Turnovers Per Game
0.5
—
3-Point Field Goal Percentage
35.1
112th
2-Point Field Goals Made
6.0
Tied-115th
2-Point Field Goals Attempted
14.0
Tied-72nd
2-Point Field Goals Made per Game
1.0
—
2-Point Field Goals Attempted per Game
2.3
—
2-Point Field Goal Percentage
42.9
—
Shooting Efficiency
0.50
—
Scoring Efficiency
1.098
—
Fieldgoals Made Per 48
6.7
2,678th
Fieldgoals Attempted Per 48
18.0
2,438th
3-Point Fieldgoals Made Per 48
4.6
1,574th
3-Point Fieldgoals Attempted Per 48
13.1
1,747th
Freethrows Made Per 48
1.8
2,803rd
Freethrows Attempted Per 48
2.1
2,908th
Points Scored Per 48
19.8
2,688th
Offensive Rebounds Per 48
2.1
2,448th
Assists Per 48
8.1
1,478th
Turnovers
1.1
3,264th
P/40
16.5
—
A/40
6.8
—
04 / EFFICIENCY, SHOOTING PROFILE, PER-36
Advanced metrics
True shooting %52.0%
Effective FG %50.6%
2-point FG %43.5%
3-point attempt rate72.9%
Free throw rate11.8%
Points per shot attempt1.09
% of points from 3s71.0%
Assist-to-turnover7.60
Points per 36 min14.7
Rebounds per 36 min5.6
Assists per 36 min6.0
Steals per 36 min1.59
Blocks per 36 min0.00
Turnovers per 36 min0.79
Stocks (STL + BLK) per game1.00
Pts + Reb + Ast per game16.6
Efficiency (EFF) per game11.6
Game Score per game (Hollinger)8.0
Minutes per game22.7
Calculated by BallersCulture from the supplied 2026-27 box-score totals using standard formulas (hover a tile to see the formula). Tracking-based metrics such as BPM, VORP, on/off and RAPTOR are not available from this data source.
05 / 6 GAMES IN 2026-27
Game log: Regular season
Date
Opp
Result
MIN
FG
FG%
3PT
3P%
FT
FT%
REB
AST
BLK
STL
PF
TO
PTS
Nov 16
vs CHA
W 113-105
25
5-8
62.5
4-5
80.0
0-0
0.0
3
4
0
0
2
0
14
Nov 14
vs OKC
W 113-112
23
0-4
0.0
0-2
0.0
3-3
100.0
2
3
0
4
3
1
3
Nov 11
@ PHX
L 133-110
22
5-12
41.7
2-8
25.0
0-0
0.0
3
3
0
0
1
0
12
Nov 9
vs NO
W 139-123
19
3-6
50.0
1-4
25.0
0-0
0.0
4
2
0
0
1
0
7
Nov 5
vs MIA
L 117-116 OT
23
3-11
27.3
3-9
33.3
0-0
0.0
5
5
0
1
5
1
9
Nov 3
vs TOR
L 125-118
23
3-10
30.0
3-9
33.3
2-3
66.7
4
6
0
1
5
1
11
06 / 2026-27 HOME / AWAY, RESULTS, MONTHS AND OPPONENTS
Splits
split
Split
GP
MIN
FG
FG%
3PT
3P%
FT
FT%
OR
DR
REB
AST
BLK
STL
PF
TO
PTS
All Splits
6
22.7
3.2-8.5
37.3
2.2-6.2
35.1
0.8-1.0
83.3
1.0
2.5
3.5
3.8
0.0
1.0
2.8
0.5
9.3
Home
5
22.6
2.8-7.8
35.9
2.2-5.8
37.9
1.0-1.2
83.3
0.6
3.0
3.6
4.0
0.0
1.2
3.2
0.6
8.8
Road
1
22.0
5.0-12.0
41.7
2.0-8.0
25.0
0.0-0.0
0.0
3.0
0.0
3.0
3.0
0.0
0.0
1.0
0.0
12.0
vs. Division
1
22.0
5.0-12.0
41.7
2.0-8.0
25.0
0.0-0.0
0.0
3.0
0.0
3.0
3.0
0.0
0.0
1.0
0.0
12.0
vs. Conference
3
21.3
2.7-7.3
36.4
1.0-4.7
21.4
1.0-1.0
100.0
1.3
1.7
3.0
2.7
0.0
1.3
1.7
0.3
7.3
3+ Days Rest
2
21.5
3.0-8.0
37.5
2.0-6.5
30.8
1.0-1.5
66.7
1.0
3.0
4.0
4.0
0.0
0.5
3.0
0.5
9.0
Month
Split
GP
MIN
FG
FG%
3PT
3P%
FT
FT%
OR
DR
REB
AST
BLK
STL
PF
TO
PTS
November
6
22.7
3.2-8.5
37.3
2.2-6.2
35.1
0.8-1.0
83.3
1.0
2.5
3.5
3.8
0.0
1.0
2.8
0.5
9.3
Pre All-Star
6
22.7
3.2-8.5
37.3
2.2-6.2
35.1
0.8-1.0
83.3
1.0
2.5
3.5
3.8
0.0
1.0
2.8
0.5
9.3
Result
Split
GP
MIN
FG
FG%
3PT
3P%
FT
FT%
OR
DR
REB
AST
BLK
STL
PF
TO
PTS
Wins
3
22.3
2.7-6.0
44.4
1.7-3.7
45.5
1.0-1.0
100.0
0.3
2.7
3.0
3.0
0.0
1.3
2.0
0.3
8.0
Losses
3
23.0
3.7-11.0
33.3
2.7-8.7
30.8
0.7-1.0
66.7
1.7
2.3
4.0
4.7
0.0
0.7
3.7
0.7
10.7
Day
Split
GP
MIN
FG
FG%
3PT
3P%
FT
FT%
OR
DR
REB
AST
BLK
STL
PF
TO
PTS
Monday
1
23.0
3.0-10.0
30.0
3.0-9.0
33.3
2.0-3.0
66.7
1.0
3.0
4.0
6.0
0.0
1.0
5.0
1.0
11.0
Tuesday
1
22.0
5.0-12.0
41.7
2.0-8.0
25.0
0.0-0.0
0.0
3.0
0.0
3.0
3.0
0.0
0.0
1.0
0.0
12.0
Wednesday
1
23.0
3.0-11.0
27.3
3.0-9.0
33.3
0.0-0.0
0.0
1.0
4.0
5.0
5.0
0.0
1.0
5.0
1.0
9.0
Friday
1
23.0
0.0-4.0
0.0
0.0-2.0
0.0
3.0-3.0
100.0
0.0
2.0
2.0
3.0
0.0
4.0
3.0
1.0
3.0
Sunday
2
22.0
4.0-7.0
57.1
2.5-4.5
55.6
0.0-0.0
0.0
0.5
3.0
3.5
3.0
0.0
0.0
1.5
0.0
10.5
Opponent
Split
GP
MIN
FG
FG%
3PT
3P%
FT
FT%
OR
DR
REB
AST
BLK
STL
PF
TO
PTS
Charlotte Hornets
1
25.0
5.0-8.0
62.5
4.0-5.0
80.0
0.0-0.0
0.0
0.0
3.0
3.0
4.0
0.0
0.0
2.0
0.0
14.0
Miami Heat
1
23.0
3.0-11.0
27.3
3.0-9.0
33.3
0.0-0.0
0.0
1.0
4.0
5.0
5.0
0.0
1.0
5.0
1.0
9.0
New Orleans Pelicans
1
19.0
3.0-6.0
50.0
1.0-4.0
25.0
0.0-0.0
0.0
1.0
3.0
4.0
2.0
0.0
0.0
1.0
0.0
7.0
Phoenix Suns
1
22.0
5.0-12.0
41.7
2.0-8.0
25.0
0.0-0.0
0.0
3.0
0.0
3.0
3.0
0.0
0.0
1.0
0.0
12.0
Oklahoma City Thunder
1
23.0
0.0-4.0
0.0
0.0-2.0
0.0
3.0-3.0
100.0
0.0
2.0
2.0
3.0
0.0
4.0
3.0
1.0
3.0
Toronto Raptors
1
23.0
3.0-10.0
30.0
3.0-9.0
33.3
2.0-3.0
66.7
1.0
3.0
4.0
6.0
0.0
1.0
5.0
1.0
11.0
07 / SEASON-BY-SEASON HISTORY
Career statistics
Regular Season Averages
Season
Team
GP
GS
MIN
FG
FG%
3PT
3P%
FT
FT%
OR
DR
REB
AST
BLK
STL
PF
TO
PTS
2019-20
Chicago Bulls
2
0
3.0
1.0-1.5
66.7
0.0-0.5
0.0
0.5-0.5
100.0
0.5
0.0
0.5
0.0
0.0
0.0
0.5
0.0
2.5
2020-21
Miami Heat
39
0
13.0
2.2-4.8
45.5
1.3-3.8
33.8
0.4-0.6
66.7
0.1
0.9
1.1
0.6
0.1
0.3
1.1
0.2
6.1
2021-22
Miami Heat
68
16
23.3
3.7-8.3
44.1
2.7-6.5
41.0
0.6-0.8
79.2
0.4
2.6
3.0
1.4
0.2
0.4
1.7
0.8
10.6
2022-23
Miami Heat
80
33
28.4
4.1-9.9
41.0
2.5-7.0
35.0
1.0-1.1
87.6
0.6
2.6
3.2
2.1
0.2
0.5
2.1
0.9
11.5
2023-24
Cleveland Cavaliers
70
70
32.0
4.3-10.4
41.8
2.4-6.8
35.1
1.1-1.4
79.4
0.9
3.9
4.8
4.0
0.4
0.9
2.4
1.6
12.2
2024-25
Cleveland Cavaliers
50
37
25.5
3.3-7.5
44.2
2.3-5.9
38.6
0.6-0.7
82.4
1.1
3.3
4.3
3.2
0.2
0.5
2.1
1.1
9.4
2025-26
Cleveland Cavaliers
12
5
24.0
3.9-8.8
44.3
2.8-6.8
40.2
0.6-0.8
77.8
0.8
4.7
5.4
2.0
0.0
0.3
2.8
0.8
11.2
2026-27
La Clippers
6
0
22.7
3.2-8.5
37.3
2.2-6.2
35.1
0.8-1.0
83.3
1.0
2.5
3.5
3.8
0.0
1.0
2.8
0.5
9.3
Career
—
327
161
25.4
3.7-8.6
42.6
2.3-6.3
36.9
0.8-1.0
81.2
0.7
2.8
3.5
2.4
0.2
0.6
2.0
1.0
10.4
Regular Season Totals
Season
Team
FG
FG%
3PT
3P%
FT
FT%
OR
DR
REB
AST
BLK
STL
PF
TO
PTS
2019-20
Chicago Bulls
2-3
66.7
0-1
0.0
1-1
100.0
1
0
1
0
0
0
1
0
5
2020-21
Miami Heat
85-187
45.5
50-148
33.8
16-24
66.7
5
36
41
24
2
11
43
8
236
2021-22
Miami Heat
249-564
44.1
181-442
41.0
42-53
79.2
24
178
202
92
16
28
116
57
721
2022-23
Miami Heat
324-790
41.0
197-563
35.0
78-89
87.6
49
209
258
171
12
42
166
69
923
2023-24
Cleveland Cavaliers
304-728
41.8
168-479
35.1
77-97
79.4
66
272
338
283
29
64
170
112
853
2024-25
Cleveland Cavaliers
165-373
44.2
113-293
38.6
28-34
82.4
53
164
217
158
12
26
104
54
471
2025-26
Cleveland Cavaliers
47-106
44.3
33-82
40.2
7-9
77.8
9
56
65
24
0
3
34
9
134
2026-27
La Clippers
19-51
37.3
13-37
35.1
5-6
83.3
6
15
21
23
0
6
17
3
56
Career
—
1195-2802
42.6
755-2045
36.9
254-313
81.2
213
930
1143
775
71
180
651
312
3399
Regular Season Misc Totals
Season
Team
DD2
TD3
DQ
EJECT
TECH
FLAG
AST/TO
STL/TO
SC-EFF
SH-EFF
2019-20
Chicago Bulls
0
0
0
0
0
0
0.0
0.0
1.667
0.67
2020-21
Miami Heat
0
0
0
0
0
0
3.0
1.4
1.262
0.59
2021-22
Miami Heat
0
0
1
0
4
0
1.6
0.5
1.278
0.60
2022-23
Miami Heat
2
0
0
0
4
1
2.5
0.6
1.168
0.53
2023-24
Cleveland Cavaliers
5
1
1
0
12
1
2.5
0.6
1.172
0.53
2024-25
Cleveland Cavaliers
0
0
0
0
3
0
2.9
0.5
1.263
0.59
2025-26
Cleveland Cavaliers
0
0
0
0
1
1
2.7
0.3
1.264
0.60
2026-27
La Clippers
0
0
0
0
0
0
7.7
2.0
1.098
0.50
Career
—
7
1
2
0
24
3
2.5
0.6
1.213
0.56
Scoring, rebounding and assist trend
08 / SHOT CHART AND ZONE SHOOTING
Shot profile
Shot-location data is not connected. Add a BALLDONTLIE GOAT-tier NBA API key in NBA Players → Settings to enable shot charts and zone shooting.
LATEST UPDATEStrus chipped in 14 points (5-8 FG, 4-5 3Pt), four assists and three rebounds over 25 minutes during Sunday's 113-105 win over the Hornets.
Strus torched the nets from downtown and dropped a season-best scoring total Sunday, capitalizing on his season high in playing time. The veteran wing also knocked down a season-high four three-pointers. He's scored in double figures in three of his six regular-season games, averaging 9.3 points, 3.8 assists, 3.5 rebounds and 1.0 steals in 22.7 minutes per contest.




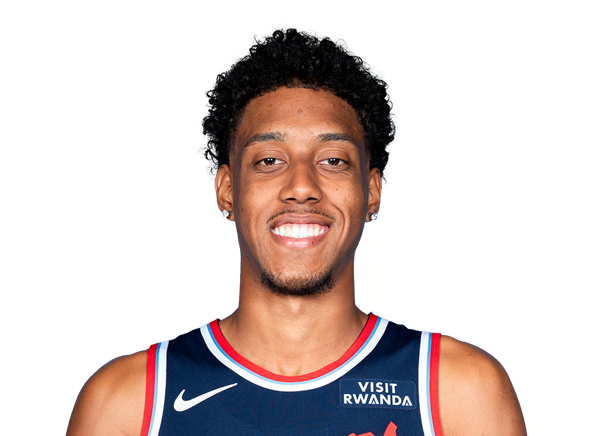 Baba MillerF #18
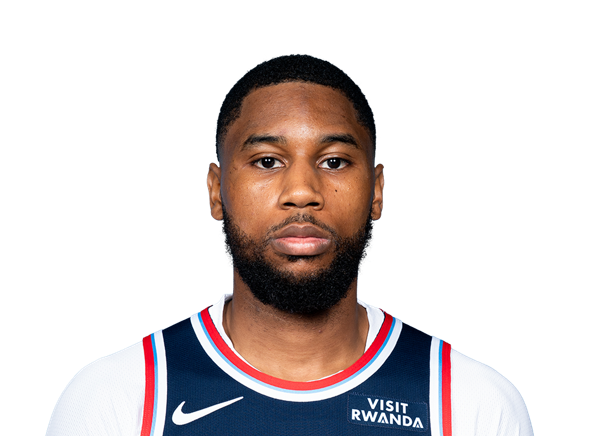 Blake WesleyG #20
 Bradley BealG #3
 Brandon IngramF #7
 Brook LopezC #11
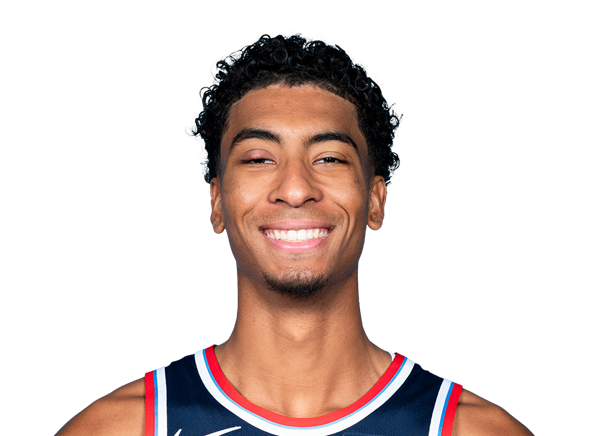 Cam ChristieG #24
 Darius GarlandG #10
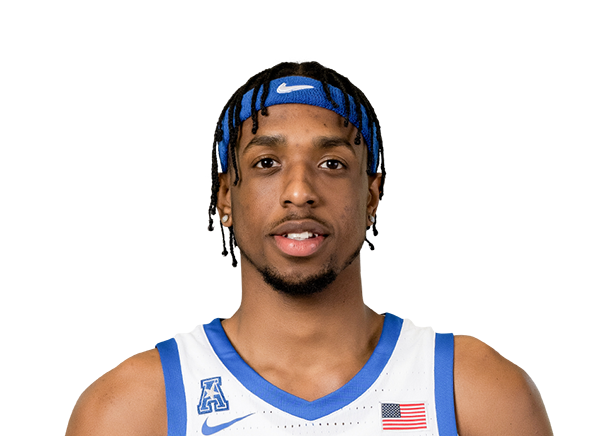 DeAndre WilliamsF
 Derrick Jones Jr.F #5
 Fletcher LoyerG #26
 Gradey DickG #9
 Isaiah JacksonF #23
 Jahmyl TelfortF #19
 Jalen PickettG #21
 Jordan MillerG #22
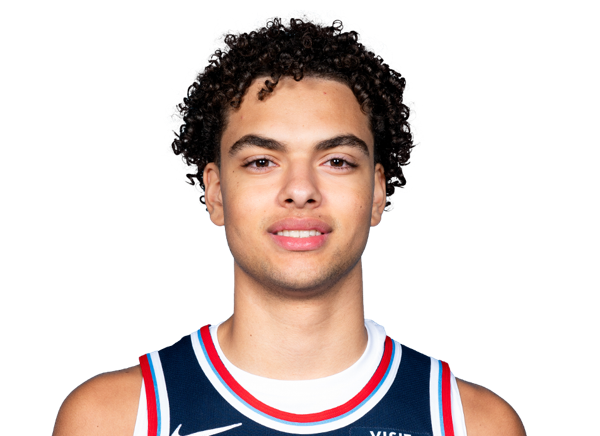 Keaton WaglerG #1
 Kobe SandersG #4
 Kris DunnG #8
 Nick MartinelliF #12
 Nicolas BatumF #33
 Rui HachimuraF #28
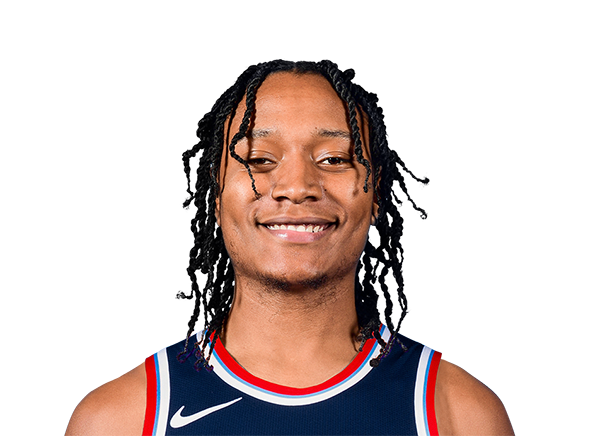 TyTy Washington Jr.G #15
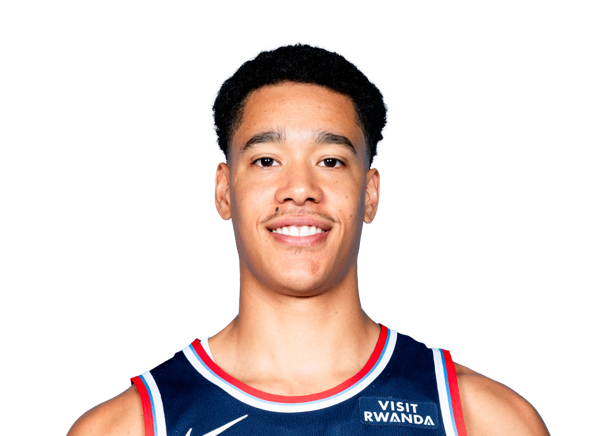 Yanic Konan NiederhauserC #14
 Yuki KawamuraG #17