Click a season to open this player’s full game log, splits and advanced stats for that year; click a team to open its page. A dash means no NBA games were recorded.
03 / EVERY CATEGORY THE PROVIDER REPORTS
Full statistical breakdown
Regular season 2026-27
Defensive
Metric
Total
NBA rank
Blocks
2
Tied-230th
Defensive Rebounds
25
Tied-209th
Steals
7
Tied-193rd
Defensive Rebound Rate
0.0
—
Defensive Rebounds Per Game
2.1
Tied-203rd
Blocks Per Game
0.2
Tied-206th
Steals Per Game
0.6
181st
Defensive Rebounds Per 48
6.3
2,508th
Blocks Per 48
0.5
2,760th
Steals Per 48
1.8
2,316th
General
Metric
Total
NBA rank
Disqualifications
0
Tied-21st
Flagrant Fouls
0
Tied-22nd
Fouls
22
Tied-189th
Player Efficiency Rating
16.44
111th
Rebound Rate
0.0
—
Ejections
0
Tied-7th
Technical Fouls
0
Tied-101st
Rebounds
35
—
Value Over Replacement Player
16.1
—
Minutes
191
Tied-4th
Minutes Per Game
15.9
—
Rating
13.8
Tied-74th
Plus-Minus
+23
Tied-1st
Rebounds Per Game
2.9
Tied-201st
Fouls Per Game
1.8
188th
Flagrant Fouls Per Game
0.0
Tied-19th
Technical Fouls Per Game
0.0
Tied-82nd
Ejections Per Game
0.0
Tied-6th
Disqualifications Per Game
0.0
Tied-20th
Assist To Turnover Ratio
0.8
—
Steal To Foul Ratio
0.3
—
Block To Foul Ratio
0.1
—
Team Rebounds Per Game
0.0
—
Rebounds
35
—
Total Technical Fouls
0
—
Assist To Turnover Ratio
0.0
—
Steal To Turnover Ratio
0.8
—
Rebounds Per 48 Minutes
8.8
—
Fouls Per 48 Minutes
5.5
2,268th
Flagrant Fouls Per 48 Minutes
0.0
264th
Technical Fouls Per 48 Minutes
0.0
1,212th
Ejections Per 48 Minutes
0.0
84th
Disqualifications Per 48 Minutes
0.0
252nd
R/40
7.3
—
Games Played
12
12th
Games Started
1
Tied-219th
Double Double
0
Tied-119th
Triple Double
0
Tied-12th
Offensive
Metric
Total
NBA rank
Assists
7
Tied-315th
Effective Field Goal Percentage
64.2
—
Field Goals
37/67
—
Field Goals Attempted
67
Tied-209th
Field Goals Made
37
Tied-176th
Field Goal Percentage
55.2
—
Free Throws
12/16
—
Free Throw Percentage
75.0
Tied-166th
Free Throws Attempted
16
Tied-202nd
Free Throws Made
12
Tied-200th
Offensive Rebounds
10
Tied-164th
Points
98
189th
Turnovers
9
Tied-227th
3-Point Field Goal Percentage
52.2
Tied-14th
3-Point Field Goals Attempted
23
Tied-243rd
3-Point Field Goals Made
12
Tied-181st
True Shooting Percentage
66.2
—
Total Turnovers
9
—
Assist Ratio
7.8
—
Points in the Paint
0
Tied-1st
Offensive Rebound Rate
0.0
—
Turnover Ratio
10.0
—
Brick Index
0.00
—
Usage Rate
0.0
—
Average Field Goals Made
3.1
—
Average Field Goals Attempted
5.6
234th
Average 3-Point Field Goals Made
1.0
Tied-172nd
Average 3-Point Field Goals Attempted
1.9
Tied-226th
Average Free Throws Made
1.0
—
Average Free Throws Attempted
1.3
Tied-188th
Points Per Game
8.2
179th
Offensive Rebounds Per Game
0.8
Tied-153rd
Assists Per Game
0.6
Tied-269th
Turnovers Per Game
0.8
217th
Offensive Rebound Percentage
0.3
—
Estimated Possessions
72.4
—
Estimated Possessions Per Game
6.0
—
Points Per Estimated Possession
1.4
—
Team Turnovers Per Game
0.0
—
Total Turnovers Per Game
0.8
—
3-Point Field Goal Percentage
52.2
—
2-Point Field Goals Made
25.0
5th
2-Point Field Goals Attempted
44.0
34th
2-Point Field Goals Made per Game
2.1
—
2-Point Field Goals Attempted per Game
3.7
—
2-Point Field Goal Percentage
56.8
—
Shooting Efficiency
0.64
—
Scoring Efficiency
1.463
—
Fieldgoals Made Per 48
9.3
2,112th
Fieldgoals Attempted Per 48
16.8
2,508th
3-Point Fieldgoals Made Per 48
3.0
2,172nd
3-Point Fieldgoals Attempted Per 48
5.8
2,916th
Freethrows Made Per 48
3.0
2,400th
Freethrows Attempted Per 48
4.0
2,424th
Points Scored Per 48
24.6
Tied-2,268th
Offensive Rebounds Per 48
2.5
1,968th
Assists Per 48
1.8
3,780th
Turnovers
2.3
2,724th
P/40
20.5
—
A/40
1.5
—
04 / EFFICIENCY, SHOOTING PROFILE, PER-36
Advanced metrics
True shooting %66.4%
Effective FG %64.3%
2-point FG %56.8%
3-point attempt rate33.9%
Free throw rate23.2%
Points per shot attempt1.46
% of points from 3s36.6%
Assist-to-turnover0.75
Points per 36 min18.6
Rebounds per 36 min6.6
Assists per 36 min1.4
Steals per 36 min1.36
Blocks per 36 min0.45
Turnovers per 36 min1.81
Stocks (STL + BLK) per game0.80
Pts + Reb + Ast per game11.7
Efficiency (EFF) per game8.9
Game Score per game (Hollinger)6.2
Minutes per game15.9
Calculated by BallersCulture from the supplied 2026-27 box-score totals using standard formulas (hover a tile to see the formula). Tracking-based metrics such as BPM, VORP, on/off and RAPTOR are not available from this data source.
05 / 12 GAMES IN 2026-27
Game log: Regular season
Date
Opp
Result
MIN
FG
FG%
3PT
3P%
FT
FT%
REB
AST
BLK
STL
PF
TO
PTS
Nov 16
vs CHA
W 113-105
19
5-7
71.4
2-2
100.0
0-0
0.0
2
0
0
0
2
1
12
Nov 14
vs OKC
W 113-112
19
5-7
71.4
2-2
100.0
1-3
33.3
3
0
0
0
1
0
13
Nov 11
@ PHX
L 133-110
19
4-9
44.4
1-4
25.0
1-1
100.0
3
2
0
1
1
0
10
Nov 9
vs NO
W 139-123
17
6-7
85.7
2-2
100.0
1-2
50.0
4
0
0
2
3
0
15
Nov 5
vs MIA
L 117-116 OT
7
2-3
66.7
0-0
0.0
0-0
0.0
2
1
0
0
1
0
4
Nov 3
vs TOR
L 125-118
29
5-11
45.5
0-1
0.0
2-2
100.0
4
3
0
2
5
1
12
Nov 2
@ GS
L 124-112
3
0-3
0.0
0-1
0.0
0-0
0.0
1
0
0
0
0
0
0
Oct 31
@ MIN
L 127-101
12
1-2
50.0
1-2
50.0
0-0
0.0
0
1
1
0
1
0
3
Oct 29
vs LAL
L 103-87
19
1-4
25.0
1-3
33.3
2-2
100.0
5
0
0
0
1
3
5
Oct 26
@ OKC
L 108-101
18
2-5
40.0
2-4
50.0
0-0
0.0
3
0
0
1
2
1
6
Oct 24
@ LAL
L 125-117
12
3-5
60.0
0-0
0.0
0-0
0.0
4
0
0
1
1
1
6
Oct 22
vs SAC
W 121-96
19
3-4
75.0
1-2
50.0
5-6
83.3
4
0
1
0
4
2
12
06 / 2026-27 HOME / AWAY, RESULTS, MONTHS AND OPPONENTS
Splits
split
Split
GP
MIN
FG
FG%
3PT
3P%
FT
FT%
OR
DR
REB
AST
BLK
STL
PF
TO
PTS
All Splits
12
15.9
3.1-5.6
55.2
1.0-1.9
52.2
1.0-1.3
75.0
0.8
2.1
2.9
0.6
0.2
0.6
1.8
0.8
8.2
Home
7
18.3
3.9-6.1
62.8
1.1-1.7
66.7
1.6-2.1
73.3
0.7
2.7
3.4
0.6
0.1
0.6
2.4
1.0
10.4
Road
5
12.6
2.0-4.8
41.7
0.8-2.2
36.4
0.2-0.2
100.0
1.0
1.2
2.2
0.6
0.2
0.6
1.0
0.4
5.0
vs. Division
5
14.4
2.2-5.0
44.0
0.6-2.0
30.0
1.6-1.8
88.9
0.8
2.6
3.4
0.4
0.2
0.4
1.4
1.2
6.6
vs. Conference
9
15.2
2.8-5.1
54.3
1.1-2.2
50.0
1.1-1.6
71.4
0.9
2.1
3.0
0.3
0.2
0.6
1.6
0.8
7.8
3+ Days Rest
2
18.0
4.5-5.5
81.8
1.5-2.0
75.0
3.0-4.0
75.0
0.5
3.5
4.0
0.0
0.5
1.0
3.5
1.0
13.5
Month
Split
GP
MIN
FG
FG%
3PT
3P%
FT
FT%
OR
DR
REB
AST
BLK
STL
PF
TO
PTS
October
5
16.0
2.0-4.0
50.0
1.0-2.2
45.5
1.4-1.6
87.5
0.8
2.4
3.2
0.2
0.4
0.4
1.8
1.4
6.4
November
7
15.9
3.9-6.7
57.4
1.0-1.7
58.3
0.7-1.1
62.5
0.9
1.9
2.7
0.9
0.0
0.7
1.9
0.3
9.4
Pre All-Star
12
15.9
3.1-5.6
55.2
1.0-1.9
52.2
1.0-1.3
75.0
0.8
2.1
2.9
0.6
0.2
0.6
1.8
0.8
8.2
Result
Split
GP
MIN
FG
FG%
3PT
3P%
FT
FT%
OR
DR
REB
AST
BLK
STL
PF
TO
PTS
Wins
4
18.3
4.8-6.3
76.0
1.8-2.0
87.5
1.8-2.8
63.6
0.5
2.8
3.3
0.0
0.3
0.5
2.5
0.8
13.0
Losses
8
14.8
2.3-5.3
42.9
0.6-1.9
33.3
0.6-0.6
100.0
1.0
1.8
2.8
0.9
0.1
0.6
1.5
0.8
5.8
Position
Split
GP
MIN
FG
FG%
3PT
3P%
FT
FT%
OR
DR
REB
AST
BLK
STL
PF
TO
PTS
As Starter
1
29.0
5.0-11.0
45.5
0.0-1.0
0.0
2.0-2.0
100.0
2.0
2.0
4.0
3.0
0.0
2.0
5.0
1.0
12.0
Day
Split
GP
MIN
FG
FG%
3PT
3P%
FT
FT%
OR
DR
REB
AST
BLK
STL
PF
TO
PTS
Monday
1
29.0
5.0-11.0
45.5
0.0-1.0
0.0
2.0-2.0
100.0
2.0
2.0
4.0
3.0
0.0
2.0
5.0
1.0
12.0
Tuesday
1
19.0
4.0-9.0
44.4
1.0-4.0
25.0
1.0-1.0
100.0
2.0
1.0
3.0
2.0
0.0
1.0
1.0
0.0
10.0
Wednesday
3
15.0
2.0-3.7
54.5
0.7-1.7
40.0
2.3-2.7
87.5
0.3
3.3
3.7
0.3
0.3
0.0
2.0
1.7
7.0
Friday
3
14.0
3.0-4.7
64.3
1.0-1.3
75.0
0.3-1.0
33.3
0.7
1.7
2.3
0.3
0.3
0.3
1.0
0.3
7.3
Sunday
4
14.0
3.3-5.5
59.1
1.5-2.3
66.7
0.3-0.5
50.0
0.8
1.8
2.5
0.0
0.0
0.8
1.8
0.5
8.3
Opponent
Split
GP
MIN
FG
FG%
3PT
3P%
FT
FT%
OR
DR
REB
AST
BLK
STL
PF
TO
PTS
Charlotte Hornets
1
19.0
5.0-7.0
71.4
2.0-2.0
100.0
0.0-0.0
0.0
0.0
2.0
2.0
0.0
0.0
0.0
2.0
1.0
12.0
Golden State Warriors
1
3.0
0.0-3.0
0.0
0.0-1.0
0.0
0.0-0.0
0.0
0.0
1.0
1.0
0.0
0.0
0.0
0.0
0.0
0.0
Los Angeles Lakers
2
15.5
2.0-4.5
44.4
0.5-1.5
33.3
1.0-1.0
100.0
1.0
3.5
4.5
0.0
0.0
0.5
1.0
2.0
5.5
Miami Heat
1
7.0
2.0-3.0
66.7
0.0-0.0
0.0
0.0-0.0
0.0
0.0
2.0
2.0
1.0
0.0
0.0
1.0
0.0
4.0
Minnesota Timberwolves
1
12.0
1.0-2.0
50.0
1.0-2.0
50.0
0.0-0.0
0.0
0.0
0.0
0.0
1.0
1.0
0.0
1.0
0.0
3.0
New Orleans Pelicans
1
17.0
6.0-7.0
85.7
2.0-2.0
100.0
1.0-2.0
50.0
1.0
3.0
4.0
0.0
0.0
2.0
3.0
0.0
15.0
Phoenix Suns
1
19.0
4.0-9.0
44.4
1.0-4.0
25.0
1.0-1.0
100.0
2.0
1.0
3.0
2.0
0.0
1.0
1.0
0.0
10.0
Sacramento Kings
1
19.0
3.0-4.0
75.0
1.0-2.0
50.0
5.0-6.0
83.3
0.0
4.0
4.0
0.0
1.0
0.0
4.0
2.0
12.0
Oklahoma City Thunder
2
18.0
3.5-6.0
58.3
2.0-3.0
66.7
0.5-1.5
33.3
1.5
1.5
3.0
0.0
0.0
0.5
1.5
0.5
9.5
Toronto Raptors
1
29.0
5.0-11.0
45.5
0.0-1.0
0.0
2.0-2.0
100.0
2.0
2.0
4.0
3.0
0.0
2.0
5.0
1.0
12.0
07 / SEASON-BY-SEASON HISTORY
Career statistics
Regular Season Averages
Season
Team
GP
GS
MIN
FG
FG%
3PT
3P%
FT
FT%
OR
DR
REB
AST
BLK
STL
PF
TO
PTS
2023-24
Toronto Raptors
60
17
21.1
3.2-7.4
42.5
1.5-4.0
36.5
0.7-0.9
86.3
0.5
1.8
2.2
1.1
0.0
0.6
1.5
0.8
8.5
2024-25
Toronto Raptors
54
54
29.4
4.9-12.0
41.0
2.1-6.0
35.0
2.5-2.9
85.8
0.8
2.8
3.6
1.8
0.2
0.9
2.2
1.5
14.4
2025-26
Toronto Raptors
76
1
14.0
2.1-5.1
41.9
0.7-2.4
30.1
1.0-1.2
87.5
0.6
1.4
1.9
0.7
0.1
0.6
1.3
0.6
6.0
2026-27
La Clippers
12
1
15.9
3.1-5.6
55.2
1.0-1.9
52.2
1.0-1.3
75.0
0.8
2.1
2.9
0.6
0.2
0.6
1.8
0.8
8.2
Career
—
202
73
20.4
3.2-7.6
42.3
1.3-3.8
34.8
1.3-1.5
85.8
0.6
1.9
2.5
1.1
0.1
0.7
1.6
0.9
9.1
Regular Season Totals
Season
Team
FG
FG%
3PT
3P%
FT
FT%
OR
DR
REB
AST
BLK
STL
PF
TO
PTS
2023-24
Toronto Raptors
189-445
42.5
88-241
36.5
44-51
86.3
27
105
132
68
2
34
87
50
510
2024-25
Toronto Raptors
265-647
41.0
114-326
35.0
133-155
85.8
44
149
193
98
10
48
120
83
777
2025-26
Toronto Raptors
161-384
41.9
56-186
30.1
77-88
87.5
42
105
147
51
7
45
101
42
455
2026-27
La Clippers
37-67
55.2
12-23
52.2
12-16
75.0
10
25
35
7
2
7
22
9
98
Career
—
652-1543
42.3
270-776
34.8
266-310
85.8
123
384
507
224
21
134
330
184
1840
Regular Season Misc Totals
Season
Team
DD2
TD3
DQ
EJECT
TECH
FLAG
AST/TO
STL/TO
SC-EFF
SH-EFF
2023-24
Toronto Raptors
0
0
0
0
0
0
1.4
0.7
1.146
0.52
2024-25
Toronto Raptors
0
0
0
0
0
0
1.2
0.6
1.201
0.50
2025-26
Toronto Raptors
1
0
0
0
0
0
1.2
1.1
1.185
0.49
2026-27
La Clippers
0
0
0
0
0
0
0.8
0.8
1.463
0.64
Career
—
1
0
0
0
0
0
1.2
0.7
1.192
0.51
Scoring, rebounding and assist trend
08 / SHOT CHART AND ZONE SHOOTING
Shot profile
Shot-location data is not connected. Add a BALLDONTLIE GOAT-tier NBA API key in NBA Players → Settings to enable shot charts and zone shooting.
LATEST UPDATEDick notched 15 points (6-7 FG, 2-2 3Pt, 1-2 FT), four rebounds and two steals in 17 minutes during Sunday's 139-123 victory over the Pelicans.
Dick went for an efficient 15 points off the bench Sunday. However, the swingman is in danger of losing playing time once Brandon Ingram (Achilles) is cleared to make his season debut.




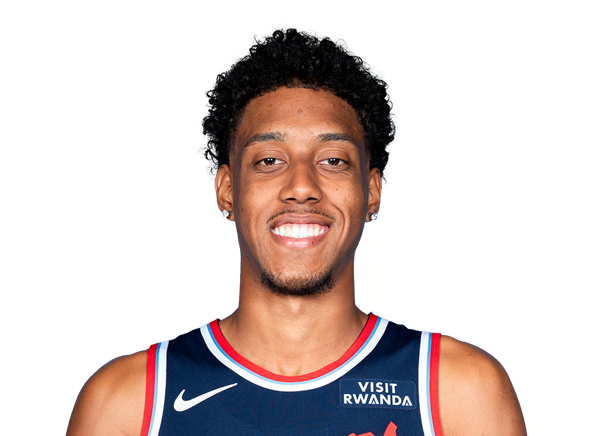 Baba MillerF #18
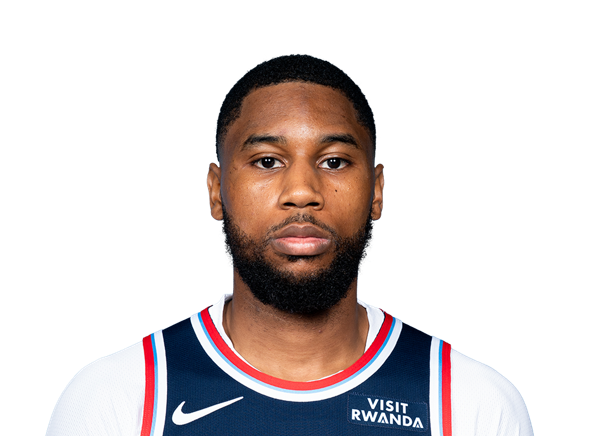 Blake WesleyG #20
 Bradley BealG #3
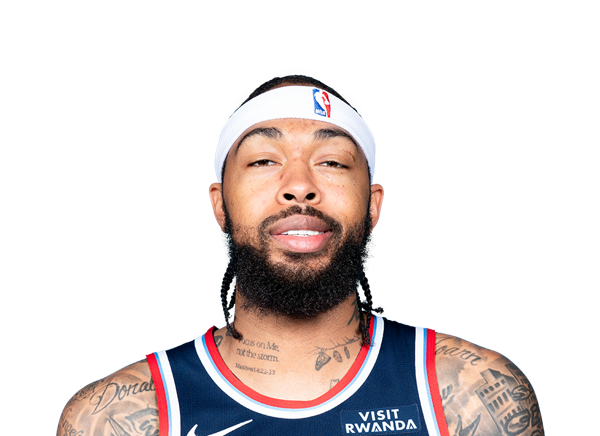 Brandon IngramF #7
 Brook LopezC #11
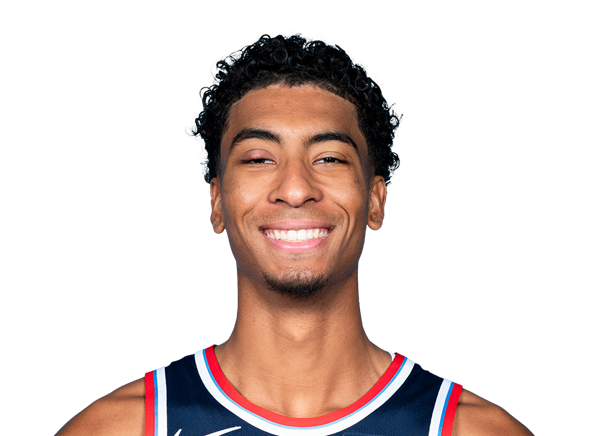 Cam ChristieG #24
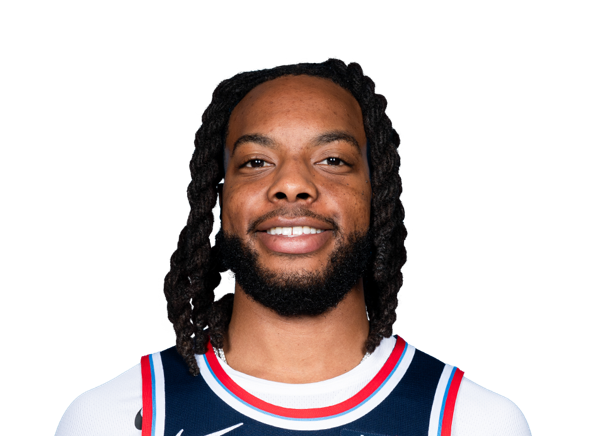 Darius GarlandG #10
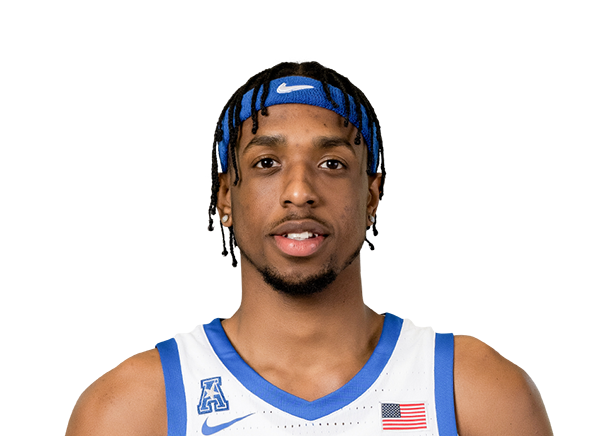 DeAndre WilliamsF
 Derrick Jones Jr.F #5
 Fletcher LoyerG #26
 Isaiah JacksonF #23
 Jahmyl TelfortF #19
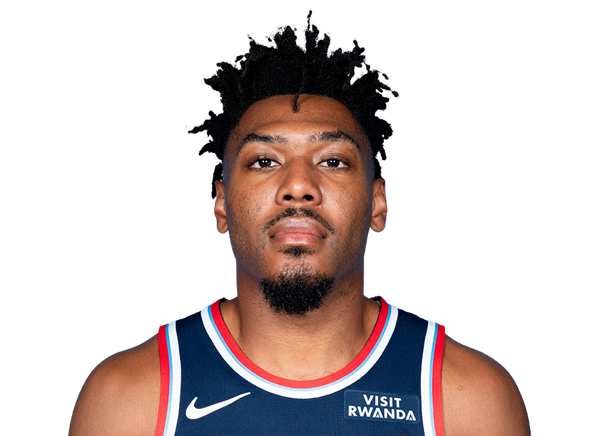 Jalen PickettG #21
 Jordan MillerG #22
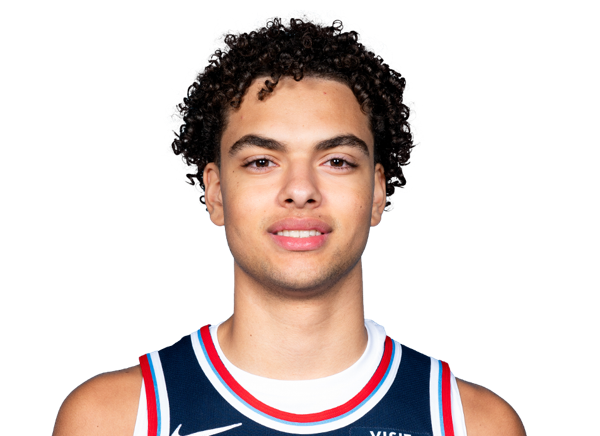 Keaton WaglerG #1
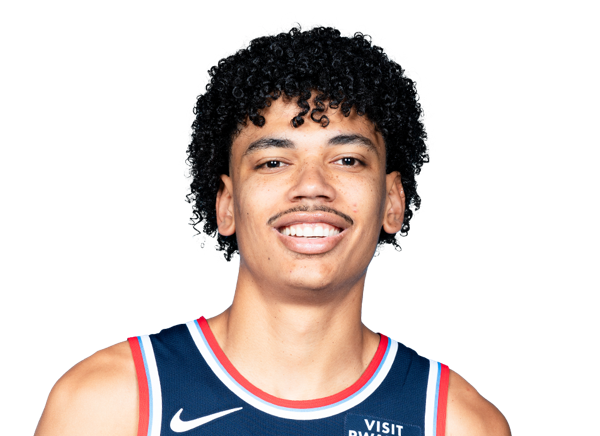 Kobe SandersG #4
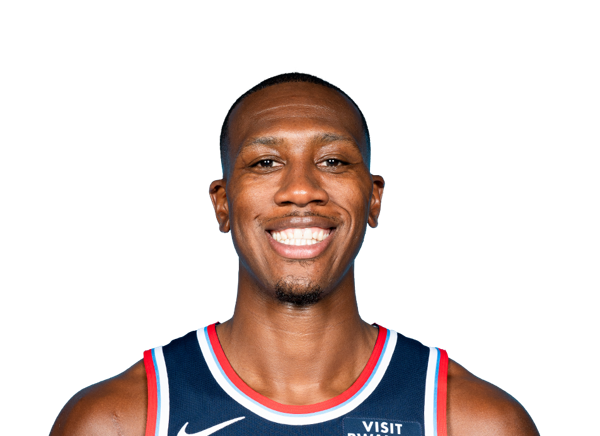 Kris DunnG #8
 Max StrusG #31
 Nick MartinelliF #12
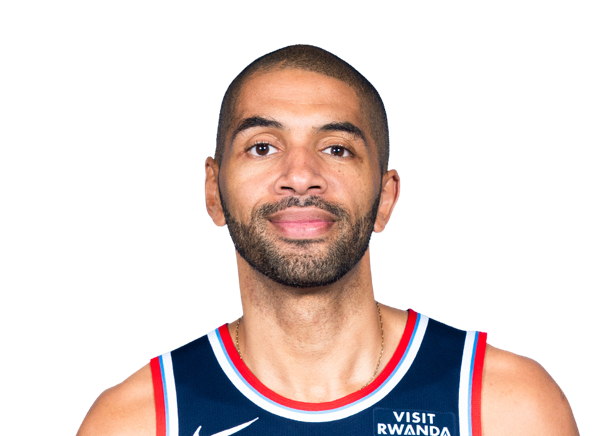 Nicolas BatumF #33
 Rui HachimuraF #28
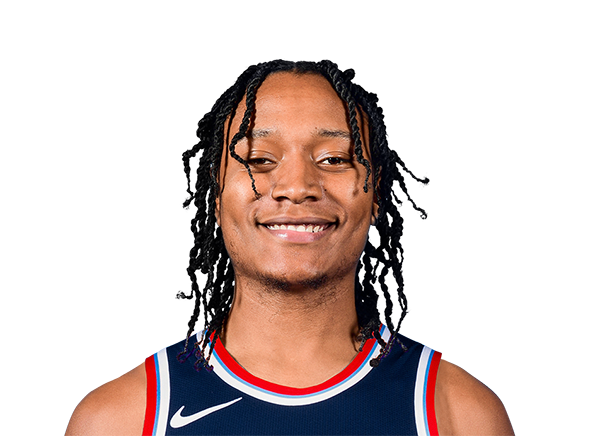 TyTy Washington Jr.G #15
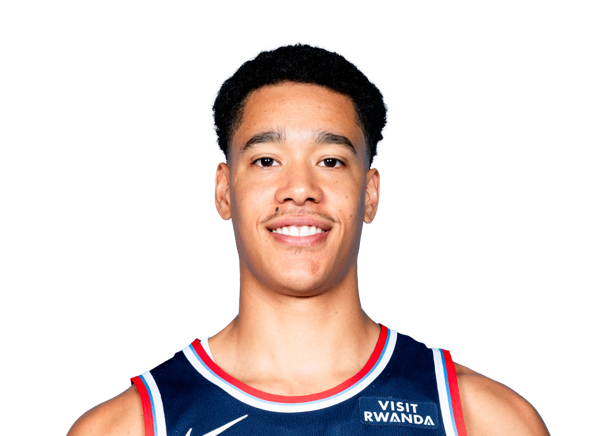 Yanic Konan NiederhauserC #14
 Yuki KawamuraG #17