

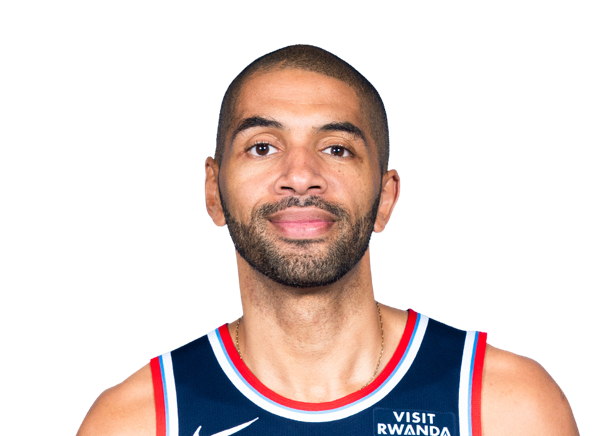
BALLERSCULTURE PLAYER PROFILE · 2026-27
Nicolas Batum
LA Clippers · F • #33 • 6' 7" 230 lbs

01 / 2026-27 PER-GAME AVERAGES
Season snapshot
No regular-season 2026-27 statistics are recorded for this player. Career history is shown further down.
02 / EVERY SEASON SINCE 2022-23, SIDE BY SIDE
2022-23 to 2026-27
Per game
| Season | Team | GP | GS | MIN | PTS | REB | AST | STL | BLK | TO | FG% | 3P% | FT% |
|---|---|---|---|---|---|---|---|---|---|---|---|---|---|
| 2022-23 | La Clippers | 78 | 19 | 21.9 | 6.1 | 3.8 | 1.6 | 0.7 | 0.6 | 0.6 | 42.0 | 39.1 | 70.8 |
| 2023-24 | La Clippers | 60 | 38 | 25.5 | 5.3 | 4.1 | 2.1 | 0.8 | 0.6 | 0.7 | 45.3 | 39.5 | 71.4 |
| 2024-25 | La Clippers | 78 | 8 | 17.5 | 4.0 | 2.8 | 1.1 | 0.7 | 0.5 | 0.4 | 43.7 | 43.3 | 81.0 |
| 2025-26 | La Clippers | 74 | 6 | 17.5 | 4.0 | 2.5 | 0.9 | 0.6 | 0.3 | 0.5 | 40.3 | 40.4 | 81.8 |
| 2026-27 | — | — | — | — | — | — | — | — | — | — | — | — | — |
Season totals
| Season | Team | GP | GS | MIN | PTS | REB | AST | STL | BLK | TO | FG% | 3P% | FT% |
|---|---|---|---|---|---|---|---|---|---|---|---|---|---|
| 2022-23 | La Clippers | — | — | — | 478 | 299 | 121 | 54 | 44 | 50 | 42.0 | 39.1 | 70.8 |
| 2023-24 | La Clippers | — | — | — | 8 | 7 | 5 | 3 | 4 | 1 | 37.5 | 28.6 | 0.0 |
| 2024-25 | La Clippers | — | — | — | 313 | 218 | 84 | 52 | 36 | 34 | 43.7 | 43.3 | 81.0 |
| 2025-26 | La Clippers | — | — | — | 293 | 184 | 64 | 47 | 23 | 37 | 40.3 | 40.4 | 81.8 |
| 2026-27 | — | — | — | — | — | — | — | — | — | — | — | — | — |
Click a season to open this player’s full game log, splits and advanced stats for that year; click a team to open its page. A dash means no NBA games were recorded.
03 / SEASON-BY-SEASON HISTORY
Career statistics
Regular Season Averages
| Season | Team | GP | GS | MIN | FG | FG% | 3PT | 3P% | FT | FT% | OR | DR | REB | AST | BLK | STL | PF | TO | PTS |
|---|---|---|---|---|---|---|---|---|---|---|---|---|---|---|---|---|---|---|---|
| 2008-09 | Portland Trail Blazers | 79 | 76 | 18.4 | 2.0-4.6 | 44.6 | 0.8-2.1 | 36.9 | 0.5-0.7 | 80.8 | 1.1 | 1.7 | 2.8 | 0.9 | 0.5 | 0.6 | 1.8 | 0.6 | 5.4 |
| 2009-10 | Portland Trail Blazers | 37 | 25 | 24.8 | 3.8-7.2 | 51.9 | 1.5-3.6 | 40.9 | 1.2-1.4 | 84.3 | 0.9 | 2.9 | 3.8 | 1.2 | 0.7 | 0.6 | 2.2 | 0.7 | 10.1 |
| 2010-11 | Portland Trail Blazers | 80 | 67 | 31.5 | 4.6-10.1 | 45.5 | 1.5-4.3 | 34.5 | 1.7-2.1 | 84.1 | 1.4 | 3.2 | 4.5 | 1.5 | 0.6 | 0.9 | 2.4 | 1.0 | 12.4 |
| 2011-12 | Portland Trail Blazers | 59 | 34 | 30.4 | 4.9-10.9 | 45.1 | 1.8-4.6 | 39.1 | 2.3-2.7 | 83.6 | 1.4 | 3.2 | 4.6 | 1.4 | 1.0 | 1.0 | 1.8 | 1.5 | 13.9 |
| 2012-13 | Portland Trail Blazers | 73 | 73 | 38.5 | 4.8-11.4 | 42.3 | 2.3-6.1 | 37.2 | 2.4-2.9 | 84.8 | 1.3 | 4.3 | 5.6 | 4.9 | 1.1 | 1.2 | 1.9 | 2.6 | 14.3 |
| 2013-14 | Portland Trail Blazers | 82 | 82 | 36.0 | 4.6-10.0 | 46.5 | 1.8-4.9 | 36.1 | 2.0-2.5 | 80.3 | 1.4 | 6.0 | 7.5 | 5.1 | 0.7 | 0.9 | 1.9 | 2.5 | 13.0 |
| 2014-15 | Portland Trail Blazers | 71 | 71 | 33.5 | 3.4-8.5 | 40.0 | 1.4-4.4 | 32.4 | 1.2-1.4 | 85.7 | 0.9 | 5.0 | 5.9 | 4.8 | 0.6 | 1.1 | 1.5 | 1.9 | 9.4 |
| 2015-16 | Charlotte Hornets | 70 | 70 | 35.0 | 5.3-12.5 | 42.6 | 2.0-5.7 | 34.8 | 2.3-2.7 | 84.9 | 0.8 | 5.3 | 6.1 | 5.8 | 0.6 | 0.9 | 1.6 | 2.9 | 14.9 |
| 2016-17 | Charlotte Hornets | 77 | 77 | 34.0 | 5.1-12.7 | 40.3 | 1.8-5.3 | 33.3 | 3.2-3.7 | 85.6 | 0.6 | 5.6 | 6.2 | 5.9 | 0.4 | 1.1 | 1.4 | 2.5 | 15.1 |
| 2017-18 | Charlotte Hornets | 64 | 64 | 31.0 | 4.2-10.2 | 41.5 | 1.4-4.3 | 33.6 | 1.7-2.0 | 83.1 | 0.9 | 3.9 | 4.8 | 5.5 | 0.4 | 1.0 | 1.1 | 2.0 | 11.6 |
| 2018-19 | Charlotte Hornets | 75 | 72 | 31.4 | 3.4-7.5 | 45.0 | 1.5-4.0 | 38.9 | 1.0-1.2 | 86.5 | 0.9 | 4.3 | 5.2 | 3.3 | 0.6 | 0.9 | 1.9 | 1.6 | 9.3 |
| 2019-20 | Charlotte Hornets | 22 | 3 | 23.0 | 1.3-3.7 | 34.6 | 0.6-2.2 | 28.6 | 0.4-0.5 | 90.0 | 1.1 | 3.4 | 4.5 | 3.0 | 0.4 | 0.8 | 1.9 | 1.0 | 3.6 |
| 2020-21 | La Clippers | 67 | 38 | 27.4 | 2.9-6.1 | 46.4 | 1.6-4.1 | 40.4 | 0.7-0.9 | 82.8 | 0.7 | 4.0 | 4.7 | 2.2 | 0.6 | 1.0 | 1.5 | 0.8 | 8.1 |
| 2021-22 | La Clippers | 59 | 54 | 24.8 | 3.0-6.6 | 46.3 | 1.8-4.6 | 40.0 | 0.4-0.6 | 65.8 | 0.5 | 3.8 | 4.3 | 1.7 | 0.7 | 1.0 | 1.4 | 0.7 | 8.3 |
| 2022-23 | La Clippers | 78 | 19 | 21.9 | 2.1-4.9 | 42.0 | 1.6-4.1 | 39.1 | 0.4-0.6 | 70.8 | 0.8 | 3.0 | 3.8 | 1.6 | 0.6 | 0.7 | 1.9 | 0.6 | 6.1 |
| 2023-24 | La Clippers | 3 | 0 | 18.0 | 1.0-2.7 | 37.5 | 0.7-2.3 | 28.6 | 0.0-0.0 | 0.0 | 0.0 | 2.3 | 2.3 | 1.7 | 1.3 | 1.0 | 1.7 | 0.3 | 2.7 |
| 2023-24 | Philadelphia 76ers | 57 | 38 | 25.9 | 2.0-4.4 | 45.6 | 1.2-3.1 | 39.9 | 0.3-0.4 | 71.4 | 1.2 | 3.0 | 4.2 | 2.2 | 0.6 | 0.8 | 1.8 | 0.7 | 5.5 |
| 2023-24 | 2023 24 Totals | 60 | 38 | 25.5 | 1.9-4.3 | 45.3 | 1.2-3.1 | 39.5 | 0.3-0.4 | 71.4 | 1.2 | 3.0 | 4.1 | 2.1 | 0.6 | 0.8 | 1.8 | 0.7 | 5.3 |
| 2024-25 | La Clippers | 78 | 8 | 17.5 | 1.3-3.1 | 43.7 | 1.1-2.6 | 43.3 | 0.2-0.3 | 81.0 | 0.6 | 2.2 | 2.8 | 1.1 | 0.5 | 0.7 | 1.4 | 0.4 | 4.0 |
| 2025-26 | La Clippers | 74 | 6 | 17.5 | 1.3-3.2 | 40.3 | 1.2-3.1 | 40.4 | 0.1-0.1 | 81.8 | 0.3 | 2.2 | 2.5 | 0.9 | 0.3 | 0.6 | 1.4 | 0.5 | 4.0 |
| Career | — | 1205 | 877 | 28.2 | 3.4-7.8 | 43.6 | 1.5-4.1 | 37.1 | 1.3-1.5 | 83.1 | 0.9 | 3.8 | 4.7 | 3.0 | 0.6 | 0.9 | 1.7 | 1.4 | 9.6 |
Regular Season Totals
| Season | Team | FG | FG% | 3PT | 3P% | FT | FT% | OR | DR | REB | AST | BLK | STL | PF | TO | PTS |
|---|---|---|---|---|---|---|---|---|---|---|---|---|---|---|---|---|
| 2008-09 | Portland Trail Blazers | 161-361 | 44.6 | 62-168 | 36.9 | 42-52 | 80.8 | 84 | 136 | 220 | 74 | 40 | 50 | 139 | 50 | 426 |
| 2009-10 | Portland Trail Blazers | 139-268 | 51.9 | 54-132 | 40.9 | 43-51 | 84.3 | 32 | 109 | 141 | 44 | 25 | 24 | 83 | 27 | 375 |
| 2010-11 | Portland Trail Blazers | 367-807 | 45.5 | 118-342 | 34.5 | 138-164 | 84.1 | 109 | 252 | 361 | 123 | 49 | 68 | 194 | 83 | 990 |
| 2011-12 | Portland Trail Blazers | 289-641 | 45.1 | 107-274 | 39.1 | 133-159 | 83.6 | 81 | 190 | 271 | 84 | 60 | 57 | 105 | 90 | 818 |
| 2012-13 | Portland Trail Blazers | 352-833 | 42.3 | 165-444 | 37.2 | 178-210 | 84.8 | 97 | 315 | 412 | 360 | 83 | 91 | 139 | 190 | 1047 |
| 2013-14 | Portland Trail Blazers | 381-819 | 46.5 | 145-402 | 36.1 | 163-203 | 80.3 | 116 | 495 | 611 | 420 | 57 | 75 | 156 | 208 | 1070 |
| 2014-15 | Portland Trail Blazers | 240-600 | 40.0 | 100-309 | 32.4 | 84-98 | 85.7 | 62 | 354 | 416 | 341 | 40 | 78 | 106 | 132 | 664 |
| 2015-16 | Charlotte Hornets | 372-873 | 42.6 | 139-399 | 34.8 | 163-192 | 84.9 | 55 | 373 | 428 | 403 | 43 | 65 | 114 | 205 | 1046 |
| 2016-17 | Charlotte Hornets | 393-975 | 40.3 | 135-405 | 33.3 | 243-284 | 85.6 | 46 | 435 | 481 | 456 | 29 | 86 | 109 | 194 | 1164 |
| 2017-18 | Charlotte Hornets | 270-650 | 41.5 | 92-274 | 33.6 | 108-130 | 83.1 | 57 | 249 | 306 | 349 | 23 | 65 | 72 | 131 | 740 |
| 2018-19 | Charlotte Hornets | 253-562 | 45.0 | 116-298 | 38.9 | 77-89 | 86.5 | 71 | 319 | 390 | 247 | 43 | 71 | 140 | 117 | 699 |
| 2019-20 | Charlotte Hornets | 28-81 | 34.6 | 14-49 | 28.6 | 9-10 | 90.0 | 25 | 75 | 100 | 66 | 8 | 17 | 41 | 22 | 79 |
| 2020-21 | La Clippers | 191-412 | 46.4 | 110-272 | 40.4 | 48-58 | 82.8 | 50 | 266 | 316 | 148 | 37 | 69 | 102 | 53 | 540 |
| 2021-22 | La Clippers | 179-387 | 46.3 | 108-270 | 40.0 | 25-38 | 65.8 | 29 | 225 | 254 | 100 | 42 | 58 | 80 | 40 | 491 |
| 2022-23 | La Clippers | 160-381 | 42.0 | 124-317 | 39.1 | 34-48 | 70.8 | 62 | 237 | 299 | 121 | 44 | 54 | 149 | 50 | 478 |
| 2023-24 | La Clippers | 3-8 | 37.5 | 2-7 | 28.6 | 0-0 | 0.0 | 0 | 7 | 7 | 5 | 4 | 3 | 5 | 1 | 8 |
| 2023-24 | Philadelphia 76ers | 113-248 | 45.6 | 71-178 | 39.9 | 15-21 | 71.4 | 70 | 171 | 241 | 123 | 34 | 45 | 104 | 39 | 312 |
| 2023-24 | 2023 24 Totals | 116-256 | 45.3 | 73-185 | 39.5 | 15-21 | 71.4 | 70 | 178 | 248 | 128 | 38 | 48 | 109 | 40 | 320 |
| 2024-25 | La Clippers | 104-238 | 43.7 | 88-203 | 43.3 | 17-21 | 81.0 | 47 | 171 | 218 | 84 | 36 | 52 | 111 | 34 | 313 |
| 2025-26 | La Clippers | 96-238 | 40.3 | 92-228 | 40.4 | 9-11 | 81.8 | 23 | 161 | 184 | 64 | 23 | 47 | 100 | 37 | 293 |
| Career | — | 4091-9382 | 43.6 | 1842-4971 | 37.1 | 1529-1839 | 83.1 | 1116 | 4540 | 5656 | 3612 | 720 | 1075 | 2049 | 1703 | 11553 |
Regular Season Misc Totals
| Season | Team | DD2 | TD3 | DQ | EJECT | TECH | FLAG | AST/TO | STL/TO | SC-EFF | SH-EFF |
|---|---|---|---|---|---|---|---|---|---|---|---|
| 2008-09 | Portland Trail Blazers | 0 | 0 | 0 | 0 | 0 | 0 | 1.5 | 1.0 | 1.180 | 0.53 |
| 2009-10 | Portland Trail Blazers | 1 | 0 | 1 | 0 | 0 | 0 | 1.6 | 0.9 | 1.399 | 0.62 |
| 2010-11 | Portland Trail Blazers | 6 | 0 | 2 | 0 | 2 | 0 | 1.5 | 0.8 | 1.227 | 0.53 |
| 2011-12 | Portland Trail Blazers | 2 | 0 | 0 | 0 | 0 | 0 | 0.9 | 0.6 | 1.276 | 0.53 |
| 2012-13 | Portland Trail Blazers | 7 | 2 | 0 | 0 | 1 | 1 | 1.9 | 0.5 | 1.257 | 0.52 |
| 2013-14 | Portland Trail Blazers | 16 | 2 | 1 | 0 | 1 | 0 | 2.0 | 0.4 | 1.306 | 0.55 |
| 2014-15 | Portland Trail Blazers | 5 | 0 | 0 | 0 | 1 | 0 | 2.6 | 0.6 | 1.107 | 0.48 |
| 2015-16 | Charlotte Hornets | 11 | 2 | 0 | 0 | 3 | 0 | 2.0 | 0.3 | 1.198 | 0.51 |
| 2016-17 | Charlotte Hornets | 15 | 1 | 0 | 0 | 0 | 0 | 2.4 | 0.4 | 1.194 | 0.47 |
| 2017-18 | Charlotte Hornets | 7 | 2 | 0 | 0 | 0 | 0 | 2.7 | 0.5 | 1.138 | 0.49 |
| 2018-19 | Charlotte Hornets | 0 | 0 | 0 | 0 | 1 | 1 | 2.1 | 0.6 | 1.244 | 0.55 |
| 2019-20 | Charlotte Hornets | 0 | 0 | 0 | 0 | 0 | 1 | 3.0 | 0.8 | 0.975 | 0.43 |
| 2020-21 | La Clippers | 1 | 0 | 0 | 0 | 0 | 0 | 2.8 | 1.3 | 1.311 | 0.60 |
| 2021-22 | La Clippers | 0 | 0 | 0 | 0 | 0 | 0 | 2.5 | 1.5 | 1.269 | 0.60 |
| 2022-23 | La Clippers | 0 | 0 | 1 | 0 | 0 | 0 | 2.4 | 1.1 | 1.255 | 0.58 |
| 2023-24 | La Clippers | 0 | 0 | 0 | 0 | 0 | 0 | 5.0 | 3.0 | 1.000 | 0.50 |
| 2023-24 | Philadelphia 76ers | 0 | 0 | 0 | 0 | 0 | 0 | 3.2 | 1.2 | 1.258 | 0.60 |
| 2023-24 | 2023 24 Totals | 0 | 0 | 0 | 0 | 0 | 0 | 3.2 | 1.2 | 1.250 | 0.60 |
| 2024-25 | La Clippers | 0 | 0 | 0 | 0 | 0 | 0 | 2.5 | 1.5 | 1.315 | 0.62 |
| 2025-26 | La Clippers | 0 | 0 | 0 | 0 | 0 | 0 | 1.7 | 1.3 | 1.231 | 0.60 |
| Career | — | 71 | 9 | 5 | 0 | 9 | 3 | 2.1 | 0.6 | 1.231 | 0.53 |
Scoring, rebounding and assist trend
04 / SHOT CHART AND ZONE SHOOTING
Shot profile
Shot-location data is not connected. Add a BALLDONTLIE GOAT-tier NBA API key in NBA Players → Settings to enable shot charts and zone shooting.
05 / RECORD, TEAM STATS AND TEAMMATES
Team
Overall4-8
Home4-3
Road0-5
DIV1-4
CONF3-6
Last Ten Games3-7
Team records for 2026-27 (regular season).
Team statistics 2026-27
Defensive
| Metric | Total | Per game | NBA rank |
|---|---|---|---|
| Blocks | 52 | 4.333 | 4th |
| Defensive Rebounds | 361 | 30.083 | 5th |
| Steals | 112 | 9.333 | Tied-2nd |
| Points Conceded Off Turnovers | 0 | 22 | — |
| Defensive Rebound Rate | 0.0 | — | — |
| Defensive Rebounds Per Game | 30.1 | — | — |
| Blocks Per Game | 4.3 | — | — |
| Steals Per Game | 9.3 | — | — |
| Defensive Rebounds Per 48 | 0.0 | — | — |
| Blocks Per 48 | 0.0 | — | — |
| Steals Per 48 | 0.0 | — | — |
General
| Metric | Total | Per game | NBA rank |
|---|---|---|---|
| Disqualifications | 2 | — | Tied-1st |
| Flagrant Fouls | 2 | 0.167 | Tied-2nd |
| Fouls | 263 | 21.917 | 5th |
| Rebound Rate | 47.9 | — | 4th |
| Ejections | 0 | — | — |
| Technical Fouls | 6 | 0.25 | Tied-4th |
| Rebounds | 482 | 40.166 | — |
| Minutes | 0 | — | — |
| Minutes Per Game | 0.0 | — | — |
| Fantasy Rating | 0.0 | — | — |
| Rating | 205.2 | — | 1st |
| Plus-Minus | -1 | -1 | Tied-1st |
| Game Day of Year | 0 | — | — |
| Rebounds Per Game | 40.2 | — | — |
| Fouls Per Game | 21.9 | — | — |
| Flagrant Fouls Per Game | 0.2 | — | — |
| Technical Fouls Per Game | 0.5 | — | — |
| Ejections Per Game | 0.0 | — | — |
| Disqualifications Per Game | 0.2 | — | — |
| Assist To Turnover Ratio | 1.6 | 1.587 | — |
| Steal To Foul Ratio | 0.4 | 0.426 | — |
| Block To Foul Ratio | 0.2 | 0.198 | — |
| Team Rebounds Per Game | 0.0 | — | — |
| Rebounds | 482 | 40.166 | — |
| Total Technical Fouls | 6 | 0.25 | — |
| Assist To Turnover Ratio | 46.7 | — | — |
| Team Rebounds | 0 | — | — |
| Steal To Turnover Ratio | 0.5 | 0.544 | — |
| Rebounds Per 48 Minutes | 0.0 | — | — |
| Fouls Per 48 Minutes | 0.0 | — | — |
| Flagrant Fouls Per 48 Minutes | 0.0 | — | — |
| Technical Fouls Per 48 Minutes | 0.0 | — | — |
| Ejections Per 48 Minutes | 0.0 | — | — |
| Disqualifications Per 48 Minutes | 0.0 | — | — |
| Games Played | 12 | — | 5th |
| Games Started | 0 | — | — |
| Double Double | 0 | — | — |
| Triple Double | 0 | — | — |
Offensive
| Metric | Total | Per game | NBA rank |
|---|---|---|---|
| Assists | 327 | 27.25 | Tied-4th |
| Effective Field Goal Percentage | 55.1 | — | 2nd |
| Field Goals | 472/1013 | 0.466 | — |
| Field Goals Attempted | 1013 | 84.417 | 5th |
| Field Goals Made | 472 | 39.333 | 5th |
| Field Goal Percentage | 46.6 | 0.466 | 3rd |
| Free Throws | 231/293 | 0.788 | — |
| Free Throw Percentage | 78.8 | 0.788 | 3rd |
| Free Throws Attempted | 293 | 24.417 | 3rd |
| Free Throws Made | 231 | 19.25 | 3rd |
| Offensive Rebounds | 121 | 10.083 | 5th |
| Points | 1348 | 112.333 | 5th |
| Turnovers | 206 | 17.167 | 4th |
| 3-Point Field Goal Percentage | 39.1 | 0.391 | 1st |
| 3-Point Field Goals Attempted | 442 | 36.833 | 5th |
| 3-Point Field Goals Made | 173 | 14.417 | 4th |
| True Shooting Percentage | 59.0 | — | 2nd |
| Team Turnovers | 7 | — | 5th |
| Total Turnovers | 213 | 17.167 | — |
| Assist Ratio | 19.4 | — | 2nd |
| Points in the Paint | 538 | 44 | 5th |
| Offensive Rebound Rate | 24.2 | — | 4th |
| Turnover Ratio | 15.7 | — | 1st |
| Fast Break Points | 183 | — | — |
| Possessions | 1234 | — | 5th |
| Pace Factor | 102.0 | — | 3rd |
| Average Field Goals Made | 39.3 | — | — |
| Average Field Goals Attempted | 84.4 | — | — |
| Average 3-Point Field Goals Made | 14.4 | — | — |
| Average 3-Point Field Goals Attempted | 36.8 | — | — |
| Average Free Throws Made | 19.3 | — | — |
| Average Free Throws Attempted | 24.4 | — | — |
| Points Per Game | 112.3 | — | — |
| Offensive Rebounds Per Game | 10.1 | — | — |
| Assists Per Game | 27.3 | — | — |
| Turnovers Per Game | 17.2 | — | — |
| Offensive Rebound Percentage | 0.2 | 0.224 | — |
| Estimated Possessions | 1222.2 | 101.268 | — |
| Estimated Possessions Per Game | 101.9 | — | — |
| Points Per Estimated Possession | 1.1 | 1.109 | — |
| Team Turnovers Per Game | 0.6 | — | — |
| Total Turnovers Per Game | 17.7 | — | — |
| 3-Point Field Goal Percentage | 39.1 | 0.391 | — |
| 2-Point Field Goals Made | 299.0 | 24.916 | 1st |
| 2-Point Field Goals Attempted | 571.0 | 47.584 | — |
| 2-Point Field Goals Made per Game | 24.9 | — | — |
| 2-Point Field Goals Attempted per Game | 47.6 | — | — |
| 2-Point Field Goal Percentage | 52.4 | 0.524 | — |
| Shooting Efficiency | 0.55 | 0.551 | — |
| Scoring Efficiency | 1.331 | 1.331 | — |
| Fieldgoals Made Per 48 | 0.0 | — | — |
| Fieldgoals Attempted Per 48 | 0.0 | — | — |
| 3-Point Fieldgoals Made Per 48 | 0.0 | — | — |
| 3-Point Fieldgoals Attempted Per 48 | 0.0 | — | — |
| Freethrows Made Per 48 | 0.0 | — | — |
| Freethrows Attempted Per 48 | 0.0 | — | — |
| Points Scored Per 48 | 0.0 | — | — |
| Offensive Rebounds Per 48 | 0.0 | — | — |
| Assists Per 48 | 0.0 | — | — |
| Turnovers | 0.0 | — | — |
Teammates
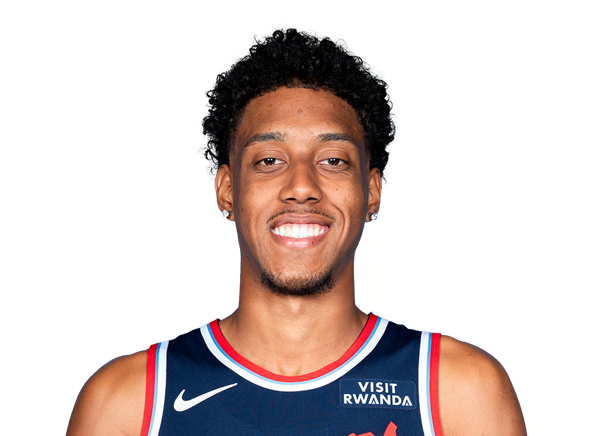 Baba MillerF #18
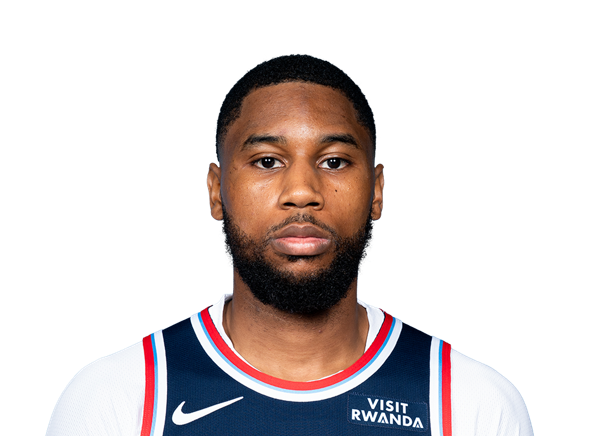 Blake WesleyG #20
 Bradley BealG #3
 Brandon IngramF #7
 Brook LopezC #11
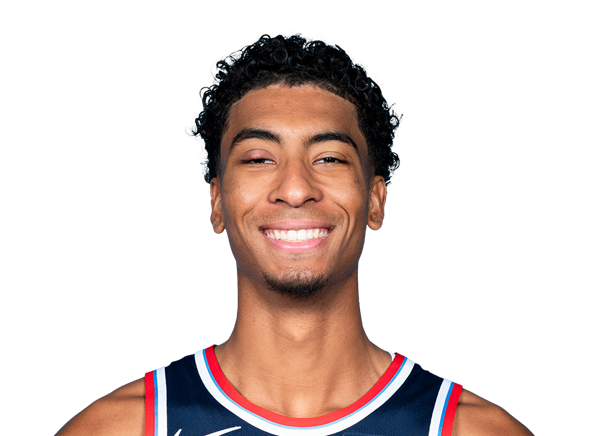 Cam ChristieG #24
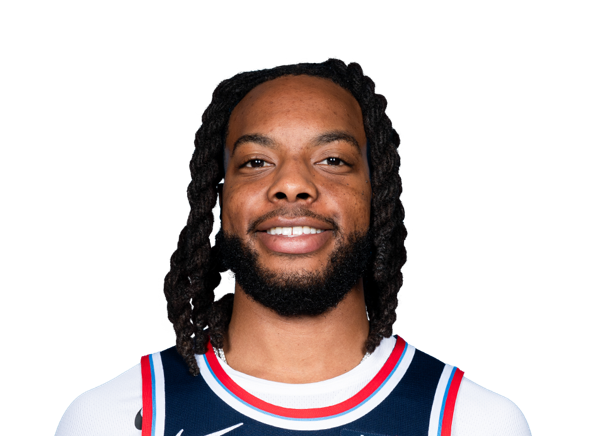 Darius GarlandG #10
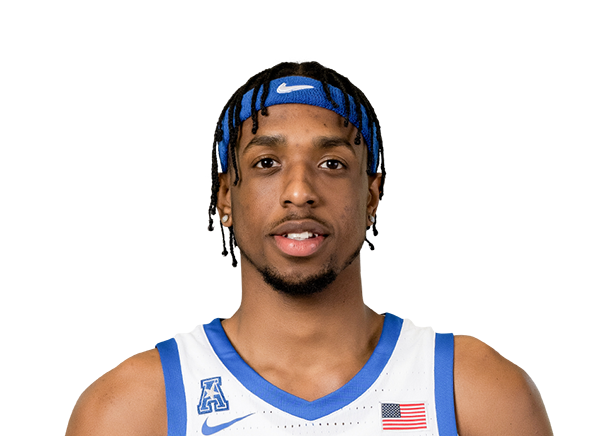 DeAndre WilliamsF
 Derrick Jones Jr.F #5
 Fletcher LoyerG #26
 Gradey DickG #9
 Isaiah JacksonF #23
 Jahmyl TelfortF #19
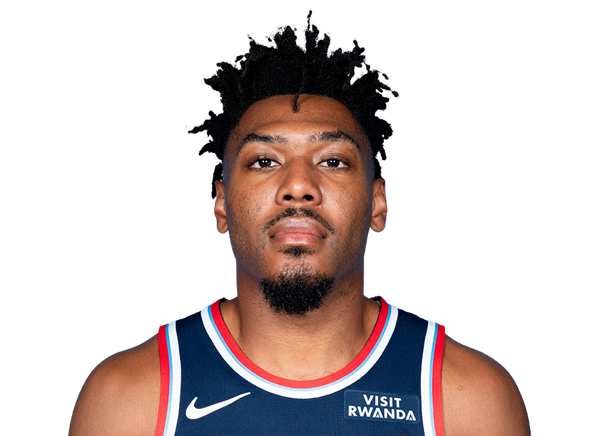 Jalen PickettG #21
 Jordan MillerG #22
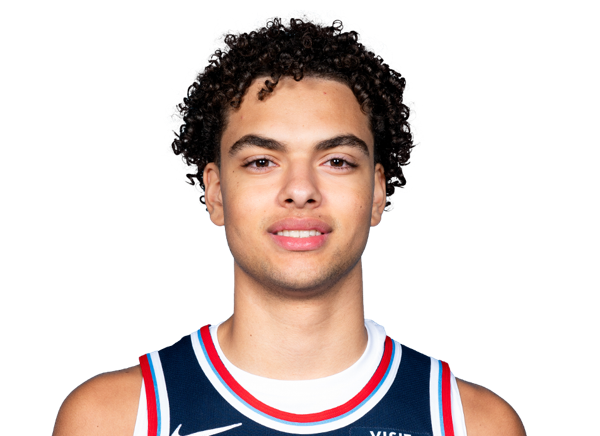 Keaton WaglerG #1
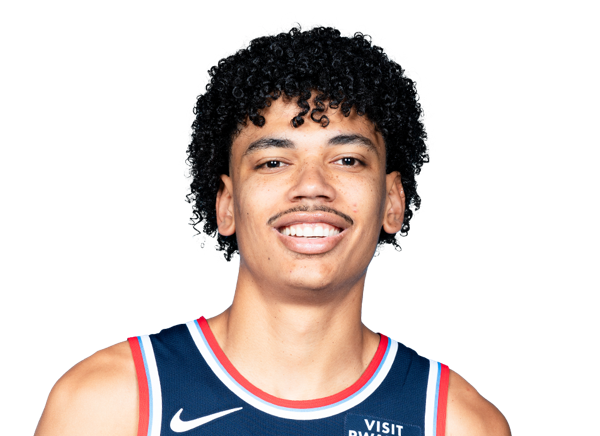 Kobe SandersG #4
 Kris DunnG #8
 Max StrusG #31
 Nick MartinelliF #12
 Rui HachimuraF #28
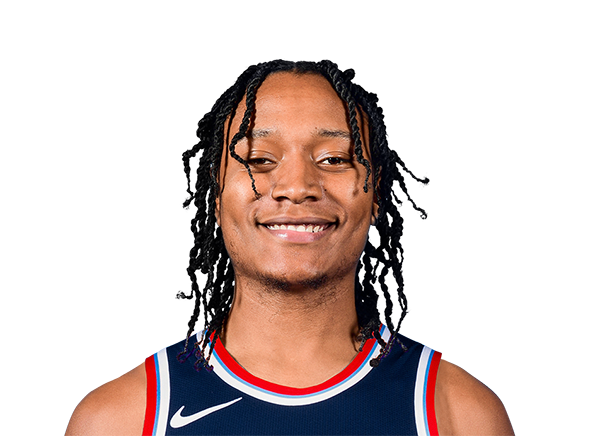 TyTy Washington Jr.G #15
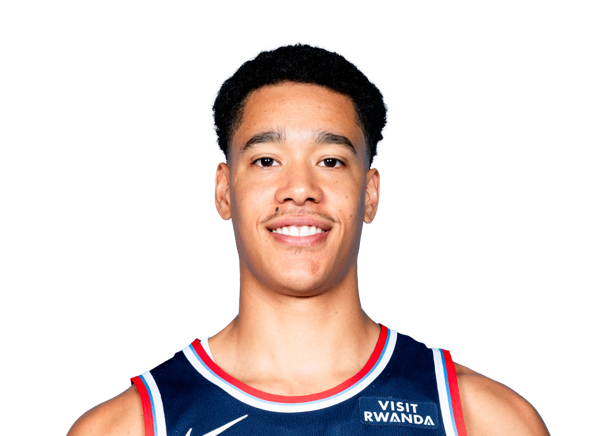 Yanic Konan NiederhauserC #14
 Yuki KawamuraG #17
06 / SALARY BY SEASON
Contract
| Season | Salary |
|---|---|
| 2015-16 | $13.13M |
| 2016-17 | $20.87M |
| 2017-18 | $24M |
| 2018-19 | $24M |
| 2019-20 | $25.57M |
| 2020-21 | $1.62M |
| 2021-22 | $3.17M |
| 2022-23 | $10.84M |
| 2023-24 | $11.71M |
| 2024-25 | $4.67M |
| 2025-26 | $5.6M |
| 2026-27 | $5.88M |
Total listed: $151.06M · source: espn.
07 / LATEST REPORT
Injury status
No current injury report entry for this player.
08 / SIGNINGS, TRADES AND ROSTER MOVES
Transactions
No recorded transactions for this player.
09 / LATEST COVERAGE
Player news
LATEST UPDATEBatum announced his retirement from the NBA on Monday.
The 37-year-old concludes an 18-season NBA career that included stints with Portland, Charlotte, Philadelphia and the Clippers. Batum appeared in 1,205 regular-season games during his career, averaging 9.6 points, 4.7 rebounds and 3.0 assists per contest.
22 September 2026Nicolas Batum announces retirement after 18 NBA seasons↗
30 June 2026Beal opts for free agency; Brook Lopez back with Clippers↗
14 February 2026Which NBA players have played the most seasons?↗
1 July 2025Sources: Nicolas Batum returning to Clippers after opt out↗
30 June 2025Sources: Nicolas Batum opts out; interest in Clippers return↗
6 May 2025Clippers still building around Kawhi Leonard, James Harden↗
10 / BIO, DRAFT AND CONTACT DETAILS
Biography & profile
TeamLA Clippers
PositionForward
Jersey33
Height6' 7"
Weight230 lbs
Age37
StatusInactive