Click a season to open this player’s full game log, splits and advanced stats for that year; click a team to open its page. A dash means no NBA games were recorded.
03 / EVERY CATEGORY THE PROVIDER REPORTS
Full statistical breakdown
Regular season 2026-27
Defensive
Metric
Total
NBA rank
Blocks
12
Tied-36th
Defensive Rebounds
34
Tied-153rd
Steals
11
Tied-115th
Defensive Rebound Rate
0.0
—
Defensive Rebounds Per Game
3.1
Tied-124th
Blocks Per Game
1.1
Tied-21st
Steals Per Game
1.0
81st
Defensive Rebounds Per 48
5.2
3,672nd
Blocks Per 48
1.8
864th
Steals Per 48
1.7
2,760th
General
Metric
Total
NBA rank
Disqualifications
0
Tied-22nd
Flagrant Fouls
0
Tied-24th
Fouls
20
Tied-225th
Player Efficiency Rating
14.87
139th
Rebound Rate
0.0
—
Ejections
0
Tied-7th
Technical Fouls
0
Tied-104th
Rebounds
53
—
Value Over Replacement Player
0.0
—
Minutes
316
Tied-2nd
Minutes Per Game
28.7
—
Rating
22.0
Tied-68th
Plus-Minus
-56
Tied-1st
Rebounds Per Game
4.8
100th
Fouls Per Game
1.8
Tied-192nd
Flagrant Fouls Per Game
0.0
Tied-21st
Technical Fouls Per Game
0.0
Tied-84th
Ejections Per Game
0.0
Tied-6th
Disqualifications Per Game
0.0
Tied-21st
Assist To Turnover Ratio
1.0
—
Steal To Foul Ratio
0.6
—
Block To Foul Ratio
0.6
—
Team Rebounds Per Game
0.0
—
Rebounds
53
—
Total Technical Fouls
0
—
Assist To Turnover Ratio
0.0
—
Steal To Turnover Ratio
0.8
—
Rebounds Per 48 Minutes
8.1
—
Fouls Per 48 Minutes
3.0
5,400th
Flagrant Fouls Per 48 Minutes
0.0
576th
Technical Fouls Per 48 Minutes
0.0
2,496th
Ejections Per 48 Minutes
0.0
168th
Disqualifications Per 48 Minutes
0.0
528th
R/40
6.7
—
Games Played
11
11th
Games Started
11
Tied-97th
Double Double
0
Tied-121st
Triple Double
0
Tied-13th
Offensive
Metric
Total
NBA rank
Assists
14
Tied-245th
Effective Field Goal Percentage
67.0
—
Field Goals
47/88
—
Field Goals Attempted
88
Tied-172nd
Field Goals Made
47
Tied-138th
Field Goal Percentage
53.4
16th
Free Throws
9/14
—
Free Throw Percentage
64.3
Tied-240th
Free Throws Attempted
14
Tied-228th
Free Throws Made
9
Tied-237th
Offensive Rebounds
19
Tied-76th
Points
127
Tied-146th
Turnovers
14
Tied-165th
3-Point Field Goal Percentage
52.2
Tied-14th
3-Point Field Goals Attempted
46
Tied-146th
3-Point Field Goals Made
24
Tied-79th
True Shooting Percentage
67.4
—
Total Turnovers
14
—
Assist Ratio
11.5
—
Points in the Paint
0
Tied-1st
Offensive Rebound Rate
0.0
—
Turnover Ratio
11.5
—
Brick Index
0.00
—
Usage Rate
0.0
—
Average Field Goals Made
4.3
111th
Average Field Goals Attempted
8.0
Tied-310th
Average 3-Point Field Goals Made
2.2
Tied-56th
Average 3-Point Field Goals Attempted
4.2
110th
Average Free Throws Made
0.8
—
Average Free Throws Attempted
1.3
Tied-196th
Points Per Game
11.5
Tied-114th
Offensive Rebounds Per Game
1.7
60th
Assists Per Game
1.3
213th
Turnovers Per Game
1.3
144th
Offensive Rebound Percentage
0.5
—
Estimated Possessions
88.6
—
Estimated Possessions Per Game
8.1
—
Points Per Estimated Possession
1.4
—
Team Turnovers Per Game
0.0
—
Total Turnovers Per Game
1.3
—
3-Point Field Goal Percentage
52.2
—
2-Point Field Goals Made
23.0
Tied-59th
2-Point Field Goals Attempted
42.0
Tied-26th
2-Point Field Goals Made per Game
2.1
—
2-Point Field Goals Attempted per Game
3.8
—
2-Point Field Goal Percentage
54.8
16th
Shooting Efficiency
0.67
—
Scoring Efficiency
1.443
—
Fieldgoals Made Per 48
7.1
3,312th
Fieldgoals Attempted Per 48
13.4
4,128th
3-Point Fieldgoals Made Per 48
3.6
1,896th
3-Point Fieldgoals Attempted Per 48
7.0
3,504th
Freethrows Made Per 48
1.4
5,688th
Freethrows Attempted Per 48
2.1
5,472nd
Points Scored Per 48
19.3
3,504th
Offensive Rebounds Per 48
2.9
1,824th
Assists Per 48
2.1
5,880th
Turnovers
2.1
3,960th
P/40
16.1
—
A/40
1.8
—
04 / EFFICIENCY, SHOOTING PROFILE, PER-36
Advanced metrics
True shooting %67.1%
Effective FG %67.5%
2-point FG %55.3%
3-point attempt rate52.5%
Free throw rate16.3%
Points per shot attempt1.44
% of points from 3s57.4%
Assist-to-turnover1.00
Points per 36 min14.4
Rebounds per 36 min6.0
Assists per 36 min1.6
Steals per 36 min1.25
Blocks per 36 min1.38
Turnovers per 36 min1.63
Stocks (STL + BLK) per game2.10
Pts + Reb + Ast per game17.6
Efficiency (EFF) per game14.2
Game Score per game (Hollinger)10.2
Minutes per game28.7
Calculated by BallersCulture from the supplied 2026-27 box-score totals using standard formulas (hover a tile to see the formula). Tracking-based metrics such as BPM, VORP, on/off and RAPTOR are not available from this data source.
05 / 11 GAMES IN 2026-27
Game log: Regular season
Date
Opp
Result
MIN
FG
FG%
3PT
3P%
FT
FT%
REB
AST
BLK
STL
PF
TO
PTS
Nov 16
vs CHA
W 113-105
26
5-5
100.0
3-3
100.0
0-0
0.0
4
1
1
0
2
3
13
Nov 14
vs OKC
W 113-112
29
5-10
50.0
4-7
57.1
0-0
0.0
5
0
4
1
3
1
14
Nov 11
@ PHX
L 133-110
24
4-8
50.0
2-5
40.0
1-2
50.0
3
0
1
2
0
1
11
Nov 9
vs NO
W 139-123
29
2-5
40.0
0-1
0.0
4-6
66.7
4
3
0
0
1
1
8
Nov 5
vs MIA
L 117-116 OT
37
5-11
45.5
2-5
40.0
0-0
0.0
8
1
3
1
4
1
12
Nov 2
@ GS
L 124-112
28
3-11
27.3
1-5
20.0
2-2
100.0
7
1
0
0
2
2
9
Oct 31
@ MIN
L 127-101
26
4-5
80.0
2-2
100.0
0-0
0.0
1
1
1
0
1
1
10
Oct 29
vs LAL
L 103-87
28
6-10
60.0
3-5
60.0
0-0
0.0
5
0
2
4
2
2
15
Oct 26
@ OKC
L 108-101
30
4-6
66.7
3-3
100.0
0-0
0.0
6
1
0
0
0
1
11
Oct 24
@ LAL
L 125-117
35
6-13
46.2
3-8
37.5
1-2
50.0
4
1
0
2
3
0
16
Oct 22
vs SAC
W 121-96
26
3-4
75.0
1-2
50.0
1-2
50.0
6
5
0
1
2
1
8
06 / 2026-27 HOME / AWAY, RESULTS, MONTHS AND OPPONENTS
Splits
split
Split
GP
MIN
FG
FG%
3PT
3P%
FT
FT%
OR
DR
REB
AST
BLK
STL
PF
TO
PTS
All Splits
11
28.7
4.3-8.0
53.4
2.2-4.2
52.2
0.8-1.3
64.3
1.7
3.1
4.8
1.3
1.1
1.0
1.8
1.3
11.5
Home
6
29.0
4.3-7.5
57.8
2.2-3.8
56.5
0.8-1.3
62.5
2.0
3.3
5.3
1.7
1.7
1.2
2.3
1.5
11.7
Road
5
28.6
4.2-8.6
48.8
2.2-4.6
47.8
0.8-1.2
66.7
1.4
2.8
4.2
0.8
0.4
0.8
1.2
1.0
11.4
vs. Division
5
28.0
4.4-9.2
47.8
2.0-5.0
40.0
1.0-1.6
62.5
2.4
2.6
5.0
1.4
0.6
1.8
1.8
1.2
11.8
vs. Conference
9
28.2
4.1-8.0
51.4
2.1-4.2
50.0
1.0-1.6
64.3
1.9
2.7
4.6
1.3
0.9
1.1
1.6
1.1
11.3
3+ Days Rest
2
27.0
2.5-4.5
55.6
0.5-1.5
33.3
2.5-4.0
62.5
2.5
2.5
5.0
4.0
0.0
0.5
1.5
1.0
8.0
Month
Split
GP
MIN
FG
FG%
3PT
3P%
FT
FT%
OR
DR
REB
AST
BLK
STL
PF
TO
PTS
October
5
29.0
4.6-7.6
60.5
2.4-4.0
60.0
0.4-0.8
50.0
1.6
2.8
4.4
1.6
0.6
1.4
1.6
1.0
12.0
November
6
28.7
4.0-8.3
48.0
2.0-4.3
46.2
1.2-1.7
70.0
1.8
3.3
5.2
1.0
1.5
0.7
2.0
1.5
11.2
Pre All-Star
11
28.7
4.3-8.0
53.4
2.2-4.2
52.2
0.8-1.3
64.3
1.7
3.1
4.8
1.3
1.1
1.0
1.8
1.3
11.5
Result
Split
GP
MIN
FG
FG%
3PT
3P%
FT
FT%
OR
DR
REB
AST
BLK
STL
PF
TO
PTS
Wins
4
27.3
3.8-6.0
62.5
2.0-3.3
61.5
1.3-2.0
62.5
1.8
3.0
4.8
2.3
1.3
0.5
2.0
1.5
10.8
Losses
7
29.6
4.6-9.1
50.0
2.3-4.7
48.5
0.6-0.9
66.7
1.7
3.1
4.9
0.7
1.0
1.3
1.7
1.1
12.0
Position
Split
GP
MIN
FG
FG%
3PT
3P%
FT
FT%
OR
DR
REB
AST
BLK
STL
PF
TO
PTS
As Starter
11
28.7
4.3-8.0
53.4
2.2-4.2
52.2
0.8-1.3
64.3
1.7
3.1
4.8
1.3
1.1
1.0
1.8
1.3
11.5
Day
Split
GP
MIN
FG
FG%
3PT
3P%
FT
FT%
OR
DR
REB
AST
BLK
STL
PF
TO
PTS
Tuesday
1
24.0
4.0-8.0
50.0
2.0-5.0
40.0
1.0-2.0
50.0
1.0
2.0
3.0
0.0
1.0
2.0
0.0
1.0
11.0
Wednesday
3
30.0
4.7-8.3
56.0
2.0-4.0
50.0
0.3-0.7
50.0
2.3
4.0
6.3
2.0
1.7
2.0
2.7
1.3
11.7
Friday
3
30.0
5.0-9.3
53.6
3.0-5.7
52.9
0.3-0.7
50.0
1.7
1.7
3.3
0.7
1.7
1.0
2.3
0.7
13.3
Sunday
4
28.0
3.5-6.8
51.9
1.8-3.0
58.3
1.5-2.0
75.0
1.5
3.8
5.3
1.5
0.3
0.0
1.3
1.8
10.3
Opponent
Split
GP
MIN
FG
FG%
3PT
3P%
FT
FT%
OR
DR
REB
AST
BLK
STL
PF
TO
PTS
Charlotte Hornets
1
26.0
5.0-5.0
100.0
3.0-3.0
100.0
0.0-0.0
0.0
0.0
4.0
4.0
1.0
1.0
0.0
2.0
3.0
13.0
Golden State Warriors
1
28.0
3.0-11.0
27.3
1.0-5.0
20.0
2.0-2.0
100.0
3.0
4.0
7.0
1.0
0.0
0.0
2.0
2.0
9.0
Los Angeles Lakers
2
31.5
6.0-11.5
52.2
3.0-6.5
46.2
0.5-1.0
50.0
3.0
1.5
4.5
0.5
1.0
3.0
2.5
1.0
15.5
Miami Heat
1
37.0
5.0-11.0
45.5
2.0-5.0
40.0
0.0-0.0
0.0
2.0
6.0
8.0
1.0
3.0
1.0
4.0
1.0
12.0
Minnesota Timberwolves
1
26.0
4.0-5.0
80.0
2.0-2.0
100.0
0.0-0.0
0.0
0.0
1.0
1.0
1.0
1.0
0.0
1.0
1.0
10.0
New Orleans Pelicans
1
29.0
2.0-5.0
40.0
0.0-1.0
0.0
4.0-6.0
66.7
3.0
1.0
4.0
3.0
0.0
0.0
1.0
1.0
8.0
Phoenix Suns
1
24.0
4.0-8.0
50.0
2.0-5.0
40.0
1.0-2.0
50.0
1.0
2.0
3.0
0.0
1.0
2.0
0.0
1.0
11.0
Sacramento Kings
1
26.0
3.0-4.0
75.0
1.0-2.0
50.0
1.0-2.0
50.0
2.0
4.0
6.0
5.0
0.0
1.0
2.0
1.0
8.0
Oklahoma City Thunder
2
30.0
4.5-8.0
56.3
3.5-5.0
70.0
0.0-0.0
0.0
1.0
4.5
5.5
0.5
2.0
0.5
1.5
1.0
12.5
07 / SEASON-BY-SEASON HISTORY
Career statistics
Regular Season Averages
Season
Team
GP
GS
MIN
FG
FG%
3PT
3P%
FT
FT%
OR
DR
REB
AST
BLK
STL
PF
TO
PTS
2016-17
Phoenix Suns
32
8
17.0
2.1-3.8
56.2
0.1-0.3
27.3
0.9-1.3
70.7
1.2
1.3
2.5
0.4
0.4
0.4
2.0
0.4
5.3
2017-18
Phoenix Suns
6
0
5.5
0.3-0.7
50.0
0.0-0.3
0.0
0.8-1.0
83.3
0.3
0.3
0.7
0.5
0.7
0.2
0.3
0.2
1.5
2017-18
Miami Heat
14
8
15.1
1.4-3.5
38.8
0.2-1.1
18.8
0.8-1.3
61.1
1.4
1.1
2.4
0.4
0.6
0.2
1.6
0.4
3.7
2017-18
2017 18 Totals
20
8
12.3
1.1-2.7
39.6
0.2-0.9
16.7
0.8-1.2
66.7
1.1
0.9
1.9
0.5
0.7
0.2
1.2
0.4
3.1
2018-19
Miami Heat
60
14
19.2
2.7-5.4
49.4
0.5-1.5
30.8
1.2-2.0
60.7
1.6
2.4
4.0
0.6
0.7
0.8
2.1
0.7
7.0
2019-20
Miami Heat
59
16
23.3
3.1-5.9
52.7
0.6-2.2
28.0
1.6-2.1
77.2
1.1
2.8
3.9
1.1
0.6
1.0
2.2
0.5
8.5
2020-21
Portland Trail Blazers
58
43
22.7
2.5-5.2
48.4
0.7-2.3
31.6
1.0-1.6
64.8
1.3
2.2
3.5
0.8
0.9
0.6
2.2
0.6
6.8
2021-22
Chicago Bulls
51
8
17.6
2.1-3.8
53.8
0.4-1.2
32.8
1.1-1.4
80.0
1.2
2.1
3.3
0.6
0.6
0.5
2.1
0.6
5.6
2022-23
Chicago Bulls
64
0
14.0
1.8-3.6
50.0
0.4-1.3
33.8
1.0-1.3
73.8
0.9
1.5
2.4
0.5
0.6
0.5
1.3
0.4
5.0
2023-24
Dallas Mavericks
76
66
23.5
3.1-6.5
48.3
1.1-3.1
34.3
1.3-1.8
71.3
1.1
2.2
3.3
1.0
0.7
0.7
1.6
0.9
8.6
2024-25
La Clippers
77
55
24.3
4.0-7.6
52.6
1.0-2.8
35.6
1.1-1.5
70.3
1.2
2.2
3.4
0.8
0.4
1.0
2.0
0.9
10.1
2025-26
La Clippers
50
45
27.0
3.8-7.6
49.9
1.1-3.1
35.9
1.4-1.9
76.3
1.2
2.2
3.5
1.4
1.0
0.9
2.1
0.8
10.1
2026-27
La Clippers
11
11
28.7
4.3-8.0
53.4
2.2-4.2
52.2
0.8-1.3
64.3
1.7
3.1
4.8
1.3
1.1
1.0
1.8
1.3
11.5
Career
—
558
274
21.1
2.8-5.6
50.7
0.7-2.1
33.7
1.2-1.6
71.1
1.2
2.1
3.3
0.8
0.7
0.7
1.9
0.7
7.6
Regular Season Totals
Season
Team
FG
FG%
3PT
3P%
FT
FT%
OR
DR
REB
AST
BLK
STL
PF
TO
PTS
2016-17
Phoenix Suns
68-121
56.2
3-11
27.3
29-41
70.7
39
40
79
12
13
14
63
13
168
2017-18
Phoenix Suns
2-4
50.0
0-2
0.0
5-6
83.3
2
2
4
3
4
1
2
1
9
2017-18
Miami Heat
19-49
38.8
3-16
18.8
11-18
61.1
19
15
34
6
9
3
22
6
52
2017-18
2017 18 Totals
21-53
39.6
3-18
16.7
16-24
66.7
21
17
38
9
13
4
24
7
61
2018-19
Miami Heat
160-324
49.4
28-91
30.8
74-122
60.7
96
144
240
37
42
46
123
43
422
2019-20
Miami Heat
184-349
52.7
37-132
28.0
95-123
77.2
66
167
233
62
38
58
130
30
500
2020-21
Portland Trail Blazers
147-304
48.4
43-136
31.6
59-91
64.8
77
128
205
47
54
37
127
32
396
2021-22
Chicago Bulls
105-195
53.8
20-61
32.8
56-70
80.0
60
109
169
30
33
25
105
30
286
2022-23
Chicago Bulls
115-230
50.0
27-80
33.8
62-84
73.8
60
93
153
34
37
29
86
25
319
2023-24
Dallas Mavericks
239-495
48.3
82-239
34.3
97-136
71.3
82
168
250
75
51
53
121
65
657
2024-25
La Clippers
310-589
52.6
78-219
35.6
83-118
70.3
93
170
263
60
33
79
153
66
781
2025-26
La Clippers
189-379
49.9
55-153
35.9
71-93
76.3
61
112
173
69
50
45
104
40
504
2026-27
La Clippers
47-88
53.4
24-46
52.2
9-14
64.3
19
34
53
14
12
11
20
14
127
Career
—
1585-3127
50.7
400-1186
33.7
651-916
71.1
674
1182
1856
449
376
401
1056
365
4221
Regular Season Misc Totals
Season
Team
DD2
TD3
DQ
EJECT
TECH
FLAG
AST/TO
STL/TO
SC-EFF
SH-EFF
2016-17
Phoenix Suns
0
0
1
0
2
0
0.9
1.1
1.388
0.57
2017-18
Phoenix Suns
0
0
0
0
0
0
3.0
1.0
2.250
0.50
2017-18
Miami Heat
0
0
0
0
0
0
1.0
0.5
1.061
0.42
2017-18
2017 18 Totals
0
0
0
0
0
0
1.3
0.6
1.151
0.42
2018-19
Miami Heat
0
0
1
0
1
0
0.9
1.1
1.302
0.54
2019-20
Miami Heat
0
0
0
0
0
0
2.1
1.9
1.433
0.58
2020-21
Portland Trail Blazers
0
0
0
0
0
1
1.5
1.2
1.303
0.55
2021-22
Chicago Bulls
0
0
2
0
0
1
1.0
0.8
1.467
0.59
2022-23
Chicago Bulls
0
0
0
0
0
0
1.4
1.2
1.387
0.56
2023-24
Dallas Mavericks
2
0
0
0
1
0
1.2
0.8
1.327
0.57
2024-25
La Clippers
0
0
0
0
3
0
0.9
1.2
1.326
0.59
2025-26
La Clippers
1
0
0
0
0
0
1.7
1.1
1.330
0.57
2026-27
La Clippers
0
0
0
0
0
0
1.0
0.8
1.443
0.67
Career
—
3
0
4
0
7
2
1.2
1.1
1.350
0.57
Scoring, rebounding and assist trend
08 / SHOT CHART AND ZONE SHOOTING
Shot profile
Shot-location data is not connected. Add a BALLDONTLIE GOAT-tier NBA API key in NBA Players → Settings to enable shot charts and zone shooting.
LATEST UPDATEJones totaled 14 points (5-10 FG, 4-7 3Pt), five rebounds, four blocks and one steal in 29 minutes during Friday's 113-112 win over the Thunder.
Jones was disruptive on both ends, knocking down four threes and blocking four shots. The forward's defense has always been his calling card, and when the outside shot falls, his fantasy value skyrockets.




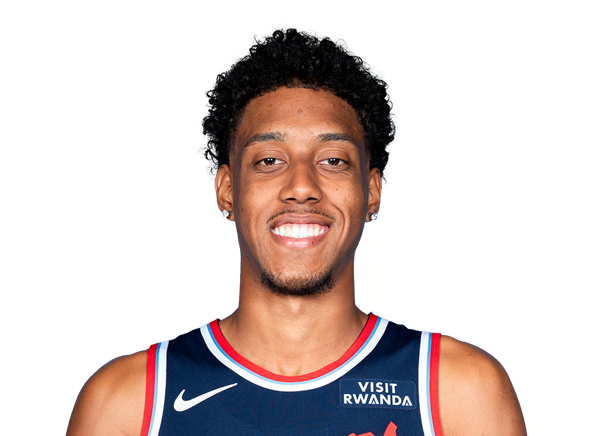 Baba MillerF #18
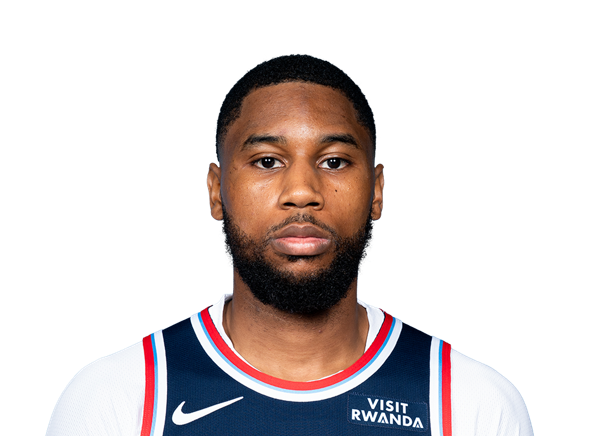 Blake WesleyG #20
 Bradley BealG #3
 Brandon IngramF #7
 Brook LopezC #11
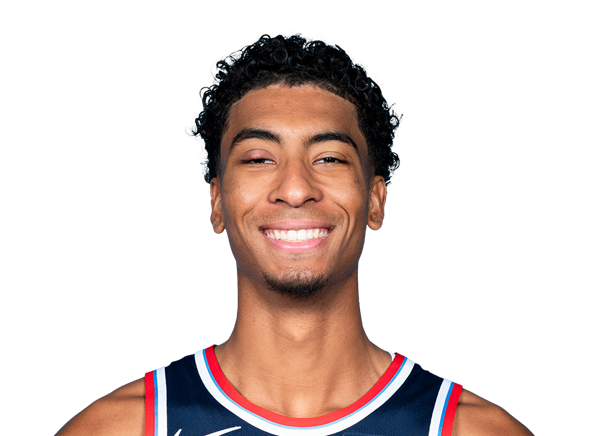 Cam ChristieG #24
 Darius GarlandG #10
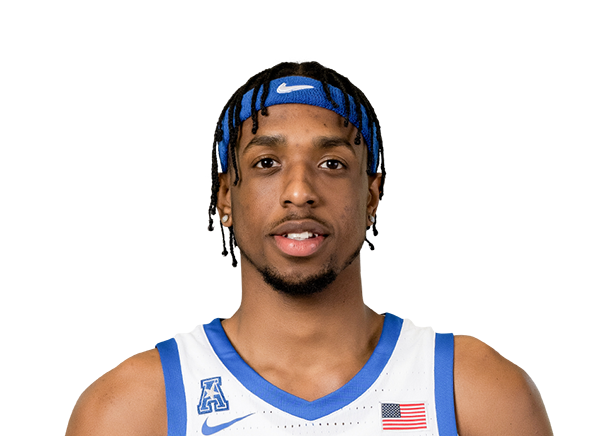 DeAndre WilliamsF
 Fletcher LoyerG #26
 Gradey DickG #9
 Isaiah JacksonF #23
 Jahmyl TelfortF #19
 Jalen PickettG #21
 Jordan MillerG #22
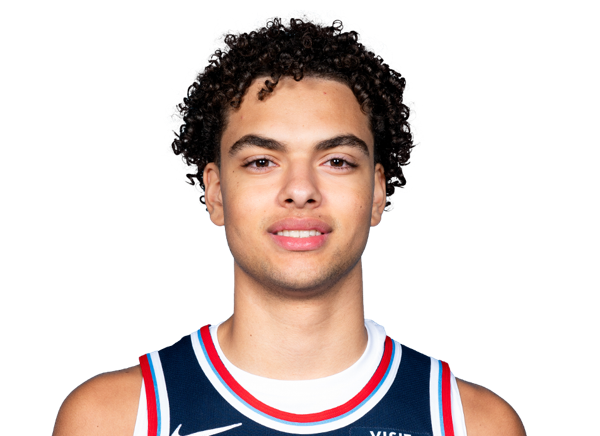 Keaton WaglerG #1
 Kobe SandersG #4
 Kris DunnG #8
 Max StrusG #31
 Nick MartinelliF #12
 Nicolas BatumF #33
 Rui HachimuraF #28
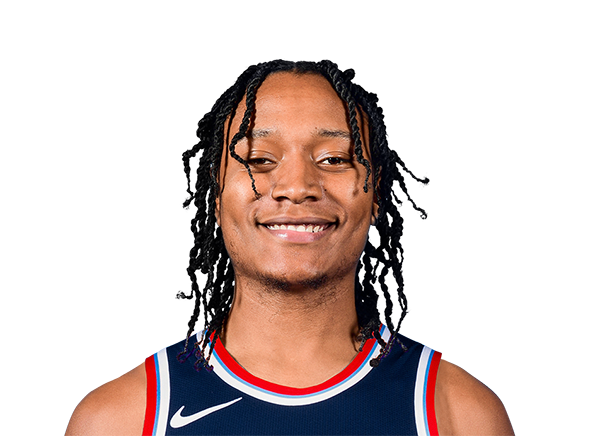 TyTy Washington Jr.G #15
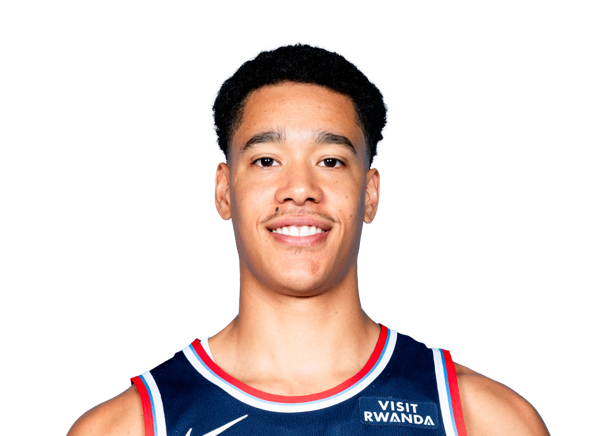 Yanic Konan NiederhauserC #14
 Yuki KawamuraG #17