


BALLERSCULTURE PLAYER PROFILE · 2026-27
Sergio de Larrea
Dallas Mavericks · F • #55 • 6' 7" 202 lbs

01 / 2026-27 PER-GAME AVERAGES
Season snapshot
PTS5.3
REB2.0
AST1.3
STL0.0
BLK0.0
TO1.0
MIN11.5
FG%50.0
3P%60.0
FT%0.0
GP4
GS0
FG2.3-4.5
3PT0.8-1.3
FT0.0-0.0
OR0.5
Per-game averages, regular season 2026-27 (Dallas Mavericks).
02 / EVERY SEASON SINCE 2022-23, SIDE BY SIDE
2022-23 to 2026-27
Per game
| Season | Team | GP | GS | MIN | PTS | REB | AST | STL | BLK | TO | FG% | 3P% | FT% |
|---|---|---|---|---|---|---|---|---|---|---|---|---|---|
| 2022-23 | — | — | — | — | — | — | — | — | — | — | — | — | — |
| 2023-24 | — | — | — | — | — | — | — | — | — | — | — | — | — |
| 2024-25 | — | — | — | — | — | — | — | — | — | — | — | — | — |
| 2025-26 | — | — | — | — | — | — | — | — | — | — | — | — | — |
| 2026-27 | Dallas Mavericks | 4 | 0 | 11.5 | 5.3 | 2.0 | 1.3 | 0.0 | 0.0 | 1.0 | 50.0 | 60.0 | 0.0 |
Season totals
| Season | Team | GP | GS | MIN | PTS | REB | AST | STL | BLK | TO | FG% | 3P% | FT% |
|---|---|---|---|---|---|---|---|---|---|---|---|---|---|
| 2022-23 | — | — | — | — | — | — | — | — | — | — | — | — | — |
| 2023-24 | — | — | — | — | — | — | — | — | — | — | — | — | — |
| 2024-25 | — | — | — | — | — | — | — | — | — | — | — | — | — |
| 2025-26 | — | — | — | — | — | — | — | — | — | — | — | — | — |
| 2026-27 | Dallas Mavericks | — | — | — | 21 | 8 | 5 | 0 | 0 | 4 | 50.0 | 60.0 | 0.0 |
Click a season to open this player’s full game log, splits and advanced stats for that year; click a team to open its page. A dash means no NBA games were recorded.
03 / EVERY CATEGORY THE PROVIDER REPORTS
Full statistical breakdown
Regular season 2026-27
Defensive
| Metric | Total | NBA rank |
|---|---|---|
| Blocks | 0 | Tied-370th |
| Defensive Rebounds | 6 | Tied-358th |
| Steals | 0 | Tied-402nd |
| Defensive Rebound Rate | 0.0 | — |
| Defensive Rebounds Per Game | 1.5 | — |
| Blocks Per Game | 0.0 | — |
| Steals Per Game | 0.0 | — |
| Defensive Rebounds Per 48 | 6.3 | Tied-2,864th |
| Blocks Per 48 | 0.0 | Tied-2,960th |
| Steals Per 48 | 0.0 | Tied-3,216th |
General
| Metric | Total | NBA rank |
|---|---|---|
| Disqualifications | 0 | Tied-21st |
| Flagrant Fouls | 0 | Tied-22nd |
| Fouls | 3 | Tied-391st |
| Player Efficiency Rating | 11.59 | — |
| Rebound Rate | 0.0 | — |
| Ejections | 0 | Tied-7th |
| Technical Fouls | 0 | Tied-101st |
| Rebounds | 8 | — |
| Value Over Replacement Player | 0.0 | — |
| Minutes | 46 | 6th |
| Minutes Per Game | 11.5 | — |
| Rating | 9.1 | Tied-524th |
| Plus-Minus | -28 | Tied-1st |
| Rebounds Per Game | 2.0 | — |
| Fouls Per Game | 0.8 | — |
| Flagrant Fouls Per Game | 0.0 | — |
| Technical Fouls Per Game | 0.0 | — |
| Ejections Per Game | 0.0 | — |
| Disqualifications Per Game | 0.0 | — |
| Assist To Turnover Ratio | 1.3 | — |
| Steal To Foul Ratio | 0.0 | — |
| Block To Foul Ratio | 0.0 | — |
| Team Rebounds Per Game | 0.0 | — |
| Rebounds | 8 | — |
| Total Technical Fouls | 0 | — |
| Assist To Turnover Ratio | 0.0 | — |
| Steal To Turnover Ratio | 0.0 | — |
| Rebounds Per 48 Minutes | 8.3 | — |
| Fouls Per 48 Minutes | 3.1 | Tied-3,128th |
| Flagrant Fouls Per 48 Minutes | 0.0 | Tied-176th |
| Technical Fouls Per 48 Minutes | 0.0 | Tied-808th |
| Ejections Per 48 Minutes | 0.0 | Tied-56th |
| Disqualifications Per 48 Minutes | 0.0 | Tied-168th |
| R/40 | 7.0 | — |
| Games Played | 4 | 4th |
| Games Started | 0 | Tied-257th |
| Double Double | 0 | Tied-119th |
| Triple Double | 0 | Tied-12th |
Offensive
| Metric | Total | NBA rank |
|---|---|---|
| Assists | 5 | Tied-336th |
| Effective Field Goal Percentage | 58.3 | — |
| Field Goals | 9/18 | — |
| Field Goals Attempted | 18 | Tied-348th |
| Field Goals Made | 9 | Tied-338th |
| Field Goal Percentage | 50.0 | — |
| Free Throws | 0/0 | — |
| Free Throw Percentage | 0.0 | — |
| Free Throws Attempted | 0 | Tied-418th |
| Free Throws Made | 0 | Tied-413th |
| Offensive Rebounds | 2 | Tied-358th |
| Points | 21 | Tied-347th |
| Turnovers | 4 | Tied-308th |
| 3-Point Field Goal Percentage | 60.0 | — |
| 3-Point Field Goals Attempted | 5 | Tied-345th |
| 3-Point Field Goals Made | 3 | Tied-293rd |
| True Shooting Percentage | 58.3 | — |
| Total Turnovers | 4 | — |
| Assist Ratio | 18.5 | — |
| Points in the Paint | 0 | Tied-1st |
| Offensive Rebound Rate | 0.0 | — |
| Turnover Ratio | 14.8 | — |
| Brick Index | 0.00 | — |
| Usage Rate | 0.0 | — |
| Average Field Goals Made | 2.3 | — |
| Average Field Goals Attempted | 4.5 | — |
| Average 3-Point Field Goals Made | 0.8 | — |
| Average 3-Point Field Goals Attempted | 1.3 | — |
| Average Free Throws Made | 0.0 | — |
| Average Free Throws Attempted | 0.0 | — |
| Points Per Game | 5.3 | — |
| Offensive Rebounds Per Game | 0.5 | — |
| Assists Per Game | 1.3 | — |
| Turnovers Per Game | 1.0 | — |
| Offensive Rebound Percentage | 0.2 | — |
| Estimated Possessions | 20.0 | — |
| Estimated Possessions Per Game | 5.0 | — |
| Points Per Estimated Possession | 1.1 | — |
| Team Turnovers Per Game | 0.0 | — |
| Total Turnovers Per Game | 1.0 | — |
| 3-Point Field Goal Percentage | 60.0 | — |
| 2-Point Field Goals Made | 6.0 | Tied-45th |
| 2-Point Field Goals Attempted | 13.0 | Tied-3rd |
| 2-Point Field Goals Made per Game | 1.5 | — |
| 2-Point Field Goals Attempted per Game | 3.3 | — |
| 2-Point Field Goal Percentage | 46.2 | — |
| Shooting Efficiency | 0.58 | — |
| Scoring Efficiency | 1.167 | — |
| Fieldgoals Made Per 48 | 9.4 | Tied-2,704th |
| Fieldgoals Attempted Per 48 | 18.8 | Tied-2,784th |
| 3-Point Fieldgoals Made Per 48 | 3.1 | Tied-2,344th |
| 3-Point Fieldgoals Attempted Per 48 | 5.2 | Tied-2,760th |
| Freethrows Made Per 48 | 0.0 | Tied-3,304th |
| Freethrows Attempted Per 48 | 0.0 | Tied-3,344th |
| Points Scored Per 48 | 21.9 | Tied-2,776th |
| Offensive Rebounds Per 48 | 2.1 | Tied-2,864th |
| Assists Per 48 | 5.2 | Tied-2,688th |
| Turnovers | 4.2 | Tied-2,464th |
| P/40 | 18.3 | — |
| A/40 | 4.3 | — |
04 / EFFICIENCY, SHOOTING PROFILE, PER-36
Advanced metrics
True shooting %58.9%
Effective FG %60.0%
2-point FG %46.9%
3-point attempt rate28.9%
Free throw rate0.0%
Points per shot attempt1.18
% of points from 3s45.3%
Assist-to-turnover1.30
Points per 36 min16.6
Rebounds per 36 min6.3
Assists per 36 min4.1
Steals per 36 min0.00
Blocks per 36 min0.00
Turnovers per 36 min3.13
Stocks (STL + BLK) per game0.00
Pts + Reb + Ast per game8.6
Efficiency (EFF) per game5.4
Game Score per game (Hollinger)3.5
Minutes per game11.5
Calculated by BallersCulture from the supplied 2026-27 box-score totals using standard formulas (hover a tile to see the formula). Tracking-based metrics such as BPM, VORP, on/off and RAPTOR are not available from this data source.
05 / 4 GAMES IN 2026-27
Game log: Regular season
| Date | Opp | Result | MIN | FG | FG% | 3PT | 3P% | FT | FT% | REB | AST | BLK | STL | PF | TO | PTS |
|---|---|---|---|---|---|---|---|---|---|---|---|---|---|---|---|---|
| Oct 27 | @ MIA | W 113-109 | 6 | 0-1 | 0.0 | 0-0 | 0.0 | 0-0 | 0.0 | 1 | 0 | 0 | 0 | 0 | 0 | 0 |
| Oct 25 | vs SA | L 122-106 | 33 | 9-15 | 60.0 | 3-4 | 75.0 | 0-0 | 0.0 | 5 | 4 | 0 | 0 | 3 | 4 | 21 |
| Oct 24 | @ IND | W 121-105 | 1 | 0-1 | 0.0 | 0-0 | 0.0 | 0-0 | 0.0 | 0 | 0 | 0 | 0 | 0 | 0 | 0 |
| Oct 22 | @ HOU | L 128-110 | 7 | 0-1 | 0.0 | 0-1 | 0.0 | 0-0 | 0.0 | 2 | 1 | 0 | 0 | 0 | 0 | 0 |
06 / 2026-27 HOME / AWAY, RESULTS, MONTHS AND OPPONENTS
Splits
split
| Split | GP | MIN | FG | FG% | 3PT | 3P% | FT | FT% | OR | DR | REB | AST | BLK | STL | PF | TO | PTS |
|---|---|---|---|---|---|---|---|---|---|---|---|---|---|---|---|---|---|
| All Splits | 4 | 11.5 | 2.3-4.5 | 50.0 | 0.8-1.3 | 60.0 | 0.0-0.0 | 0.0 | 0.5 | 1.5 | 2.0 | 1.3 | 0.0 | 0.0 | 0.8 | 1.0 | 5.3 |
| Home | 1 | 33.0 | 9.0-15.0 | 60.0 | 3.0-4.0 | 75.0 | 0.0-0.0 | 0.0 | 1.0 | 4.0 | 5.0 | 4.0 | 0.0 | 0.0 | 3.0 | 4.0 | 21.0 |
| Road | 3 | 4.3 | 0.0-1.0 | 0.0 | 0.0-0.3 | 0.0 | 0.0-0.0 | 0.0 | 0.3 | 0.7 | 1.0 | 0.3 | 0.0 | 0.0 | 0.0 | 0.0 | 0.0 |
| vs. Division | 2 | 20.0 | 4.5-8.0 | 56.3 | 1.5-2.5 | 60.0 | 0.0-0.0 | 0.0 | 1.0 | 2.5 | 3.5 | 2.5 | 0.0 | 0.0 | 1.5 | 2.0 | 10.5 |
| vs. Conference | 2 | 20.0 | 4.5-8.0 | 56.3 | 1.5-2.5 | 60.0 | 0.0-0.0 | 0.0 | 1.0 | 2.5 | 3.5 | 2.5 | 0.0 | 0.0 | 1.5 | 2.0 | 10.5 |
| 3+ Days Rest | 1 | 7.0 | 0.0-1.0 | 0.0 | 0.0-1.0 | 0.0 | 0.0-0.0 | 0.0 | 1.0 | 1.0 | 2.0 | 1.0 | 0.0 | 0.0 | 0.0 | 0.0 | 0.0 |
Month
| Split | GP | MIN | FG | FG% | 3PT | 3P% | FT | FT% | OR | DR | REB | AST | BLK | STL | PF | TO | PTS |
|---|---|---|---|---|---|---|---|---|---|---|---|---|---|---|---|---|---|
| October | 4 | 11.5 | 2.3-4.5 | 50.0 | 0.8-1.3 | 60.0 | 0.0-0.0 | 0.0 | 0.5 | 1.5 | 2.0 | 1.3 | 0.0 | 0.0 | 0.8 | 1.0 | 5.3 |
| Pre All-Star | 4 | 11.5 | 2.3-4.5 | 50.0 | 0.8-1.3 | 60.0 | 0.0-0.0 | 0.0 | 0.5 | 1.5 | 2.0 | 1.3 | 0.0 | 0.0 | 0.8 | 1.0 | 5.3 |
Result
| Split | GP | MIN | FG | FG% | 3PT | 3P% | FT | FT% | OR | DR | REB | AST | BLK | STL | PF | TO | PTS |
|---|---|---|---|---|---|---|---|---|---|---|---|---|---|---|---|---|---|
| Wins | 2 | 3.5 | 0.0-1.0 | 0.0 | 0.0-0.0 | 0.0 | 0.0-0.0 | 0.0 | 0.0 | 0.5 | 0.5 | 0.0 | 0.0 | 0.0 | 0.0 | 0.0 | 0.0 |
| Losses | 2 | 20.0 | 4.5-8.0 | 56.3 | 1.5-2.5 | 60.0 | 0.0-0.0 | 0.0 | 1.0 | 2.5 | 3.5 | 2.5 | 0.0 | 0.0 | 1.5 | 2.0 | 10.5 |
Day
| Split | GP | MIN | FG | FG% | 3PT | 3P% | FT | FT% | OR | DR | REB | AST | BLK | STL | PF | TO | PTS |
|---|---|---|---|---|---|---|---|---|---|---|---|---|---|---|---|---|---|
| Monday | 1 | 6.0 | 0.0-1.0 | 0.0 | 0.0-0.0 | 0.0 | 0.0-0.0 | 0.0 | 0.0 | 1.0 | 1.0 | 0.0 | 0.0 | 0.0 | 0.0 | 0.0 | 0.0 |
| Wednesday | 1 | 7.0 | 0.0-1.0 | 0.0 | 0.0-1.0 | 0.0 | 0.0-0.0 | 0.0 | 1.0 | 1.0 | 2.0 | 1.0 | 0.0 | 0.0 | 0.0 | 0.0 | 0.0 |
| Friday | 1 | 1.0 | 0.0-1.0 | 0.0 | 0.0-0.0 | 0.0 | 0.0-0.0 | 0.0 | 0.0 | 0.0 | 0.0 | 0.0 | 0.0 | 0.0 | 0.0 | 0.0 | 0.0 |
| Saturday | 1 | 33.0 | 9.0-15.0 | 60.0 | 3.0-4.0 | 75.0 | 0.0-0.0 | 0.0 | 1.0 | 4.0 | 5.0 | 4.0 | 0.0 | 0.0 | 3.0 | 4.0 | 21.0 |
Opponent
| Split | GP | MIN | FG | FG% | 3PT | 3P% | FT | FT% | OR | DR | REB | AST | BLK | STL | PF | TO | PTS |
|---|---|---|---|---|---|---|---|---|---|---|---|---|---|---|---|---|---|
| Houston Rockets | 1 | 7.0 | 0.0-1.0 | 0.0 | 0.0-1.0 | 0.0 | 0.0-0.0 | 0.0 | 1.0 | 1.0 | 2.0 | 1.0 | 0.0 | 0.0 | 0.0 | 0.0 | 0.0 |
| Indiana Pacers | 1 | 1.0 | 0.0-1.0 | 0.0 | 0.0-0.0 | 0.0 | 0.0-0.0 | 0.0 | 0.0 | 0.0 | 0.0 | 0.0 | 0.0 | 0.0 | 0.0 | 0.0 | 0.0 |
| Miami Heat | 1 | 6.0 | 0.0-1.0 | 0.0 | 0.0-0.0 | 0.0 | 0.0-0.0 | 0.0 | 0.0 | 1.0 | 1.0 | 0.0 | 0.0 | 0.0 | 0.0 | 0.0 | 0.0 |
| San Antonio Spurs | 1 | 33.0 | 9.0-15.0 | 60.0 | 3.0-4.0 | 75.0 | 0.0-0.0 | 0.0 | 1.0 | 4.0 | 5.0 | 4.0 | 0.0 | 0.0 | 3.0 | 4.0 | 21.0 |
07 / SEASON-BY-SEASON HISTORY
Career statistics
Regular Season Averages
| Season | Team | GP | GS | MIN | FG | FG% | 3PT | 3P% | FT | FT% | OR | DR | REB | AST | BLK | STL | PF | TO | PTS |
|---|---|---|---|---|---|---|---|---|---|---|---|---|---|---|---|---|---|---|---|
| 2026-27 | Dallas Mavericks | 4 | 0 | 11.5 | 2.3-4.5 | 50.0 | 0.8-1.3 | 60.0 | 0.0-0.0 | 0.0 | 0.5 | 1.5 | 2.0 | 1.3 | 0.0 | 0.0 | 0.8 | 1.0 | 5.3 |
| Career | — | 4 | 0 | 11.5 | 2.3-4.5 | 50.0 | 0.8-1.3 | 60.0 | 0.0-0.0 | 0.0 | 0.5 | 1.5 | 2.0 | 1.3 | 0.0 | 0.0 | 0.8 | 1.0 | 5.3 |
Regular Season Totals
| Season | Team | FG | FG% | 3PT | 3P% | FT | FT% | OR | DR | REB | AST | BLK | STL | PF | TO | PTS |
|---|---|---|---|---|---|---|---|---|---|---|---|---|---|---|---|---|
| 2026-27 | Dallas Mavericks | 9-18 | 50.0 | 3-5 | 60.0 | 0-0 | 0.0 | 2 | 6 | 8 | 5 | 0 | 0 | 3 | 4 | 21 |
| Career | — | 9-18 | 50.0 | 3-5 | 60.0 | 0-0 | 0.0 | 2 | 6 | 8 | 5 | 0 | 0 | 3 | 4 | 21 |
Regular Season Misc Totals
| Season | Team | DD2 | TD3 | DQ | EJECT | TECH | FLAG | AST/TO | STL/TO | SC-EFF | SH-EFF |
|---|---|---|---|---|---|---|---|---|---|---|---|
| 2026-27 | Dallas Mavericks | 0 | 0 | 0 | 0 | 0 | 0 | 1.3 | 0.0 | 1.167 | 0.58 |
| Career | — | 0 | 0 | 0 | 0 | 0 | 0 | 1.3 | 0.0 | 1.167 | 0.58 |
08 / SHOT CHART AND ZONE SHOOTING
Shot profile
Shot-location data is not connected. Add a BALLDONTLIE GOAT-tier NBA API key in NBA Players → Settings to enable shot charts and zone shooting.
09 / RECORD, TEAM STATS AND TEAMMATES
Team
Overall7-7
Home5-2
Road2-5
DIV1-3
CONF3-5
Last Ten Games5-5
Team records for 2026-27 (regular season).
Team statistics 2026-27
Defensive
| Metric | Total | Per game | NBA rank |
|---|---|---|---|
| Blocks | 78 | 5.571 | 5th |
| Defensive Rebounds | 429 | 30.714 | 7th |
| Steals | 120 | 8.571 | Tied-3rd |
| Points Conceded Off Turnovers | 0 | 17 | — |
| Defensive Rebound Rate | 0.0 | — | — |
| Defensive Rebounds Per Game | 30.6 | — | — |
| Blocks Per Game | 5.6 | — | — |
| Steals Per Game | 8.6 | — | — |
| Defensive Rebounds Per 48 | 0.0 | — | — |
| Blocks Per 48 | 0.0 | — | — |
| Steals Per 48 | 0.0 | — | — |
General
| Metric | Total | Per game | NBA rank |
|---|---|---|---|
| Disqualifications | 2 | — | Tied-2nd |
| Flagrant Fouls | 1 | 0.071 | Tied-8th |
| Fouls | 305 | 21.786 | 5th |
| Rebound Rate | 51.7 | — | 7th |
| Ejections | 0 | — | — |
| Technical Fouls | 10 | 0.357 | Tied-11th |
| Rebounds | 605 | 43.285 | — |
| Minutes | 0 | — | — |
| Minutes Per Game | 0.0 | — | — |
| Fantasy Rating | 0.0 | — | — |
| Rating | 207.0 | — | — |
| Plus-Minus | -1 | -1 | Tied-1st |
| Game Day of Year | 0 | — | — |
| Rebounds Per Game | 43.2 | — | — |
| Fouls Per Game | 21.8 | — | — |
| Flagrant Fouls Per Game | 0.1 | — | — |
| Technical Fouls Per Game | 0.7 | — | — |
| Ejections Per Game | 0.0 | — | — |
| Disqualifications Per Game | 0.1 | — | — |
| Assist To Turnover Ratio | 1.7 | 1.726 | — |
| Steal To Foul Ratio | 0.4 | 0.393 | — |
| Block To Foul Ratio | 0.3 | 0.256 | — |
| Team Rebounds Per Game | 0.0 | — | — |
| Rebounds | 605 | 43.285 | — |
| Total Technical Fouls | 10 | 0.357 | — |
| Assist To Turnover Ratio | 30.5 | — | — |
| Team Rebounds | 0 | — | — |
| Steal To Turnover Ratio | 0.6 | 0.566 | — |
| Rebounds Per 48 Minutes | 0.0 | — | — |
| Fouls Per 48 Minutes | 0.0 | — | — |
| Flagrant Fouls Per 48 Minutes | 0.0 | — | — |
| Technical Fouls Per 48 Minutes | 0.0 | — | — |
| Ejections Per 48 Minutes | 0.0 | — | — |
| Disqualifications Per 48 Minutes | 0.0 | — | — |
| Games Played | 14 | — | Tied-1st |
| Games Started | 0 | — | — |
| Double Double | 0 | — | — |
| Triple Double | 0 | — | — |
Offensive
| Metric | Total | Per game | NBA rank |
|---|---|---|---|
| Assists | 366 | 26.143 | 3rd |
| Effective Field Goal Percentage | 53.2 | — | 11th |
| Field Goals | 569/1237 | 0.46 | — |
| Field Goals Attempted | 1237 | 88.357 | 3rd |
| Field Goals Made | 569 | 40.643 | 5th |
| Field Goal Percentage | 46.0 | 0.46 | 11th |
| Free Throws | 254/323 | 0.786 | — |
| Free Throw Percentage | 78.6 | 0.786 | 11th |
| Free Throws Attempted | 323 | 23.071 | 9th |
| Free Throws Made | 254 | 18.143 | 10th |
| Offensive Rebounds | 176 | 12.571 | 4th |
| Points | 1569 | 112.071 | 6th |
| Turnovers | 212 | 15.143 | 4th |
| 3-Point Field Goal Percentage | 33.5 | 0.335 | 14th |
| 3-Point Field Goals Attempted | 528 | 37.714 | 2nd |
| 3-Point Field Goals Made | 177 | 12.643 | 7th |
| True Shooting Percentage | 56.9 | — | 12th |
| Team Turnovers | 12 | — | Tied-4th |
| Total Turnovers | 224 | 15.143 | — |
| Assist Ratio | 18.6 | — | 8th |
| Points in the Paint | 654 | 46 | 7th |
| Offensive Rebound Rate | 30.2 | — | 5th |
| Turnover Ratio | 14.0 | — | 7th |
| Fast Break Points | 239 | — | — |
| Possessions | 1427 | — | 6th |
| Pace Factor | 98.7 | — | 9th |
| Average Field Goals Made | 40.6 | — | — |
| Average Field Goals Attempted | 88.4 | — | — |
| Average 3-Point Field Goals Made | 12.6 | — | — |
| Average 3-Point Field Goals Attempted | 37.7 | — | — |
| Average Free Throws Made | 18.1 | — | — |
| Average Free Throws Attempted | 23.1 | — | — |
| Points Per Game | 112.1 | — | — |
| Offensive Rebounds Per Game | 12.6 | — | — |
| Assists Per Game | 26.1 | — | — |
| Turnovers Per Game | 15.1 | — | — |
| Offensive Rebound Percentage | 0.3 | 0.263 | — |
| Estimated Possessions | 1414.2 | 100.157 | — |
| Estimated Possessions Per Game | 101.0 | — | — |
| Points Per Estimated Possession | 1.1 | 1.119 | — |
| Team Turnovers Per Game | 0.9 | — | — |
| Total Turnovers Per Game | 16.0 | — | — |
| 3-Point Field Goal Percentage | 33.5 | 0.335 | 3rd |
| 2-Point Field Goals Made | 392.0 | 28 | Tied-2nd |
| 2-Point Field Goals Attempted | 709.0 | 50.643 | 1st |
| 2-Point Field Goals Made per Game | 28.0 | — | — |
| 2-Point Field Goals Attempted per Game | 50.6 | — | — |
| 2-Point Field Goal Percentage | 55.3 | 0.553 | Tied-2nd |
| Shooting Efficiency | 0.53 | 0.532 | — |
| Scoring Efficiency | 1.268 | 1.268 | — |
| Fieldgoals Made Per 48 | 0.0 | — | — |
| Fieldgoals Attempted Per 48 | 0.0 | — | — |
| 3-Point Fieldgoals Made Per 48 | 0.0 | — | — |
| 3-Point Fieldgoals Attempted Per 48 | 0.0 | — | — |
| Freethrows Made Per 48 | 0.0 | — | — |
| Freethrows Attempted Per 48 | 0.0 | — | — |
| Points Scored Per 48 | 0.0 | — | — |
| Offensive Rebounds Per 48 | 0.0 | — | — |
| Assists Per 48 | 0.0 | — | — |
| Turnovers | 0.0 | — | — |
Teammates
 Caleb MartinF #16
 Cooper FlaggF #32
 Daniel GaffordF #21
 Dereck Lively IIC #2
 Dwight PowellF #7
 Jett HowardG #9
 John PoulakidasG #1
 Jorge Diaz-GrahamF
 Kyrie IrvingG #11
 Marcus SasserG #8
 Max ChristieG
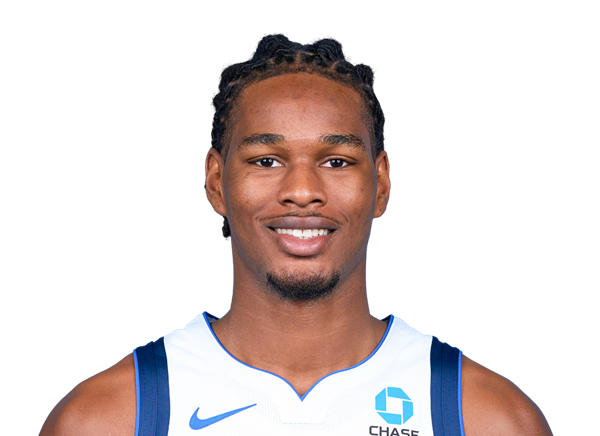 Morez Johnson Jr.F #14
 Moussa CisseC #30
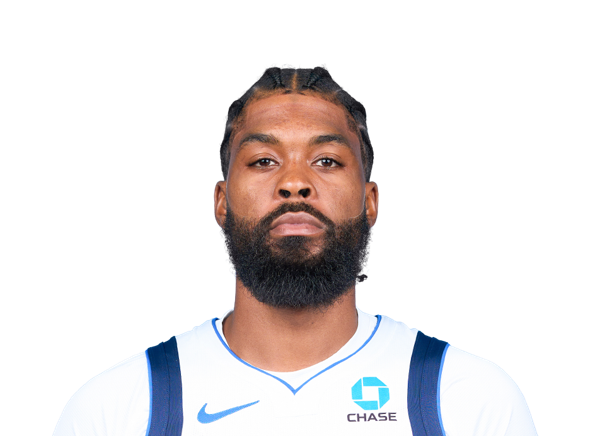 Naji MarshallF #3
 P.J. WashingtonF #25
 Quincy AcyF
 Santi AldamaF #34
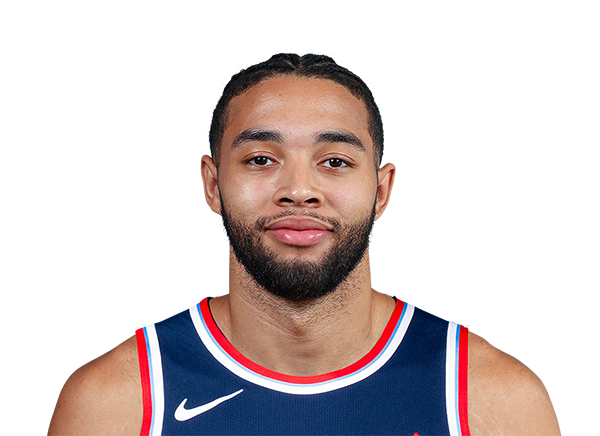 Seth LundyG #5
 Tarik BiberovicF #13
 Tobi LawalF #33
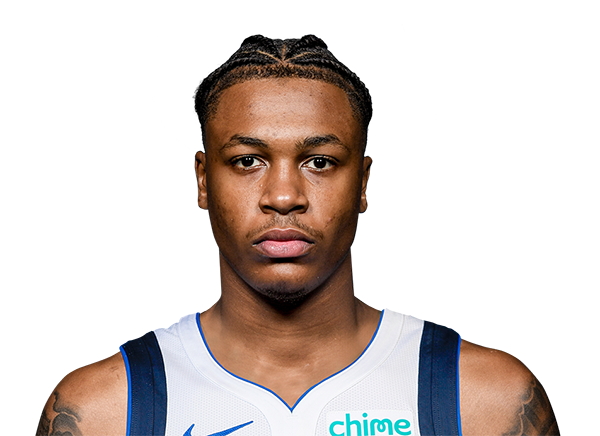 Tyler SmithF #23
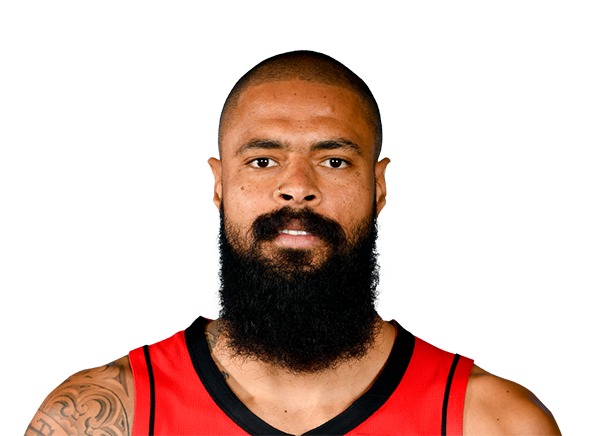 Tyson ChandlerC #6
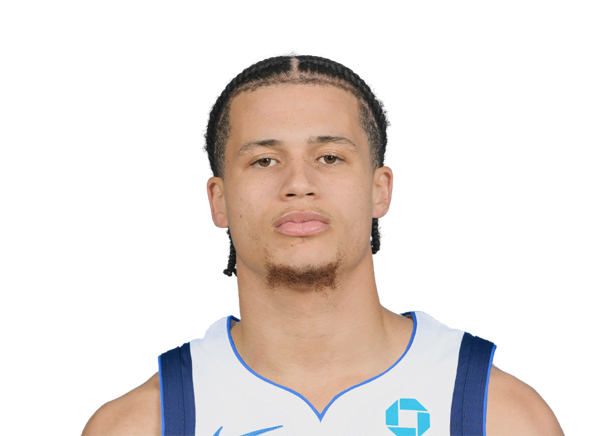 Walter Clayton Jr.G #1
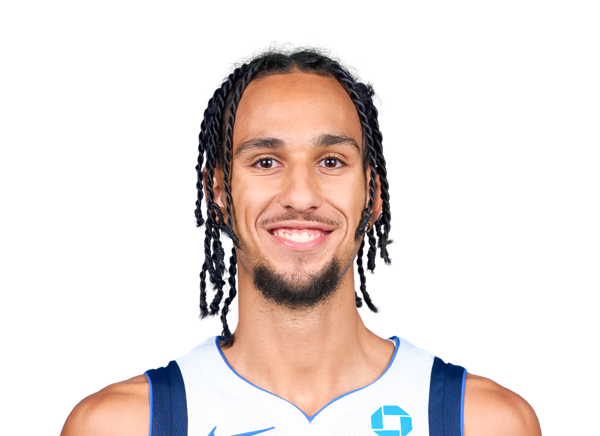 Zaccharie RisacherF #10
10 / SALARY BY SEASON
Contract
No contract is on file for this player yet.
11 / LATEST REPORT
Injury status
No current injury report entry for this player.
12 / SIGNINGS, TRADES AND ROSTER MOVES
Transactions
No recorded transactions for this player.
13 / LATEST COVERAGE
Player news
LATEST UPDATEDe Larrea (knee) has been ruled out for Thursday's game at Minnesota.
De Larrea hasn't played since Oct. 26 due to a right knee sprain, but he's expected to be re-evaluated soon. Still, he can be considered week-to-week until Dallas provides an update on his progress.
17 October 2026Sergio de Larrea gets up for the beautiful flush↗
10 October 2026Houston Rockets vs. Dallas Mavericks: Game Highlights↗
14 July 2026De Larrea's double-double leads Mavericks past Grizzlies↗
14 July 2026Sergio de Larrea nails the 3-point shot vs. Memphis Grizzlies↗
10 July 2026Lendeborg's double-double leads Warriors past Mavericks↗
17 November 202676ers star LeBron James ruled out vs. Nets due to lower back management↗
17 November 2026Fantasy basketball adds and NBA bets: All eyes on Tyrese Maxey on Monday↗
17 November 2026Bulls' Buzelis, Nets' Minott fined $25K each after making obscene gestures↗
14 / BIO, DRAFT AND CONTACT DETAILS
Biography & profile
TeamDallas Mavericks
PositionForward
Jersey55
Height6' 7"
Weight202 lbs
Age20
Date of birthDec 4, 2005
BirthplaceValladolid, Spain
Experience0 yrs
StatusActive
Injury reportOut