Click a season to open this player’s full game log, splits and advanced stats for that year; click a team to open its page. A dash means no NBA games were recorded.
03 / EVERY CATEGORY THE PROVIDER REPORTS
Full statistical breakdown
Regular season 2026-27
Defensive
Metric
Total
NBA rank
Blocks
0
Tied-376th
Defensive Rebounds
22
Tied-232nd
Steals
8
Tied-174th
Defensive Rebound Rate
0.0
—
Defensive Rebounds Per Game
2.2
Tied-193rd
Blocks Per Game
0.0
Tied-272nd
Steals Per Game
0.8
134th
Defensive Rebounds Per 48
4.9
2,784th
Blocks Per 48
0.0
4,512th
Steals Per 48
1.8
2,088th
General
Metric
Total
NBA rank
Disqualifications
0
Tied-22nd
Flagrant Fouls
0
Tied-24th
Fouls
23
Tied-185th
Player Efficiency Rating
11.86
206th
Rebound Rate
0.0
—
Ejections
0
Tied-7th
Technical Fouls
1
Tied-31st
Rebounds
31
—
Value Over Replacement Player
0.0
—
Minutes
216
Tied-4th
Minutes Per Game
21.6
—
Rating
13.8
Tied-142nd
Plus-Minus
-41
Tied-1st
Rebounds Per Game
3.1
188th
Fouls Per Game
2.3
119th
Flagrant Fouls Per Game
0.0
Tied-21st
Technical Fouls Per Game
0.1
Tied-28th
Ejections Per Game
0.0
Tied-6th
Disqualifications Per Game
0.0
Tied-21st
Assist To Turnover Ratio
3.7
—
Steal To Foul Ratio
0.3
—
Block To Foul Ratio
0.0
—
Team Rebounds Per Game
0.0
—
Rebounds
31
—
Total Technical Fouls
1
—
Assist To Turnover Ratio
0.0
—
Steal To Turnover Ratio
1.3
—
Rebounds Per 48 Minutes
6.9
—
Fouls Per 48 Minutes
5.1
2,220th
Flagrant Fouls Per 48 Minutes
0.0
288th
Technical Fouls Per 48 Minutes
0.2
372nd
Ejections Per 48 Minutes
0.0
84th
Disqualifications Per 48 Minutes
0.0
264th
R/40
5.7
—
Games Played
10
10th
Games Started
7
Tied-143rd
Double Double
0
Tied-121st
Triple Double
0
Tied-13th
Offensive
Metric
Total
NBA rank
Assists
22
Tied-176th
Effective Field Goal Percentage
67.1
—
Field Goals
22/41
—
Field Goals Attempted
41
Tied-292nd
Field Goals Made
22
Tied-264th
Field Goal Percentage
53.7
—
Free Throws
4/4
—
Free Throw Percentage
100.0
Tied-1st
Free Throws Attempted
4
Tied-338th
Free Throws Made
4
Tied-312th
Offensive Rebounds
9
Tied-197th
Points
59
Tied-274th
Turnovers
6
Tied-279th
3-Point Field Goal Percentage
55.0
12th
3-Point Field Goals Attempted
20
Tied-258th
3-Point Field Goals Made
11
Tied-202nd
True Shooting Percentage
69.0
—
Total Turnovers
6
—
Assist Ratio
31.1
—
Points in the Paint
0
Tied-1st
Offensive Rebound Rate
0.0
—
Turnover Ratio
8.5
—
Brick Index
0.00
—
Usage Rate
0.0
—
Average Field Goals Made
2.2
—
Average Field Goals Attempted
4.1
168th
Average 3-Point Field Goals Made
1.1
—
Average 3-Point Field Goals Attempted
2.0
Tied-218th
Average Free Throws Made
0.4
—
Average Free Throws Attempted
0.4
Tied-266th
Points Per Game
5.9
229th
Offensive Rebounds Per Game
0.9
148th
Assists Per Game
2.2
131st
Turnovers Per Game
0.6
234th
Offensive Rebound Percentage
0.5
—
Estimated Possessions
39.6
—
Estimated Possessions Per Game
4.0
—
Points Per Estimated Possession
1.5
—
Team Turnovers Per Game
0.0
—
Total Turnovers Per Game
0.6
—
3-Point Field Goal Percentage
55.0
—
2-Point Field Goals Made
11.0
Tied-62nd
2-Point Field Goals Attempted
21.0
Tied-34th
2-Point Field Goals Made per Game
1.1
—
2-Point Field Goals Attempted per Game
2.1
—
2-Point Field Goal Percentage
52.4
—
Shooting Efficiency
0.67
—
Scoring Efficiency
1.439
—
Fieldgoals Made Per 48
4.9
3,168th
Fieldgoals Attempted Per 48
9.1
3,504th
3-Point Fieldgoals Made Per 48
2.4
2,424th
3-Point Fieldgoals Attempted Per 48
4.4
3,096th
Freethrows Made Per 48
0.9
3,744th
Freethrows Attempted Per 48
0.9
4,056th
Points Scored Per 48
13.1
3,288th
Offensive Rebounds Per 48
2.0
2,364th
Assists Per 48
4.9
2,112th
Turnovers
1.3
3,348th
P/40
10.9
—
A/40
4.1
—
04 / EFFICIENCY, SHOOTING PROFILE, PER-36
Advanced metrics
True shooting %69.0%
Effective FG %67.1%
2-point FG %52.4%
3-point attempt rate48.8%
Free throw rate9.8%
Points per shot attempt1.44
% of points from 3s55.9%
Assist-to-turnover3.67
Points per 36 min9.8
Rebounds per 36 min5.2
Assists per 36 min3.7
Steals per 36 min1.33
Blocks per 36 min0.00
Turnovers per 36 min1.00
Stocks (STL + BLK) per game0.80
Pts + Reb + Ast per game11.2
Efficiency (EFF) per game9.5
Game Score per game (Hollinger)6.0
Minutes per game21.6
Calculated by BallersCulture from the supplied 2026-27 box-score totals using standard formulas (hover a tile to see the formula). Tracking-based metrics such as BPM, VORP, on/off and RAPTOR are not available from this data source.
05 / 10 GAMES IN 2026-27
Game log: Regular season
Date
Opp
Result
MIN
FG
FG%
3PT
3P%
FT
FT%
REB
AST
BLK
STL
PF
TO
PTS
Nov 16
@ BOS
L 131-94
34
4-8
50.0
4-5
80.0
0-0
0.0
5
5
0
2
1
1
12
Nov 15
@ CLE
L 127-117
33
6-7
85.7
1-2
50.0
2-2
100.0
8
3
0
1
4
1
15
Nov 13
@ MIN
L 133-94
21
3-6
50.0
1-3
33.3
0-0
0.0
2
5
0
2
1
1
7
Nov 10
vs IND
W 125-122
19
0-2
0.0
0-0
0.0
0-0
0.0
3
5
0
1
1
0
0
Nov 9
vs BKN
W 130-93
19
1-3
33.3
0-0
0.0
0-0
0.0
2
2
0
0
3
1
2
Nov 7
vs UTAH
W 112-100
11
0-1
0.0
0-1
0.0
0-0
0.0
0
0
0
0
2
0
0
Nov 5
@ SA
L 112-111
20
0-0
0.0
0-0
0.0
0-0
0.0
3
2
0
1
4
0
0
Nov 3
vs SAC
L 115-100
21
1-3
33.3
1-2
50.0
2-2
100.0
6
0
0
0
1
1
5
Oct 31
vs HOU
W 116-111
25
3-5
60.0
2-3
66.7
0-0
0.0
0
0
0
0
5
0
8
Oct 29
vs OKC
W 120-96
14
4-6
66.7
2-4
50.0
0-0
0.0
2
0
0
1
1
1
10
06 / 2026-27 HOME / AWAY, RESULTS, MONTHS AND OPPONENTS
Splits
split
Split
GP
MIN
FG
FG%
3PT
3P%
FT
FT%
OR
DR
REB
AST
BLK
STL
PF
TO
PTS
All Splits
10
21.6
2.2-4.1
53.7
1.1-2.0
55.0
0.4-0.4
100.0
0.9
2.2
3.1
2.2
0.0
0.8
2.3
0.6
5.9
Home
6
18.2
1.5-3.3
45.0
0.8-1.7
50.0
0.3-0.3
100.0
0.5
1.7
2.2
1.2
0.0
0.3
2.2
0.5
4.2
Road
4
26.8
3.3-5.3
61.9
1.5-2.5
60.0
0.5-0.5
100.0
1.5
3.0
4.5
3.8
0.0
1.5
2.5
0.8
8.5
vs. Division
2
22.5
1.5-2.5
60.0
1.0-1.5
66.7
0.0-0.0
0.0
0.5
1.0
1.5
1.0
0.0
0.5
4.5
0.0
4.0
vs. Conference
6
18.7
1.8-3.5
52.4
1.0-2.2
46.2
0.3-0.3
100.0
0.5
1.7
2.2
1.2
0.0
0.7
2.3
0.5
5.0
3+ Days Rest
1
14.0
4.0-6.0
66.7
2.0-4.0
50.0
0.0-0.0
0.0
1.0
1.0
2.0
0.0
0.0
1.0
1.0
1.0
10.0
Month
Split
GP
MIN
FG
FG%
3PT
3P%
FT
FT%
OR
DR
REB
AST
BLK
STL
PF
TO
PTS
October
2
19.5
3.5-5.5
63.6
2.0-3.5
57.1
0.0-0.0
0.0
0.5
0.5
1.0
0.0
0.0
0.5
3.0
0.5
9.0
November
8
22.1
1.9-3.8
50.0
0.9-1.6
53.8
0.5-0.5
100.0
1.0
2.6
3.6
2.8
0.0
0.9
2.1
0.6
5.1
Pre All-Star
10
21.6
2.2-4.1
53.7
1.1-2.0
55.0
0.4-0.4
100.0
0.9
2.2
3.1
2.2
0.0
0.8
2.3
0.6
5.9
Result
Split
GP
MIN
FG
FG%
3PT
3P%
FT
FT%
OR
DR
REB
AST
BLK
STL
PF
TO
PTS
Wins
5
17.6
1.6-3.4
47.1
0.8-1.6
50.0
0.0-0.0
0.0
0.4
1.0
1.4
1.4
0.0
0.4
2.4
0.4
4.0
Losses
5
25.6
2.8-4.8
58.3
1.4-2.4
58.3
0.8-0.8
100.0
1.4
3.4
4.8
3.0
0.0
1.2
2.2
0.8
7.8
Position
Split
GP
MIN
FG
FG%
3PT
3P%
FT
FT%
OR
DR
REB
AST
BLK
STL
PF
TO
PTS
As Starter
7
22.6
2.1-4.3
50.0
1.0-1.9
53.8
0.6-0.6
100.0
1.0
2.7
3.7
2.9
0.0
0.9
1.9
0.7
5.9
Day
Split
GP
MIN
FG
FG%
3PT
3P%
FT
FT%
OR
DR
REB
AST
BLK
STL
PF
TO
PTS
Monday
2
20.0
0.5-2.5
20.0
0.5-1.0
50.0
1.0-1.0
100.0
0.5
4.0
4.5
2.5
0.0
0.5
1.0
0.5
2.5
Wednesday
2
16.5
2.0-3.0
66.7
1.0-2.0
50.0
0.0-0.0
0.0
1.0
1.5
2.5
1.0
0.0
1.0
2.5
0.5
5.0
Thursday
1
21.0
3.0-6.0
50.0
1.0-3.0
33.3
0.0-0.0
0.0
0.0
2.0
2.0
5.0
0.0
2.0
1.0
1.0
7.0
Friday
2
18.0
1.5-3.0
50.0
1.0-2.0
50.0
0.0-0.0
0.0
0.0
0.0
0.0
0.0
0.0
0.0
3.5
0.0
4.0
Saturday
1
33.0
6.0-7.0
85.7
1.0-2.0
50.0
2.0-2.0
100.0
3.0
5.0
8.0
3.0
0.0
1.0
4.0
1.0
15.0
Sunday
2
26.5
2.5-5.5
45.5
2.0-2.5
80.0
0.0-0.0
0.0
1.5
2.0
3.5
3.5
0.0
1.0
2.0
1.0
7.0
Opponent
Split
GP
MIN
FG
FG%
3PT
3P%
FT
FT%
OR
DR
REB
AST
BLK
STL
PF
TO
PTS
Brooklyn Nets
1
19.0
1.0-3.0
33.3
0.0-0.0
0.0
0.0-0.0
0.0
1.0
1.0
2.0
2.0
0.0
0.0
3.0
1.0
2.0
Boston Celtics
1
34.0
4.0-8.0
50.0
4.0-5.0
80.0
0.0-0.0
0.0
2.0
3.0
5.0
5.0
0.0
2.0
1.0
1.0
12.0
Cleveland Cavaliers
1
33.0
6.0-7.0
85.7
1.0-2.0
50.0
2.0-2.0
100.0
3.0
5.0
8.0
3.0
0.0
1.0
4.0
1.0
15.0
Houston Rockets
1
25.0
3.0-5.0
60.0
2.0-3.0
66.7
0.0-0.0
0.0
0.0
0.0
0.0
0.0
0.0
0.0
5.0
0.0
8.0
Indiana Pacers
1
19.0
0.0-2.0
0.0
0.0-0.0
0.0
0.0-0.0
0.0
0.0
3.0
3.0
5.0
0.0
1.0
1.0
0.0
0.0
Minnesota Timberwolves
1
21.0
3.0-6.0
50.0
1.0-3.0
33.3
0.0-0.0
0.0
0.0
2.0
2.0
5.0
0.0
2.0
1.0
1.0
7.0
San Antonio Spurs
1
20.0
0.0-0.0
0.0
0.0-0.0
0.0
0.0-0.0
0.0
1.0
2.0
3.0
2.0
0.0
1.0
4.0
0.0
0.0
Sacramento Kings
1
21.0
1.0-3.0
33.3
1.0-2.0
50.0
2.0-2.0
100.0
1.0
5.0
6.0
0.0
0.0
0.0
1.0
1.0
5.0
Oklahoma City Thunder
1
14.0
4.0-6.0
66.7
2.0-4.0
50.0
0.0-0.0
0.0
1.0
1.0
2.0
0.0
0.0
1.0
1.0
1.0
10.0
Utah Jazz
1
11.0
0.0-1.0
0.0
0.0-1.0
0.0
0.0-0.0
0.0
0.0
0.0
0.0
0.0
0.0
0.0
2.0
0.0
0.0
07 / SEASON-BY-SEASON HISTORY
Career statistics
Regular Season Averages
Season
Team
GP
GS
MIN
FG
FG%
3PT
3P%
FT
FT%
OR
DR
REB
AST
BLK
STL
PF
TO
PTS
2019-20
Charlotte Hornets
18
1
17.6
2.1-4.7
44.0
1.1-2.1
54.1
0.9-1.2
81.0
0.6
1.6
2.1
1.3
0.4
0.7
1.8
0.8
6.2
2020-21
Charlotte Hornets
53
3
15.4
1.8-4.8
37.5
0.6-2.4
24.8
0.8-1.2
64.1
0.6
2.1
2.7
1.3
0.2
0.7
1.2
0.6
5.0
2021-22
Miami Heat
60
12
22.9
3.5-6.8
50.7
1.1-2.6
41.3
1.2-1.6
76.3
1.2
2.7
3.8
1.1
0.5
1.0
1.7
0.9
9.2
2022-23
Miami Heat
71
49
29.3
3.6-7.7
46.3
1.2-3.3
35.6
1.3-1.6
80.5
1.2
3.6
4.8
1.6
0.4
1.0
2.0
1.1
9.6
2023-24
Miami Heat
64
23
27.5
3.8-8.7
43.1
1.3-3.6
34.9
1.2-1.5
77.8
1.2
3.2
4.4
2.2
0.5
0.7
2.0
1.2
10.0
2024-25
Philadelphia 76ers
31
24
30.4
3.3-7.5
43.5
1.1-2.8
37.9
1.5-2.4
62.2
1.4
3.0
4.4
2.2
0.6
1.1
2.0
1.4
9.1
2024-25
Dallas Mavericks
14
0
19.6
2.0-5.1
38.9
0.3-1.1
25.0
1.1-1.7
62.5
0.7
2.2
2.9
1.9
0.2
0.9
1.7
0.9
5.4
2024-25
2024 25 Totals
45
24
27.1
2.9-6.8
42.4
0.8-2.3
35.9
1.4-2.2
62.2
1.2
2.8
3.9
2.1
0.5
1.0
1.9
1.2
7.9
2025-26
Dallas Mavericks
58
12
14.8
1.5-3.3
45.0
0.3-1.0
35.1
0.6-1.1
60.7
0.5
2.0
2.5
1.4
0.3
0.7
1.5
0.7
3.9
2026-27
Dallas Mavericks
10
7
21.6
2.2-4.1
53.7
1.1-2.0
55.0
0.4-0.4
100.0
0.9
2.2
3.1
2.2
0.0
0.8
2.3
0.6
5.9
Career
—
379
131
22.8
2.8-6.3
44.8
0.9-2.5
36.1
1.1-1.5
72.2
1.0
2.7
3.7
1.6
0.4
0.8
1.8
0.9
7.6
Regular Season Totals
Season
Team
FG
FG%
3PT
3P%
FT
FT%
OR
DR
REB
AST
BLK
STL
PF
TO
PTS
2019-20
Charlotte Hornets
37-84
44.0
20-37
54.1
17-21
81.0
10
28
38
23
7
12
32
15
111
2020-21
Charlotte Hornets
96-256
37.5
31-125
24.8
41-64
64.1
31
110
141
67
12
37
62
33
264
2021-22
Miami Heat
208-410
50.7
64-155
41.3
71-93
76.3
70
160
230
64
30
58
104
52
551
2022-23
Miami Heat
254-548
46.3
84-236
35.6
91-113
80.5
88
256
344
117
31
71
145
79
683
2023-24
Miami Heat
241-559
43.1
81-232
34.9
77-99
77.8
74
207
281
143
29
47
126
77
640
2024-25
Philadelphia 76ers
101-232
43.5
33-87
37.9
46-74
62.2
43
93
136
69
20
34
63
43
281
2024-25
Dallas Mavericks
28-72
38.9
4-16
25.0
15-24
62.5
10
31
41
26
3
12
24
13
75
2024-25
2024 25 Totals
129-304
42.4
37-103
35.9
61-98
62.2
53
124
177
95
23
46
87
56
356
2025-26
Dallas Mavericks
85-189
45.0
20-57
35.1
37-61
60.7
28
115
143
81
15
40
86
40
227
2026-27
Dallas Mavericks
22-41
53.7
11-20
55.0
4-4
100.0
9
22
31
22
0
8
23
6
59
Career
—
1072-2391
44.8
348-965
36.1
399-553
72.2
363
1022
1385
612
147
319
665
358
2891
Regular Season Misc Totals
Season
Team
DD2
TD3
DQ
EJECT
TECH
FLAG
AST/TO
STL/TO
SC-EFF
SH-EFF
2019-20
Charlotte Hornets
0
0
1
0
0
0
1.5
0.8
1.321
0.56
2020-21
Charlotte Hornets
1
0
0
1
3
0
2.0
1.1
1.031
0.44
2021-22
Miami Heat
1
0
0
0
1
1
1.2
1.1
1.344
0.59
2022-23
Miami Heat
2
0
0
1
2
0
1.5
0.9
1.246
0.54
2023-24
Miami Heat
2
0
1
0
2
1
1.9
0.6
1.145
0.50
2024-25
Philadelphia 76ers
1
0
0
0
3
0
1.6
0.8
1.211
0.51
2024-25
Dallas Mavericks
0
0
0
0
0
0
2.0
0.9
1.042
0.42
2024-25
2024 25 Totals
1
0
0
0
3
0
1.7
0.8
1.171
0.49
2025-26
Dallas Mavericks
0
0
1
0
1
0
2.0
1.0
1.201
0.50
2026-27
Dallas Mavericks
0
0
0
0
1
0
3.7
1.3
1.439
0.67
Career
—
7
0
3
2
13
2
1.7
0.9
1.209
0.52
Scoring, rebounding and assist trend
08 / SHOT CHART AND ZONE SHOOTING
Shot profile
Shot-location data is not connected. Add a BALLDONTLIE GOAT-tier NBA API key in NBA Players → Settings to enable shot charts and zone shooting.
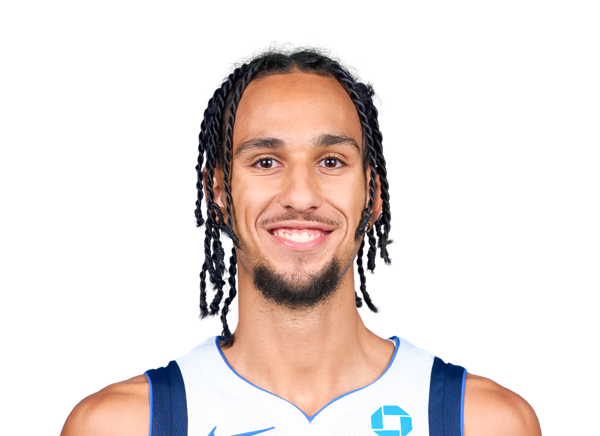
LATEST UPDATEMartin racked up 12 points (4-8 FG, 4-5 3Pt), five rebounds, five assists and two steals in 34 minutes during Sunday's 131-94 loss to the Celtics.
Martin made all four of his field goals from three-point range and contributed across several categories despite Dallas' lopsided defeat. His 34-minute workload was particularly encouraging, and while the Mavericks' inconsistent rotation makes it difficult to determine whether that level of involvement will continue, he's logged 30-plus minutes in back-to-back games. Martin has never been a particularly prolific scorer, but performances featuring contributions in rebounds, assists and steals are more likely to make him relevant in deeper fantasy formats than occasional hot shooting nights.


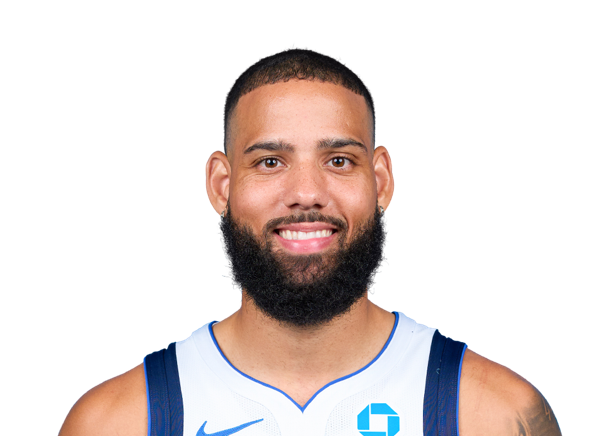

 Cooper FlaggF #32
 Daniel GaffordF #21
 Dereck Lively IIC #2
 Dwight PowellF #7
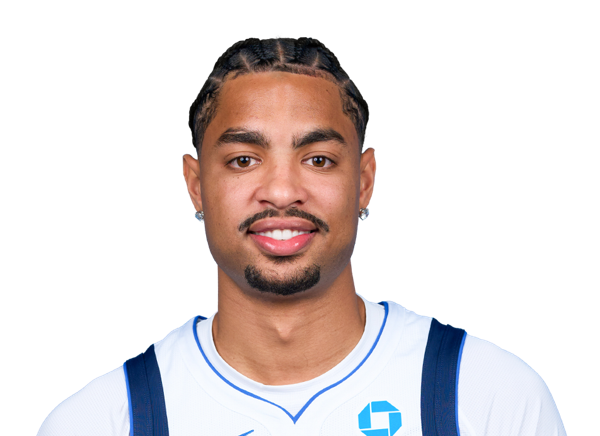 Jett HowardG #9
 John PoulakidasG #1
 Jorge Diaz-GrahamF
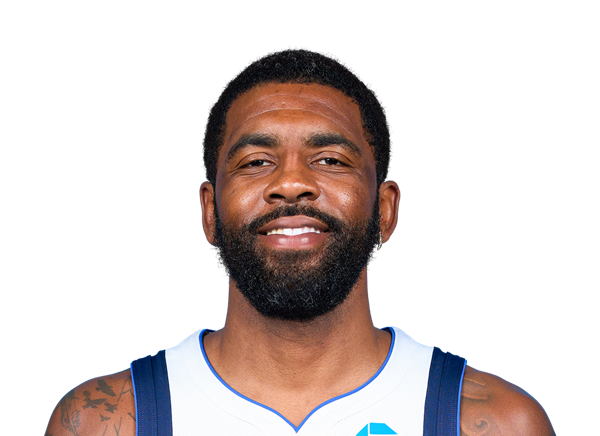 Kyrie IrvingG #11
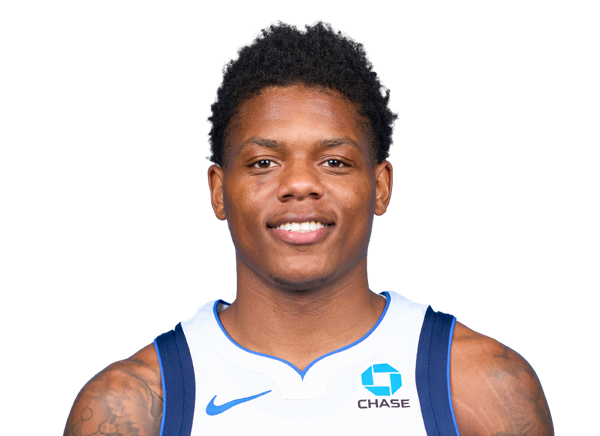 Marcus SasserG #8
 Max ChristieG
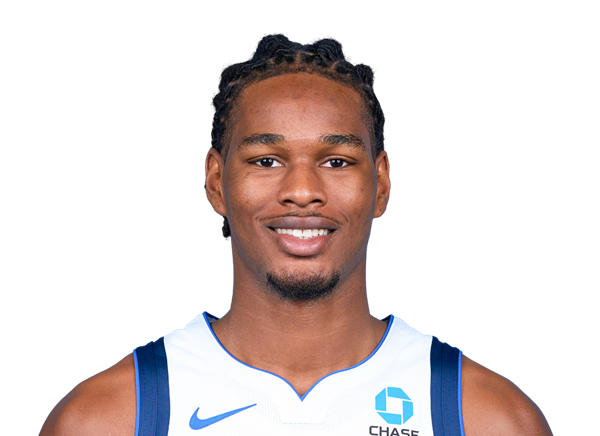 Morez Johnson Jr.F #14
 Moussa CisseC #30
 Naji MarshallF #3
 P.J. WashingtonF #25
 Quincy AcyF
 Santi AldamaF #34
 Sergio de LarreaF #55
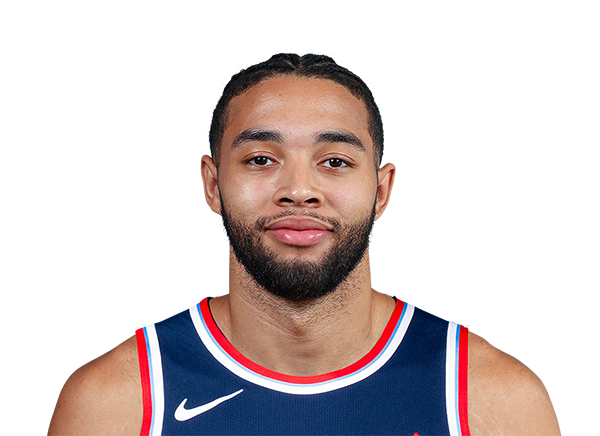 Seth LundyG #5
 Tarik BiberovicF #13
 Tobi LawalF #33
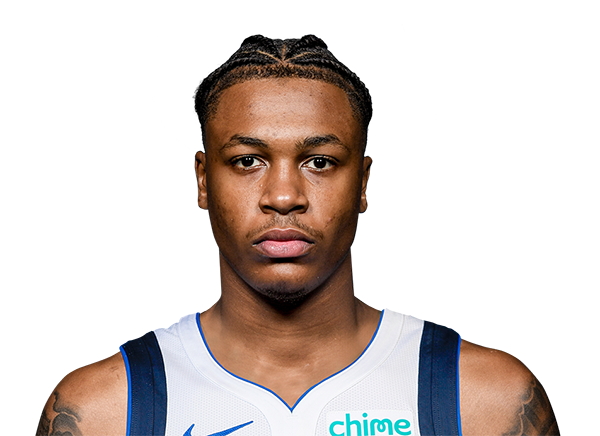 Tyler SmithF #23
 Tyson ChandlerC #6
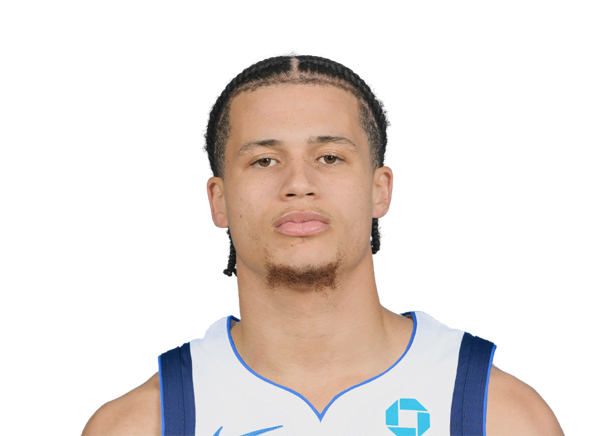 Walter Clayton Jr.G #1
 Zaccharie RisacherF #10