Click a season to open this player’s full game log, splits and advanced stats for that year; click a team to open its page. A dash means no NBA games were recorded.
03 / EVERY CATEGORY THE PROVIDER REPORTS
Full statistical breakdown
Regular season 2026-27
Defensive
Metric
Total
NBA rank
Blocks
2
Tied-232nd
Defensive Rebounds
32
Tied-170th
Steals
8
Tied-174th
Defensive Rebound Rate
0.0
—
Defensive Rebounds Per Game
2.5
Tied-175th
Blocks Per Game
0.2
Tied-217th
Steals Per Game
0.6
179th
Defensive Rebounds Per 48
6.9
2,040th
Blocks Per 48
0.4
2,784th
Steals Per 48
1.7
2,088th
General
Metric
Total
NBA rank
Disqualifications
0
Tied-22nd
Flagrant Fouls
0
Tied-24th
Fouls
20
Tied-225th
Player Efficiency Rating
13.90
157th
Rebound Rate
0.0
—
Ejections
0
Tied-7th
Technical Fouls
0
Tied-104th
Rebounds
39
—
Value Over Replacement Player
10.3
—
Minutes
222
Tied-4th
Minutes Per Game
17.1
—
Rating
15.0
Tied-82nd
Plus-Minus
+6
Tied-1st
Rebounds Per Game
3.0
Tied-193rd
Fouls Per Game
1.5
Tied-225th
Flagrant Fouls Per Game
0.0
Tied-21st
Technical Fouls Per Game
0.0
Tied-84th
Ejections Per Game
0.0
Tied-6th
Disqualifications Per Game
0.0
Tied-21st
Assist To Turnover Ratio
2.3
—
Steal To Foul Ratio
0.4
—
Block To Foul Ratio
0.1
—
Team Rebounds Per Game
0.0
—
Rebounds
39
—
Total Technical Fouls
0
—
Assist To Turnover Ratio
0.0
—
Steal To Turnover Ratio
0.4
—
Rebounds Per 48 Minutes
8.4
—
Fouls Per 48 Minutes
4.3
2,700th
Flagrant Fouls Per 48 Minutes
0.0
288th
Technical Fouls Per 48 Minutes
0.0
1,248th
Ejections Per 48 Minutes
0.0
84th
Disqualifications Per 48 Minutes
0.0
264th
R/40
7.0
—
Games Played
13
13th
Games Started
0
Tied-258th
Double Double
0
Tied-121st
Triple Double
0
Tied-13th
Offensive
Metric
Total
NBA rank
Assists
43
Tied-80th
Effective Field Goal Percentage
53.4
—
Field Goals
31/73
—
Field Goals Attempted
73
Tied-198th
Field Goals Made
31
Tied-211th
Field Goal Percentage
42.5
—
Free Throws
14/18
—
Free Throw Percentage
77.8
Tied-138th
Free Throws Attempted
18
Tied-193rd
Free Throws Made
14
Tied-185th
Offensive Rebounds
7
Tied-236th
Points
92
Tied-205th
Turnovers
19
Tied-110th
3-Point Field Goal Percentage
36.4
Tied-117th
3-Point Field Goals Attempted
44
Tied-153rd
3-Point Field Goals Made
16
Tied-141st
True Shooting Percentage
56.8
—
Total Turnovers
19
—
Assist Ratio
30.1
—
Points in the Paint
0
Tied-1st
Offensive Rebound Rate
0.0
—
Turnover Ratio
13.3
—
Brick Index
0.00
—
Usage Rate
0.0
—
Average Field Goals Made
2.4
—
Average Field Goals Attempted
5.6
235th
Average 3-Point Field Goals Made
1.2
Tied-148th
Average 3-Point Field Goals Attempted
3.4
157th
Average Free Throws Made
1.1
—
Average Free Throws Attempted
1.4
Tied-186th
Points Per Game
7.1
204th
Offensive Rebounds Per Game
0.5
Tied-220th
Assists Per Game
3.3
Tied-84th
Turnovers Per Game
1.5
115th
Offensive Rebound Percentage
0.2
—
Estimated Possessions
92.2
—
Estimated Possessions Per Game
7.1
—
Points Per Estimated Possession
1.0
—
Team Turnovers Per Game
0.0
—
Total Turnovers Per Game
1.5
—
3-Point Field Goal Percentage
36.4
99th
2-Point Field Goals Made
15.0
Tied-70th
2-Point Field Goals Attempted
29.0
Tied-45th
2-Point Field Goals Made per Game
1.2
—
2-Point Field Goals Attempted per Game
2.2
—
2-Point Field Goal Percentage
51.7
—
Shooting Efficiency
0.53
—
Scoring Efficiency
1.260
—
Fieldgoals Made Per 48
6.7
2,532nd
Fieldgoals Attempted Per 48
15.8
2,376th
3-Point Fieldgoals Made Per 48
3.5
1,692nd
3-Point Fieldgoals Attempted Per 48
9.5
1,836th
Freethrows Made Per 48
3.0
2,220th
Freethrows Attempted Per 48
3.9
2,316th
Points Scored Per 48
19.9
2,460th
Offensive Rebounds Per 48
1.5
2,832nd
Assists Per 48
9.3
960th
Turnovers
4.1
1,320th
P/40
16.6
—
A/40
7.7
—
04 / EFFICIENCY, SHOOTING PROFILE, PER-36
Advanced metrics
True shooting %57.1%
Effective FG %53.6%
2-point FG %54.5%
3-point attempt rate60.7%
Free throw rate25.0%
Points per shot attempt1.27
% of points from 3s50.7%
Assist-to-turnover2.20
Points per 36 min14.9
Rebounds per 36 min6.3
Assists per 36 min6.9
Steals per 36 min1.26
Blocks per 36 min0.42
Turnovers per 36 min3.16
Stocks (STL + BLK) per game0.80
Pts + Reb + Ast per game13.4
Efficiency (EFF) per game9.2
Game Score per game (Hollinger)6.1
Minutes per game17.1
Calculated by BallersCulture from the supplied 2026-27 box-score totals using standard formulas (hover a tile to see the formula). Tracking-based metrics such as BPM, VORP, on/off and RAPTOR are not available from this data source.
05 / 13 GAMES IN 2026-27
Game log: Regular season
Date
Opp
Result
MIN
FG
FG%
3PT
3P%
FT
FT%
REB
AST
BLK
STL
PF
TO
PTS
Nov 16
@ BOS
L 131-94
23
4-8
50.0
3-5
60.0
2-2
100.0
4
3
0
1
0
1
13
Nov 15
@ CLE
L 127-117
13
1-5
20.0
0-4
0.0
0-0
0.0
2
2
0
0
1
0
2
Nov 13
@ MIN
L 133-94
22
1-8
12.5
0-5
0.0
3-3
100.0
1
4
0
0
0
5
5
Nov 10
vs IND
W 125-122
25
2-6
33.3
1-4
25.0
1-2
50.0
6
4
1
1
1
2
6
Nov 9
vs BKN
W 130-93
16
2-3
66.7
1-2
50.0
0-0
0.0
4
6
0
2
3
2
5
Nov 7
vs UTAH
W 112-100
23
4-8
50.0
1-5
20.0
3-4
75.0
4
2
0
2
2
4
12
Nov 5
@ SA
L 112-111
21
3-9
33.3
2-5
40.0
0-0
0.0
6
5
0
0
3
0
8
Nov 3
vs SAC
L 115-100
24
6-9
66.7
4-5
80.0
4-4
100.0
1
2
0
1
0
0
20
Oct 31
vs HOU
W 116-111
9
1-4
25.0
1-2
50.0
0-0
0.0
2
1
0
0
1
3
3
Oct 29
vs OKC
W 120-96
15
0-4
0.0
0-4
0.0
0-2
0.0
2
5
0
0
3
0
0
Oct 27
@ MIA
W 113-109
17
6-7
85.7
2-2
100.0
1-1
100.0
4
4
1
0
3
2
15
Oct 25
vs SA
L 122-106
15
1-2
50.0
1-1
100.0
0-0
0.0
2
5
0
1
3
0
3
Oct 24
@ IND
W 121-105
1
0-0
0.0
0-0
0.0
0-0
0.0
1
0
0
0
0
0
0
06 / 2026-27 HOME / AWAY, RESULTS, MONTHS AND OPPONENTS
Splits
split
Split
GP
MIN
FG
FG%
3PT
3P%
FT
FT%
OR
DR
REB
AST
BLK
STL
PF
TO
PTS
All Splits
13
17.1
2.4-5.6
42.5
1.2-3.4
36.4
1.1-1.4
77.8
0.5
2.5
3.0
3.3
0.2
0.6
1.5
1.5
7.1
Home
7
17.9
2.3-5.1
44.4
1.3-3.3
39.1
1.1-1.7
66.7
0.4
2.6
3.0
3.6
0.1
1.0
1.9
1.6
7.0
Road
6
16.3
2.5-6.2
40.5
1.2-3.5
33.3
1.0-1.0
100.0
0.7
2.3
3.0
3.0
0.2
0.2
1.2
1.3
7.2
vs. Division
3
14.7
1.7-5.0
33.3
1.3-2.7
50.0
0.0-0.0
0.0
0.7
2.7
3.3
3.7
0.0
0.3
2.3
1.0
4.7
vs. Conference
7
18.1
2.3-6.3
36.4
1.3-3.9
33.3
1.4-1.9
76.9
0.7
1.9
2.6
3.4
0.0
0.6
1.7
1.7
7.3
3+ Days Rest
1
1.0
0.0-0.0
0.0
0.0-0.0
0.0
0.0-0.0
0.0
0.0
1.0
1.0
0.0
0.0
0.0
0.0
0.0
0.0
Month
Split
GP
MIN
FG
FG%
3PT
3P%
FT
FT%
OR
DR
REB
AST
BLK
STL
PF
TO
PTS
October
5
11.2
1.6-3.4
47.1
0.8-1.8
44.4
0.2-0.6
33.3
0.2
2.0
2.2
3.0
0.2
0.2
2.0
1.0
4.2
November
8
20.8
2.9-7.0
41.1
1.5-4.4
34.3
1.6-1.9
86.7
0.8
2.8
3.5
3.5
0.1
0.9
1.3
1.8
8.9
Pre All-Star
13
17.1
2.4-5.6
42.5
1.2-3.4
36.4
1.1-1.4
77.8
0.5
2.5
3.0
3.3
0.2
0.6
1.5
1.5
7.1
Result
Split
GP
MIN
FG
FG%
3PT
3P%
FT
FT%
OR
DR
REB
AST
BLK
STL
PF
TO
PTS
Wins
7
15.0
2.1-4.6
46.9
0.9-2.7
31.6
0.7-1.3
55.6
0.4
2.9
3.3
3.1
0.3
0.7
1.9
1.9
5.9
Losses
6
19.5
2.7-6.8
39.0
1.7-4.2
40.0
1.5-1.5
100.0
0.7
2.0
2.7
3.5
0.0
0.5
1.2
1.0
8.5
Day
Split
GP
MIN
FG
FG%
3PT
3P%
FT
FT%
OR
DR
REB
AST
BLK
STL
PF
TO
PTS
Monday
3
21.7
4.7-7.3
63.6
2.3-3.7
63.6
2.0-2.3
85.7
0.0
3.7
3.7
3.3
0.7
0.7
1.3
1.3
13.7
Wednesday
2
18.0
1.5-6.5
23.1
1.0-4.5
22.2
0.0-1.0
0.0
1.5
2.5
4.0
5.0
0.0
0.0
3.0
0.0
4.0
Thursday
1
22.0
1.0-8.0
12.5
0.0-5.0
0.0
3.0-3.0
100.0
1.0
0.0
1.0
4.0
0.0
0.0
0.0
5.0
5.0
Friday
3
10.7
1.7-4.0
41.7
0.7-2.3
28.6
1.0-1.3
75.0
0.3
2.0
2.3
1.0
0.0
0.7
1.0
2.3
5.0
Saturday
2
14.0
1.0-3.5
28.6
0.5-2.5
20.0
0.0-0.0
0.0
0.0
2.0
2.0
3.5
0.0
0.5
2.0
0.0
2.5
Sunday
2
19.5
3.0-5.5
54.5
2.0-3.5
57.1
1.0-1.0
100.0
1.0
3.0
4.0
4.5
0.0
1.5
1.5
1.5
9.0
Opponent
Split
GP
MIN
FG
FG%
3PT
3P%
FT
FT%
OR
DR
REB
AST
BLK
STL
PF
TO
PTS
Brooklyn Nets
1
16.0
2.0-3.0
66.7
1.0-2.0
50.0
0.0-0.0
0.0
1.0
3.0
4.0
6.0
0.0
2.0
3.0
2.0
5.0
Boston Celtics
1
23.0
4.0-8.0
50.0
3.0-5.0
60.0
2.0-2.0
100.0
1.0
3.0
4.0
3.0
0.0
1.0
0.0
1.0
13.0
Cleveland Cavaliers
1
13.0
1.0-5.0
20.0
0.0-4.0
0.0
0.0-0.0
0.0
0.0
2.0
2.0
2.0
0.0
0.0
1.0
0.0
2.0
Houston Rockets
1
9.0
1.0-4.0
25.0
1.0-2.0
50.0
0.0-0.0
0.0
0.0
2.0
2.0
1.0
0.0
0.0
1.0
3.0
3.0
Indiana Pacers
2
13.0
1.0-3.0
33.3
0.5-2.0
25.0
0.5-1.0
50.0
0.0
3.5
3.5
2.0
0.5
0.5
0.5
1.0
3.0
Miami Heat
1
17.0
6.0-7.0
85.7
2.0-2.0
100.0
1.0-1.0
100.0
0.0
4.0
4.0
4.0
1.0
0.0
3.0
2.0
15.0
Minnesota Timberwolves
1
22.0
1.0-8.0
12.5
0.0-5.0
0.0
3.0-3.0
100.0
1.0
0.0
1.0
4.0
0.0
0.0
0.0
5.0
5.0
San Antonio Spurs
2
18.0
2.0-5.5
36.4
1.5-3.0
50.0
0.0-0.0
0.0
1.0
3.0
4.0
5.0
0.0
0.5
3.0
0.0
5.5
Sacramento Kings
1
24.0
6.0-9.0
66.7
4.0-5.0
80.0
4.0-4.0
100.0
0.0
1.0
1.0
2.0
0.0
1.0
0.0
0.0
20.0
Oklahoma City Thunder
1
15.0
0.0-4.0
0.0
0.0-4.0
0.0
0.0-2.0
0.0
1.0
1.0
2.0
5.0
0.0
0.0
3.0
0.0
0.0
Utah Jazz
1
23.0
4.0-8.0
50.0
1.0-5.0
20.0
3.0-4.0
75.0
1.0
3.0
4.0
2.0
0.0
2.0
2.0
4.0
12.0
07 / SEASON-BY-SEASON HISTORY
Career statistics
Regular Season Averages
Season
Team
GP
GS
MIN
FG
FG%
3PT
3P%
FT
FT%
OR
DR
REB
AST
BLK
STL
PF
TO
PTS
2025-26
Utah Jazz
45
0
18.0
2.3-5.7
39.8
1.0-3.2
30.8
1.3-1.4
93.5
0.3
1.6
2.0
3.2
0.3
0.5
1.7
1.3
6.8
2025-26
Memphis Grizzlies
24
6
25.0
3.1-8.5
36.6
1.3-4.2
30.7
2.1-2.5
86.4
0.4
1.7
2.1
5.7
0.3
0.8
1.7
2.5
9.7
2025-26
2025 26 Totals
69
6
20.4
2.6-6.7
38.4
1.1-3.5
30.7
1.6-1.8
90.1
0.4
1.7
2.0
4.0
0.3
0.6
1.7
1.7
7.8
2026-27
Dallas Mavericks
13
0
17.1
2.4-5.6
42.5
1.2-3.4
36.4
1.1-1.4
77.8
0.5
2.5
3.0
3.3
0.2
0.6
1.5
1.5
7.1
Career
—
82
6
19.9
2.5-6.5
39.0
1.1-3.5
31.6
1.5-1.7
88.5
0.4
1.8
2.2
3.9
0.3
0.6
1.7
1.6
7.7
Regular Season Totals
Season
Team
FG
FG%
3PT
3P%
FT
FT%
OR
DR
REB
AST
BLK
STL
PF
TO
PTS
2025-26
Utah Jazz
102-256
39.8
44-143
30.8
58-62
93.5
15
73
88
143
12
24
78
57
306
2025-26
Memphis Grizzlies
75-205
36.6
31-101
30.7
51-59
86.4
10
41
51
136
7
20
41
59
232
2025-26
2025 26 Totals
177-461
38.4
75-244
30.7
109-121
90.1
25
114
139
279
19
44
119
116
538
2026-27
Dallas Mavericks
31-73
42.5
16-44
36.4
14-18
77.8
7
32
39
43
2
8
20
19
92
Career
—
208-534
39.0
91-288
31.6
123-139
88.5
32
146
178
322
21
52
139
135
630
Regular Season Misc Totals
Season
Team
DD2
TD3
DQ
EJECT
TECH
FLAG
AST/TO
STL/TO
SC-EFF
SH-EFF
2025-26
Utah Jazz
0
0
0
0
0
0
2.5
0.4
1.195
0.48
2025-26
Memphis Grizzlies
1
0
0
0
0
0
2.3
0.3
1.132
0.44
2025-26
2025 26 Totals
1
0
0
0
0
0
2.4
0.4
1.167
0.47
2026-27
Dallas Mavericks
0
0
0
0
0
0
2.3
0.4
1.260
0.53
Career
—
1
0
0
0
0
0
2.4
0.4
1.180
0.47
Scoring, rebounding and assist trend
08 / SHOT CHART AND ZONE SHOOTING
Shot profile
Shot-location data is not connected. Add a BALLDONTLIE GOAT-tier NBA API key in NBA Players → Settings to enable shot charts and zone shooting.
LATEST UPDATEClayton (ankle) is listed as probable for Wednesday's game against the Warriors.
Clayton has only missed one game this season, and that's not expected to change Wednesday versus Golden State. The 23-year-old is coming off a strong showing, amassing 13 points, four rebounds, three assists and one steal in Sunday's 131-94 loss to Boston. Clayton also logged 23 minutes, though he might not play as much Wednesday with Kyrie Irving (knee) off the injury report.


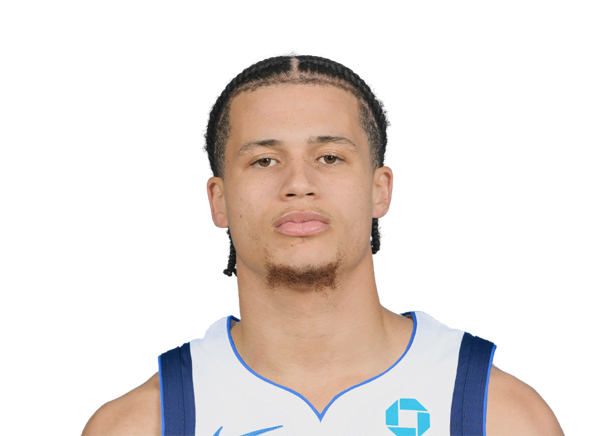

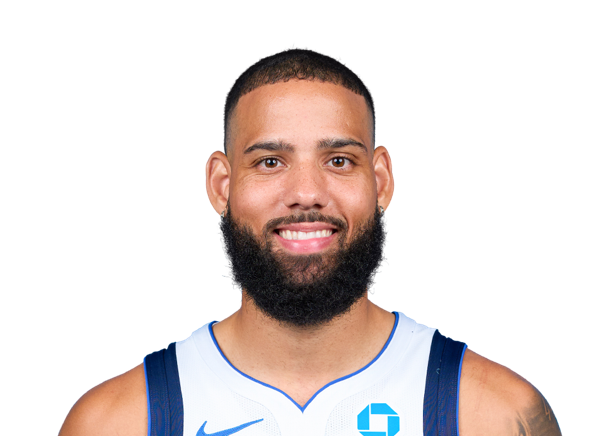 Caleb MartinF #16
 Cooper FlaggF #32
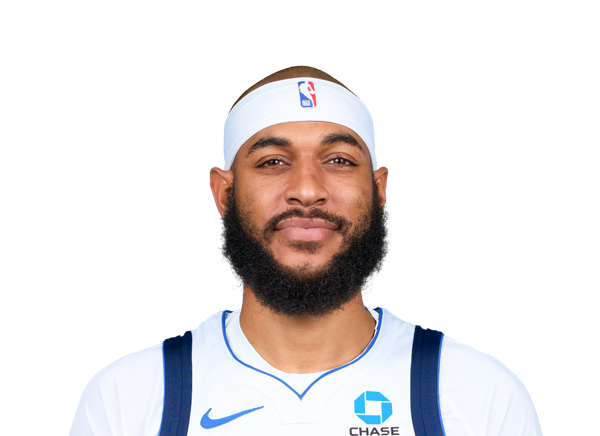 Daniel GaffordF #21
 Dereck Lively IIC #2
 Dwight PowellF #7
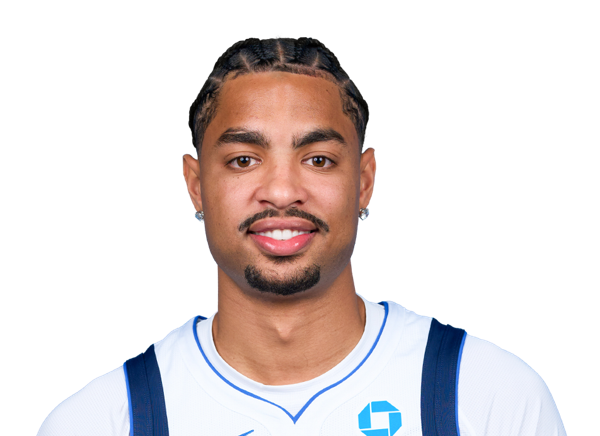 Jett HowardG #9
 John PoulakidasG #1
 Jorge Diaz-GrahamF
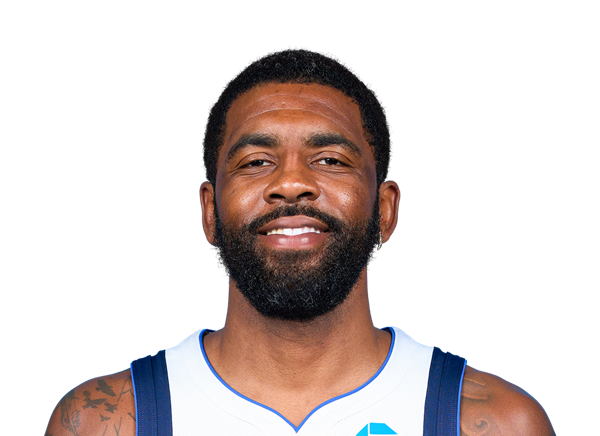 Kyrie IrvingG #11
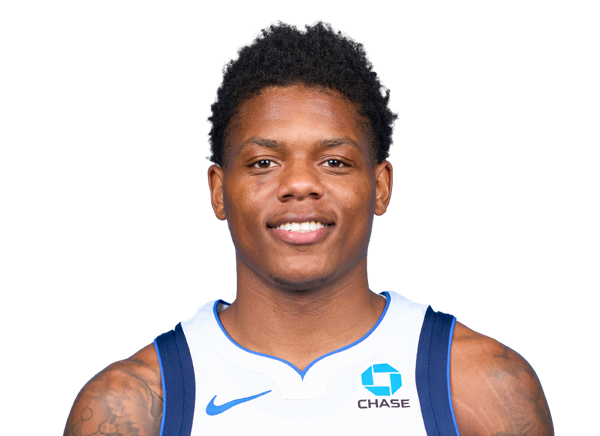 Marcus SasserG #8
 Max ChristieG
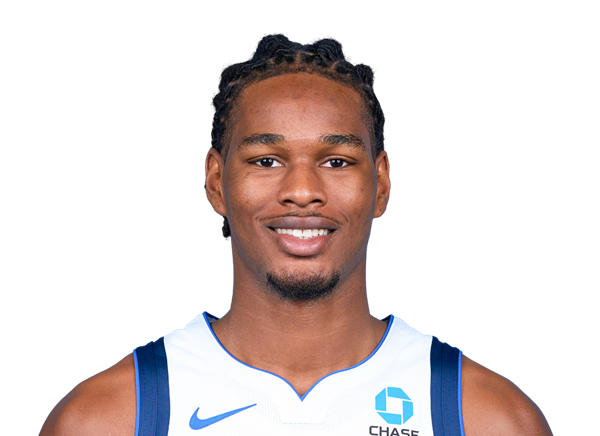 Morez Johnson Jr.F #14
 Moussa CisseC #30
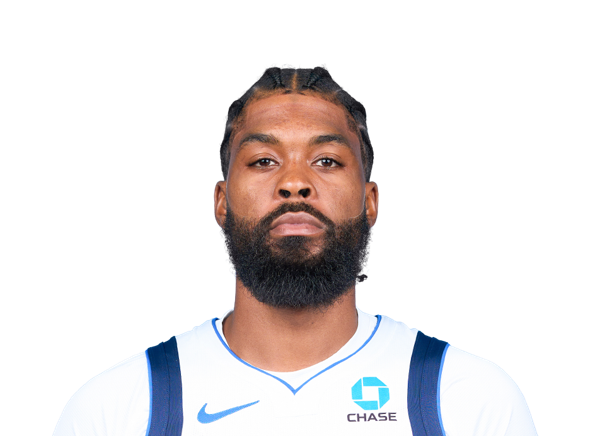 Naji MarshallF #3
 P.J. WashingtonF #25
 Quincy AcyF
 Santi AldamaF #34
 Sergio de LarreaF #55
 Seth LundyG #5
 Tarik BiberovicF #13
 Tobi LawalF #33
 Tyler SmithF #23
 Tyson ChandlerC #6
 Zaccharie RisacherF #10