


BALLERSCULTURE PLAYER PROFILE · 2026-27
Tyson Chandler
Dallas Mavericks · C • #6 • 7' 0" 235 lbs

01 / 2026-27 PER-GAME AVERAGES
Season snapshot
No regular-season 2026-27 statistics are recorded for this player. Career history is shown further down.
02 / EVERY SEASON SINCE 2022-23, SIDE BY SIDE
2022-23 to 2026-27
Per game
| Season | Team | GP | GS | MIN | PTS | REB | AST | STL | BLK | TO | FG% | 3P% | FT% |
|---|---|---|---|---|---|---|---|---|---|---|---|---|---|
| 2022-23 | — | — | — | — | — | — | — | — | — | — | — | — | — |
| 2023-24 | — | — | — | — | — | — | — | — | — | — | — | — | — |
| 2024-25 | — | — | — | — | — | — | — | — | — | — | — | — | — |
| 2025-26 | — | — | — | — | — | — | — | — | — | — | — | — | — |
| 2026-27 | — | — | — | — | — | — | — | — | — | — | — | — | — |
Season totals
| Season | Team | GP | GS | MIN | PTS | REB | AST | STL | BLK | TO | FG% | 3P% | FT% |
|---|---|---|---|---|---|---|---|---|---|---|---|---|---|
| 2022-23 | — | — | — | — | — | — | — | — | — | — | — | — | — |
| 2023-24 | — | — | — | — | — | — | — | — | — | — | — | — | — |
| 2024-25 | — | — | — | — | — | — | — | — | — | — | — | — | — |
| 2025-26 | — | — | — | — | — | — | — | — | — | — | — | — | — |
| 2026-27 | — | — | — | — | — | — | — | — | — | — | — | — | — |
Click a season to open this player’s full game log, splits and advanced stats for that year; click a team to open its page. A dash means no NBA games were recorded.
03 / SEASON-BY-SEASON HISTORY
Career statistics
Regular Season Averages
| Season | Team | GP | GS | MIN | FG | FG% | 3PT | 3P% | FT | FT% | OR | DR | REB | AST | BLK | STL | PF | TO | PTS |
|---|---|---|---|---|---|---|---|---|---|---|---|---|---|---|---|---|---|---|---|
| 2001-02 | Chicago Bulls | 71 | 31 | 19.6 | 2.1-4.3 | 49.7 | 0.0-0.0 | 0.0 | 1.9-3.1 | 60.4 | 1.6 | 3.2 | 4.8 | 0.8 | 1.3 | 0.4 | 2.5 | 1.4 | 6.1 |
| 2002-03 | Chicago Bulls | 75 | 68 | 24.4 | 3.4-6.5 | 53.1 | 0.0-0.0 | 0.0 | 2.4-3.9 | 60.8 | 2.3 | 4.6 | 6.9 | 1.0 | 1.4 | 0.5 | 2.9 | 1.8 | 9.2 |
| 2003-04 | Chicago Bulls | 35 | 8 | 22.3 | 1.9-4.5 | 42.4 | 0.0-0.0 | 0.0 | 2.3-3.4 | 66.9 | 2.3 | 5.4 | 7.7 | 0.7 | 1.2 | 0.5 | 2.5 | 1.1 | 6.1 |
| 2004-05 | Chicago Bulls | 80 | 10 | 27.4 | 2.6-5.2 | 49.4 | 0.0-0.0 | 0.0 | 2.8-4.2 | 67.3 | 3.3 | 6.4 | 9.7 | 0.8 | 1.8 | 0.9 | 3.4 | 1.5 | 8.0 |
| 2005-06 | Chicago Bulls | 79 | 50 | 26.8 | 2.0-3.6 | 56.5 | 0.0-0.0 | 0.0 | 1.2-2.4 | 50.3 | 3.4 | 5.7 | 9.0 | 1.0 | 1.3 | 0.5 | 3.8 | 1.6 | 5.3 |
| 2006-07 | Nooklahoma City Hornets | 73 | 73 | 34.6 | 4.0-6.4 | 62.4 | 0.0-0.0 | 0.0 | 1.5-2.8 | 52.7 | 4.4 | 8.0 | 12.4 | 0.9 | 1.8 | 0.5 | 3.3 | 1.7 | 9.5 |
| 2007-08 | New Orleans Hornets | 79 | 79 | 35.2 | 4.8-7.7 | 62.3 | 0.0-0.0 | 0.0 | 2.2-3.7 | 59.3 | 4.1 | 7.7 | 11.7 | 1.0 | 1.1 | 0.6 | 3.1 | 1.7 | 11.8 |
| 2008-09 | New Orleans Hornets | 45 | 45 | 32.1 | 3.6-6.3 | 56.5 | 0.0-0.0 | 0.0 | 1.7-3.0 | 57.9 | 3.6 | 5.1 | 8.7 | 0.5 | 1.2 | 0.3 | 3.2 | 1.6 | 8.8 |
| 2009-10 | Charlotte Bobcats | 51 | 27 | 22.8 | 2.1-3.7 | 57.4 | 0.0-0.0 | 0.0 | 2.3-3.1 | 73.2 | 2.2 | 4.0 | 6.3 | 0.3 | 1.1 | 0.3 | 2.7 | 1.8 | 6.5 |
| 2010-11 | Dallas Mavericks | 74 | 74 | 27.8 | 3.6-5.5 | 65.4 | 0.0-0.0 | 0.0 | 2.9-4.0 | 73.2 | 2.8 | 6.6 | 9.4 | 0.4 | 1.1 | 0.5 | 3.2 | 1.2 | 10.1 |
| 2011-12 | New York Knicks | 62 | 62 | 33.2 | 3.9-5.7 | 67.9 | 0.0-0.0 | 0.0 | 3.5-5.1 | 68.9 | 3.4 | 6.5 | 9.9 | 0.9 | 1.4 | 0.9 | 3.0 | 1.6 | 11.3 |
| 2012-13 | New York Knicks | 66 | 66 | 32.8 | 3.9-6.1 | 63.7 | 0.0-0.0 | 0.0 | 2.7-3.9 | 69.4 | 4.1 | 6.6 | 10.7 | 0.9 | 1.1 | 0.6 | 2.8 | 1.3 | 10.4 |
| 2013-14 | New York Knicks | 55 | 55 | 30.2 | 3.5-5.9 | 59.3 | 0.0-0.0 | 0.0 | 1.8-2.8 | 63.2 | 2.9 | 6.7 | 9.6 | 1.1 | 1.1 | 0.7 | 2.6 | 1.3 | 8.7 |
| 2014-15 | Dallas Mavericks | 75 | 75 | 30.5 | 3.9-5.9 | 66.6 | 0.0-0.0 | 0.0 | 2.5-3.4 | 72.0 | 3.9 | 7.6 | 11.5 | 1.1 | 1.2 | 0.6 | 2.3 | 1.4 | 10.3 |
| 2015-16 | Phoenix Suns | 66 | 60 | 24.5 | 2.8-4.8 | 58.3 | 0.0-0.0 | 0.0 | 1.6-2.6 | 62.0 | 2.7 | 6.1 | 8.7 | 1.0 | 0.7 | 0.5 | 2.2 | 1.4 | 7.2 |
| 2016-17 | Phoenix Suns | 47 | 46 | 27.6 | 3.3-4.9 | 67.1 | 0.0-0.0 | 0.0 | 1.9-2.6 | 73.4 | 3.3 | 8.2 | 11.5 | 0.6 | 0.5 | 0.7 | 2.7 | 1.4 | 8.4 |
| 2017-18 | Phoenix Suns | 46 | 46 | 25.0 | 2.6-4.1 | 64.7 | 0.0-0.0 | 0.0 | 1.3-2.0 | 62.4 | 2.9 | 6.2 | 9.1 | 1.2 | 0.6 | 0.3 | 2.3 | 1.3 | 6.5 |
| 2018-19 | Phoenix Suns | 7 | 0 | 12.7 | 1.1-1.7 | 66.7 | 0.0-0.0 | 0.0 | 1.4-2.6 | 55.6 | 1.0 | 4.6 | 5.6 | 0.9 | 0.1 | 0.3 | 3.0 | 1.0 | 3.7 |
| 2018-19 | Los Angeles Lakers | 48 | 6 | 16.4 | 1.1-1.8 | 60.9 | 0.0-0.0 | 0.0 | 0.9-1.4 | 59.4 | 1.8 | 3.8 | 5.6 | 0.6 | 0.5 | 0.4 | 1.9 | 0.7 | 3.1 |
| 2018-19 | 2018 19 Totals | 55 | 6 | 15.9 | 1.1-1.8 | 61.6 | 0.0-0.0 | 0.0 | 0.9-1.6 | 58.6 | 1.7 | 3.9 | 5.6 | 0.7 | 0.4 | 0.4 | 2.0 | 0.8 | 3.1 |
| 2019-20 | Houston Rockets | 26 | 5 | 8.4 | 0.5-0.7 | 77.8 | 0.0-0.0 | 0.0 | 0.2-0.5 | 46.2 | 1.0 | 1.6 | 2.5 | 0.2 | 0.3 | 0.2 | 1.2 | 0.3 | 1.3 |
| Career | — | 1160 | 886 | 27.3 | 3.1-5.1 | 59.7 | 0.0-0.0 | 0.0 | 2.1-3.2 | 64.4 | 3.0 | 6.0 | 9.0 | 0.8 | 1.2 | 0.5 | 2.8 | 1.4 | 8.2 |
Regular Season Totals
| Season | Team | FG | FG% | 3PT | 3P% | FT | FT% | OR | DR | REB | AST | BLK | STL | PF | TO | PTS |
|---|---|---|---|---|---|---|---|---|---|---|---|---|---|---|---|---|
| 2001-02 | Chicago Bulls | 151-304 | 49.7 | 0-0 | 0.0 | 134-222 | 60.4 | 114 | 229 | 343 | 54 | 93 | 28 | 179 | 99 | 436 |
| 2002-03 | Chicago Bulls | 257-484 | 53.1 | 0-0 | 0.0 | 177-291 | 60.8 | 169 | 345 | 514 | 76 | 106 | 37 | 220 | 135 | 691 |
| 2003-04 | Chicago Bulls | 67-158 | 42.4 | 0-1 | 0.0 | 79-118 | 66.9 | 82 | 188 | 270 | 23 | 43 | 17 | 87 | 38 | 213 |
| 2004-05 | Chicago Bulls | 207-419 | 49.4 | 0-2 | 0.0 | 226-336 | 67.3 | 261 | 514 | 775 | 65 | 141 | 69 | 268 | 118 | 640 |
| 2005-06 | Chicago Bulls | 160-283 | 56.5 | 0-1 | 0.0 | 97-193 | 50.3 | 265 | 449 | 714 | 81 | 104 | 41 | 298 | 123 | 417 |
| 2006-07 | Nooklahoma City Hornets | 292-468 | 62.4 | 0-1 | 0.0 | 106-201 | 52.7 | 320 | 584 | 904 | 66 | 129 | 37 | 244 | 126 | 690 |
| 2007-08 | New Orleans Hornets | 377-605 | 62.3 | 0-1 | 0.0 | 175-295 | 59.3 | 322 | 606 | 928 | 81 | 84 | 45 | 243 | 136 | 929 |
| 2008-09 | New Orleans Hornets | 160-283 | 56.5 | 0-0 | 0.0 | 77-133 | 57.9 | 163 | 230 | 393 | 22 | 56 | 15 | 144 | 70 | 397 |
| 2009-10 | Charlotte Bobcats | 109-190 | 57.4 | 0-0 | 0.0 | 115-157 | 73.2 | 114 | 206 | 320 | 16 | 55 | 17 | 138 | 91 | 333 |
| 2010-11 | Dallas Mavericks | 266-407 | 65.4 | 0-0 | 0.0 | 216-295 | 73.2 | 206 | 486 | 692 | 32 | 80 | 36 | 240 | 88 | 748 |
| 2011-12 | New York Knicks | 241-355 | 67.9 | 0-2 | 0.0 | 217-315 | 68.9 | 212 | 400 | 612 | 56 | 89 | 56 | 186 | 102 | 699 |
| 2012-13 | New York Knicks | 255-400 | 63.7 | 0-0 | 0.0 | 179-258 | 69.4 | 269 | 434 | 703 | 62 | 75 | 42 | 188 | 87 | 689 |
| 2013-14 | New York Knicks | 191-322 | 59.3 | 0-1 | 0.0 | 98-155 | 63.2 | 159 | 370 | 529 | 59 | 63 | 36 | 145 | 71 | 480 |
| 2014-15 | Dallas Mavericks | 293-440 | 66.6 | 0-0 | 0.0 | 185-257 | 72.0 | 294 | 570 | 864 | 84 | 91 | 42 | 169 | 105 | 771 |
| 2015-16 | Phoenix Suns | 183-314 | 58.3 | 0-1 | 0.0 | 106-171 | 62.0 | 175 | 401 | 576 | 64 | 44 | 36 | 145 | 93 | 472 |
| 2016-17 | Phoenix Suns | 153-228 | 67.1 | 0-0 | 0.0 | 91-124 | 73.4 | 153 | 386 | 539 | 30 | 24 | 33 | 126 | 65 | 397 |
| 2017-18 | Phoenix Suns | 121-187 | 64.7 | 0-0 | 0.0 | 58-93 | 62.4 | 134 | 284 | 418 | 53 | 27 | 16 | 106 | 59 | 300 |
| 2018-19 | Phoenix Suns | 8-12 | 66.7 | 0-0 | 0.0 | 10-18 | 55.6 | 7 | 32 | 39 | 6 | 1 | 2 | 21 | 7 | 26 |
| 2018-19 | Los Angeles Lakers | 53-87 | 60.9 | 0-1 | 0.0 | 41-69 | 59.4 | 85 | 183 | 268 | 31 | 22 | 19 | 89 | 35 | 147 |
| 2018-19 | 2018 19 Totals | 61-99 | 61.6 | 0-1 | 0.0 | 51-87 | 58.6 | 92 | 215 | 307 | 37 | 23 | 21 | 110 | 42 | 173 |
| 2019-20 | Houston Rockets | 14-18 | 77.8 | 0-0 | 0.0 | 6-13 | 46.2 | 25 | 41 | 66 | 6 | 8 | 6 | 32 | 8 | 34 |
| Career | — | 3558-5964 | 59.7 | 0-11 | 0.0 | 2393-3714 | 64.4 | 3529 | 6938 | 10467 | 967 | 1335 | 630 | 3268 | 1656 | 9509 |
Regular Season Misc Totals
| Season | Team | DD2 | TD3 | DQ | EJECT | TECH | FLAG | AST/TO | STL/TO | SC-EFF | SH-EFF |
|---|---|---|---|---|---|---|---|---|---|---|---|
| 2001-02 | Chicago Bulls | 7 | 0 | 1 | 0 | 3 | 1 | 0.5 | 0.3 | 1.434 | 0.50 |
| 2002-03 | Chicago Bulls | 13 | 0 | 3 | 2 | 10 | 0 | 0.6 | 0.3 | 1.428 | 0.53 |
| 2003-04 | Chicago Bulls | 6 | 0 | 2 | 1 | 4 | 1 | 0.6 | 0.4 | 1.348 | 0.42 |
| 2004-05 | Chicago Bulls | 21 | 0 | 4 | 0 | 10 | 0 | 0.6 | 0.6 | 1.527 | 0.49 |
| 2005-06 | Chicago Bulls | 9 | 0 | 14 | 0 | 8 | 1 | 0.7 | 0.3 | 1.473 | 0.57 |
| 2006-07 | Nooklahoma City Hornets | 34 | 0 | 5 | 2 | 8 | 0 | 0.5 | 0.3 | 1.474 | 0.62 |
| 2007-08 | New Orleans Hornets | 38 | 0 | 4 | 1 | 10 | 0 | 0.6 | 0.3 | 1.536 | 0.62 |
| 2008-09 | New Orleans Hornets | 15 | 0 | 2 | 1 | 5 | 1 | 0.3 | 0.2 | 1.403 | 0.57 |
| 2009-10 | Charlotte Bobcats | 5 | 0 | 1 | 0 | 3 | 0 | 0.2 | 0.2 | 1.753 | 0.57 |
| 2010-11 | Dallas Mavericks | 18 | 0 | 4 | 0 | 7 | 0 | 0.4 | 0.4 | 1.838 | 0.65 |
| 2011-12 | New York Knicks | 20 | 0 | 3 | 0 | 11 | 2 | 0.5 | 0.5 | 1.969 | 0.68 |
| 2012-13 | New York Knicks | 20 | 0 | 2 | 1 | 10 | 2 | 0.7 | 0.5 | 1.723 | 0.64 |
| 2013-14 | New York Knicks | 16 | 0 | 2 | 1 | 8 | 1 | 0.8 | 0.5 | 1.491 | 0.59 |
| 2014-15 | Dallas Mavericks | 31 | 0 | 0 | 0 | 11 | 1 | 0.8 | 0.4 | 1.752 | 0.67 |
| 2015-16 | Phoenix Suns | 20 | 0 | 1 | 1 | 5 | 2 | 0.7 | 0.4 | 1.503 | 0.58 |
| 2016-17 | Phoenix Suns | 12 | 0 | 1 | 0 | 4 | 1 | 0.5 | 0.5 | 1.741 | 0.67 |
| 2017-18 | Phoenix Suns | 4 | 0 | 1 | 0 | 2 | 1 | 0.9 | 0.3 | 1.604 | 0.65 |
| 2018-19 | Phoenix Suns | 1 | 0 | 0 | 0 | 1 | 0 | 0.9 | 0.3 | 2.167 | 0.67 |
| 2018-19 | Los Angeles Lakers | 2 | 0 | 0 | 0 | 2 | 2 | 0.9 | 0.5 | 1.690 | 0.61 |
| 2018-19 | 2018 19 Totals | 3 | 0 | 0 | 0 | 3 | 2 | 0.9 | 0.5 | 1.747 | 0.62 |
| 2019-20 | Houston Rockets | 0 | 0 | 0 | 0 | 0 | 0 | 0.8 | 0.8 | 1.889 | 0.78 |
| Career | — | 292 | 0 | 50 | 10 | 122 | 16 | 0.6 | 0.4 | 1.594 | 0.60 |
Scoring, rebounding and assist trend
04 / SHOT CHART AND ZONE SHOOTING
Shot profile
Shot-location data is not connected. Add a BALLDONTLIE GOAT-tier NBA API key in NBA Players → Settings to enable shot charts and zone shooting.
05 / RECORD, TEAM STATS AND TEAMMATES
Team
Overall7-7
Home5-2
Road2-5
DIV1-3
CONF3-5
Last Ten Games5-5
Team records for 2026-27 (regular season).
Team statistics 2026-27
Defensive
| Metric | Total | Per game | NBA rank |
|---|---|---|---|
| Blocks | 78 | 5.571 | Tied-6th |
| Defensive Rebounds | 429 | 30.714 | 10th |
| Steals | 120 | 8.571 | Tied-4th |
| Points Conceded Off Turnovers | 0 | 17 | — |
| Defensive Rebound Rate | 0.0 | — | — |
| Defensive Rebounds Per Game | 30.6 | — | — |
| Blocks Per Game | 5.6 | — | — |
| Steals Per Game | 8.6 | — | — |
| Defensive Rebounds Per 48 | 0.0 | — | — |
| Blocks Per 48 | 0.0 | — | — |
| Steals Per 48 | 0.0 | — | — |
General
| Metric | Total | Per game | NBA rank |
|---|---|---|---|
| Disqualifications | 2 | — | Tied-2nd |
| Flagrant Fouls | 1 | 0.071 | Tied-8th |
| Fouls | 305 | 21.786 | 7th |
| Rebound Rate | 49.5 | — | 11th |
| Ejections | 0 | — | — |
| Technical Fouls | 10 | 0.357 | Tied-11th |
| Rebounds | 605 | 43.285 | — |
| Minutes | 0 | — | — |
| Minutes Per Game | 0.0 | — | — |
| Fantasy Rating | 0.0 | — | — |
| Rating | 207.0 | — | — |
| Plus-Minus | -1 | -1 | Tied-1st |
| Game Day of Year | 0 | — | — |
| Rebounds Per Game | 43.2 | — | — |
| Fouls Per Game | 21.8 | — | — |
| Flagrant Fouls Per Game | 0.1 | — | — |
| Technical Fouls Per Game | 0.7 | — | — |
| Ejections Per Game | 0.0 | — | — |
| Disqualifications Per Game | 0.1 | — | — |
| Assist To Turnover Ratio | 1.7 | 1.726 | — |
| Steal To Foul Ratio | 0.4 | 0.393 | — |
| Block To Foul Ratio | 0.3 | 0.256 | — |
| Team Rebounds Per Game | 0.0 | — | — |
| Rebounds | 605 | 43.285 | — |
| Total Technical Fouls | 10 | 0.357 | — |
| Assist To Turnover Ratio | 30.5 | — | — |
| Team Rebounds | 0 | — | — |
| Steal To Turnover Ratio | 0.6 | 0.566 | — |
| Rebounds Per 48 Minutes | 0.0 | — | — |
| Fouls Per 48 Minutes | 0.0 | — | — |
| Flagrant Fouls Per 48 Minutes | 0.0 | — | — |
| Technical Fouls Per 48 Minutes | 0.0 | — | — |
| Ejections Per 48 Minutes | 0.0 | — | — |
| Disqualifications Per 48 Minutes | 0.0 | — | — |
| Games Played | 14 | — | Tied-3rd |
| Games Started | 0 | — | — |
| Double Double | 0 | — | — |
| Triple Double | 0 | — | — |
Offensive
| Metric | Total | Per game | NBA rank |
|---|---|---|---|
| Assists | 366 | 26.143 | 5th |
| Effective Field Goal Percentage | 53.2 | — | 11th |
| Field Goals | 569/1237 | 0.46 | — |
| Field Goals Attempted | 1237 | 88.357 | 7th |
| Field Goals Made | 569 | 40.643 | 8th |
| Field Goal Percentage | 46.0 | 0.46 | 11th |
| Free Throws | 254/323 | 0.786 | — |
| Free Throw Percentage | 78.6 | 0.786 | 11th |
| Free Throws Attempted | 323 | 23.071 | 10th |
| Free Throws Made | 254 | 18.143 | 11th |
| Offensive Rebounds | 176 | 12.571 | 6th |
| Points | 1569 | 112.071 | 9th |
| Turnovers | 212 | 15.143 | Tied-5th |
| 3-Point Field Goal Percentage | 33.5 | 0.335 | 14th |
| 3-Point Field Goals Attempted | 528 | 37.714 | 5th |
| 3-Point Field Goals Made | 177 | 12.643 | 8th |
| True Shooting Percentage | 56.9 | — | 12th |
| Team Turnovers | 12 | — | Tied-5th |
| Total Turnovers | 224 | 15.143 | — |
| Assist Ratio | 18.6 | — | 8th |
| Points in the Paint | 654 | 46 | 8th |
| Offensive Rebound Rate | 28.6 | — | 8th |
| Turnover Ratio | 14.0 | — | 7th |
| Fast Break Points | 239 | — | — |
| Possessions | 1427 | — | 9th |
| Pace Factor | 102.1 | — | 3rd |
| Average Field Goals Made | 40.6 | — | — |
| Average Field Goals Attempted | 88.4 | — | — |
| Average 3-Point Field Goals Made | 12.6 | — | — |
| Average 3-Point Field Goals Attempted | 37.7 | — | — |
| Average Free Throws Made | 18.1 | — | — |
| Average Free Throws Attempted | 23.1 | — | — |
| Points Per Game | 112.1 | — | — |
| Offensive Rebounds Per Game | 12.6 | — | — |
| Assists Per Game | 26.1 | — | — |
| Turnovers Per Game | 15.1 | — | — |
| Offensive Rebound Percentage | 0.3 | 0.263 | — |
| Estimated Possessions | 1414.2 | 100.157 | — |
| Estimated Possessions Per Game | 101.0 | — | — |
| Points Per Estimated Possession | 1.1 | 1.119 | — |
| Team Turnovers Per Game | 0.9 | — | — |
| Total Turnovers Per Game | 16.0 | — | — |
| 3-Point Field Goal Percentage | 33.5 | 0.335 | 1st |
| 2-Point Field Goals Made | 392.0 | 28 | — |
| 2-Point Field Goals Attempted | 709.0 | 50.643 | 2nd |
| 2-Point Field Goals Made per Game | 28.0 | — | — |
| 2-Point Field Goals Attempted per Game | 50.6 | — | — |
| 2-Point Field Goal Percentage | 55.3 | 0.553 | — |
| Shooting Efficiency | 0.53 | 0.532 | — |
| Scoring Efficiency | 1.268 | 1.268 | — |
| Fieldgoals Made Per 48 | 0.0 | — | — |
| Fieldgoals Attempted Per 48 | 0.0 | — | — |
| 3-Point Fieldgoals Made Per 48 | 0.0 | — | — |
| 3-Point Fieldgoals Attempted Per 48 | 0.0 | — | — |
| Freethrows Made Per 48 | 0.0 | — | — |
| Freethrows Attempted Per 48 | 0.0 | — | — |
| Points Scored Per 48 | 0.0 | — | — |
| Offensive Rebounds Per 48 | 0.0 | — | — |
| Assists Per 48 | 0.0 | — | — |
| Turnovers | 0.0 | — | — |
Teammates
 Caleb MartinF #16
 Cooper FlaggF #32
 Daniel GaffordF #21
 Dereck Lively IIC #2
 Dwight PowellF #7
 Jett HowardG #9
 John PoulakidasG #1
 Jorge Diaz-GrahamF
 Kyrie IrvingG #11
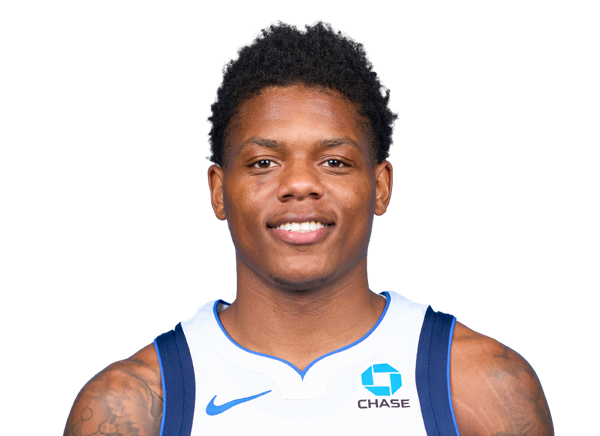 Marcus SasserG #8
 Max ChristieG
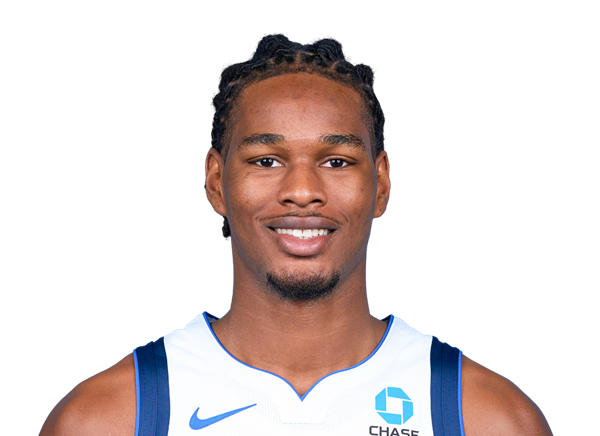 Morez Johnson Jr.F #14
 Moussa CisseC #30
 Naji MarshallF #3
 P.J. WashingtonF #25
 Quincy AcyF
 Santi AldamaF #34
 Sergio de LarreaF #55
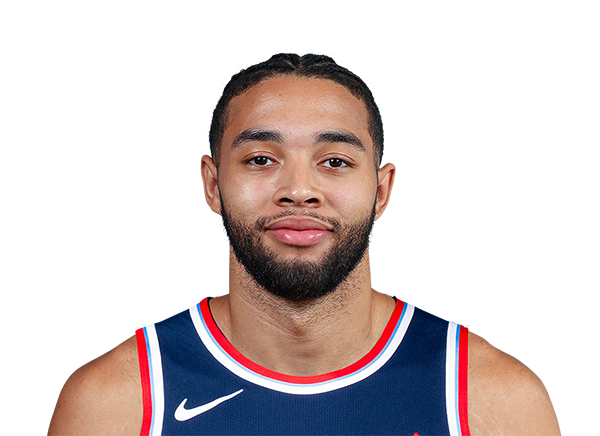 Seth LundyG #5
 Tarik BiberovicF #13
 Tobi LawalF #33
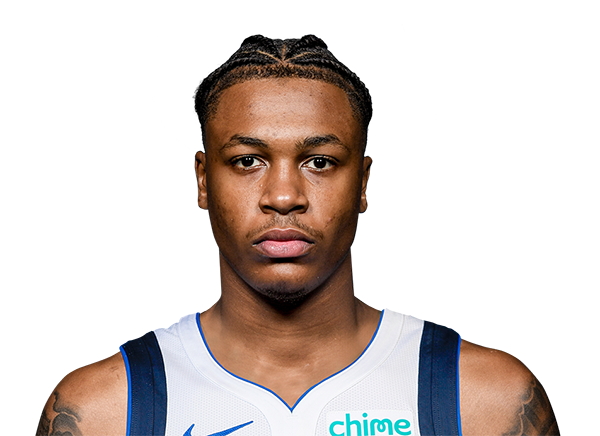 Tyler SmithF #23
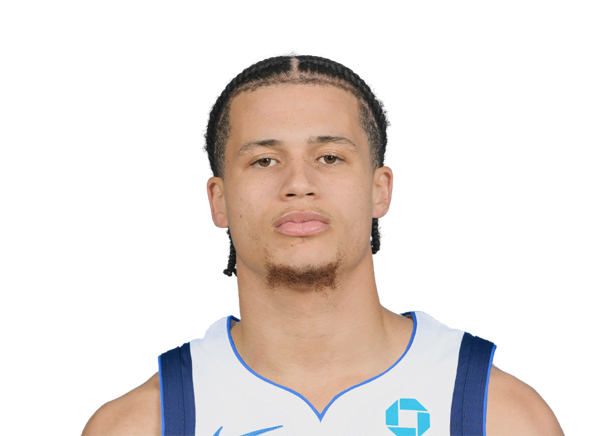 Walter Clayton Jr.G #1
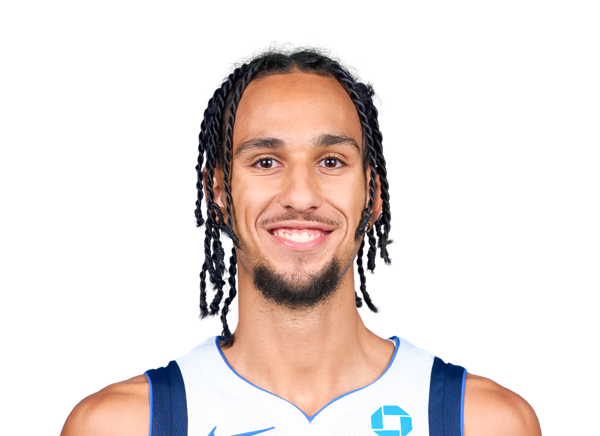 Zaccharie RisacherF #10
06 / SALARY BY SEASON
Contract
| Season | Salary |
|---|---|
| 2008-09 | $11.35M |
| 2009-10 | $11.7M |
| 2010-11 | $12.6M |
| 2011-12 | $13.11M |
| 2012-13 | $13.6M |
| 2013-14 | $14.1M |
| 2014-15 | $14.85M |
| 2015-16 | $13M |
| 2016-17 | $12.42M |
| 2017-18 | $13M |
| 2018-19 | $1.33M |
| 2019-20 | $1.62M |
Total listed: $132.68M · source: espn.
07 / LATEST REPORT
Injury status
No current injury report entry for this player.
08 / SIGNINGS, TRADES AND ROSTER MOVES
Transactions
No recorded transactions for this player.
09 / LATEST COVERAGE
Player news
LATEST UPDATEChandler is out for Saturday's Game 5 against the Lakers due to neck spasms.
Chandler hasn't seen the floor for Houston since January, so his absence won't affect coach Mike D'Antoni's gameplan.
12 August 2024Every Team USA Olympic basketball roster since 1992↗
17 July 2020Tyson Chandler snaps some practice pics of his teammates↗
13 July 2019Tyson Chandler, Rockets agree to one-year deal↗
8 March 2019Lakers' Ingram (shoulder) misses 2nd straight↗
15 November 2018Tyson Chandler's choice of Lakers over Warriors has already paid dividends↗
12 November 2018Lakers escape wild series of events against Hawks and go over .500↗
8 November 2018Chandler can't describe what it's like playing with LeBron↗
8 November 2018Tyson Chandler gives the Lakers exactly what they needed in debut↗
10 / BIO, DRAFT AND CONTACT DETAILS
Biography & profile
TeamDallas Mavericks
PositionCenter
Jersey6
Height7' 0"
Weight235 lbs
Age44
StatusInactive