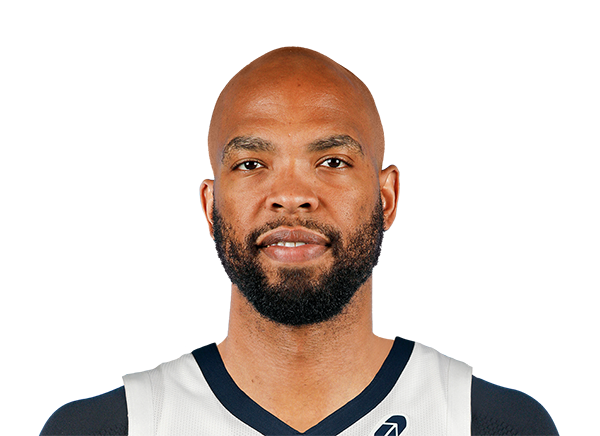
Taj Gibson

Taj Gibson NBA headshot
BALLERSCULTURE PLAYER PROFILE · 2023-24

Taj Gibson

2023 24 Totals · F • 6' 9" 232 lbs

NBAFFree AgentViewing 2023-24
01 / 2023-24 PER-GAME AVERAGES

Season snapshot

PTS1.7
REB1.9
AST0.6
STL0.2
BLK0.4
TO0.3
MIN10.3
FG%40.5
3P%20.0
FT%100.0
GP20
GS1
FG0.8-1.9
3PT0.1-0.5
FT0.1-0.1
OR0.6

Per-game averages, regular season 2023-24 (2023 24 Totals).

02 / EVERY SEASON SINCE 2022-23, SIDE BY SIDE

2022-23 to 2026-27

Per game

SeasonTeamGPGSMINPTSREBASTSTLBLKTOFG%3P%FT%
2022-23Washington Wizards4929.83.41.90.70.30.20.552.033.371.4
2023-24New York Knicks20110.31.71.90.60.20.40.340.520.0100.0
2024-25Charlotte Hornets371111.12.93.20.60.20.50.749.550.060.0
2025-26Memphis Grizzlies1019.73.42.70.60.20.10.146.250.087.5
2026-27—————————————

Season totals

SeasonTeamGPGSMINPTSREBASTSTLBLKTOFG%3P%FT%
2022-23Washington Wizards———168933415122652.033.371.4
2023-24New York Knicks———1628926530.40.0100.0
2024-25Charlotte Hornets———107120219182549.550.060.0
2025-26Memphis Grizzlies———3427621146.250.087.5
2026-27—————————————

Click a season to open this player’s full game log, splits and advanced stats for that year; click a team to open its page. A dash means no NBA games were recorded.

03 / EVERY CATEGORY THE PROVIDER REPORTS

Full statistical breakdown

Regular season 2023-24

Defensive

MetricTotalNBA rank
Blocks7Tied-343rd
Defensive Rebounds25Tied-437th
Steals3Tied-471st
Defensive Rebound Rate0.0—
Defensive Rebounds Per Game1.3—
Blocks Per Game0.4—
Steals Per Game0.2—
Defensive Rebounds Per 485.92,996th
Blocks Per 481.62,352nd
Steals Per 480.73,229th

General

MetricTotalNBA rank
Disqualifications0Tied-102nd
Flagrant Fouls0Tied-76th
Fouls31Tied-395th
Player Efficiency Rating5.94—
Rebound Rate10.2—
Ejections0Tied-61st
Technical Fouls0Tied-256th
Rebounds37—
Value Over Replacement Player-14.9—
Minutes205Tied-7th
Minutes Per Game10.3—
Rating4.7Tied-163rd
Plus-Minus-29Tied-1st
Rebounds Per Game1.9—
Fouls Per Game1.6—
Flagrant Fouls Per Game0.0—
Technical Fouls Per Game0.0—
Ejections Per Game0.0—
Disqualifications Per Game0.0—
Assist To Turnover Ratio2.2—
Steal To Foul Ratio0.1—
Block To Foul Ratio0.2—
Team Rebounds Per Game0.0—
Rebounds37—
Total Technical Fouls0—
Assist To Turnover Ratio0.0—
Steal To Turnover Ratio0.6—
Rebounds Per 48 Minutes8.7—
Fouls Per 48 Minutes7.32,708th
Flagrant Fouls Per 48 Minutes0.0521st
Technical Fouls Per 48 Minutes0.01,755th
Ejections Per 48 Minutes0.0418th
Disqualifications Per 48 Minutes0.0699th
R/407.2—
Games Played2020th
Games Started1Tied-356th
Double Double0Tied-257th
Triple Double0Tied-38th

Offensive

MetricTotalNBA rank
Assists11Tied-451st
Effective Field Goal Percentage43.2—
Field Goals15/37—
Field Goals Attempted37463rd
Field Goals Made15Tied-464th
Field Goal Percentage40.5—
Free Throws2/2—
Free Throw Percentage100.0—
Free Throws Attempted2Tied-493rd
Free Throws Made2Tied-487th
Offensive Rebounds12Tied-397th
Points34Tied-474th
Turnovers5Tied-462nd
3-Point Field Goal Percentage20.0—
3-Point Field Goals Attempted10Tied-435th
3-Point Field Goals Made2Tied-440th
True Shooting Percentage44.9—
Total Turnovers5—
Assist Ratio20.4—
Points in the Paint0Tied-1st
Offensive Rebound Rate6.5—
Turnover Ratio9.3—
Brick Index0.00—
Usage Rate0.0—
Average Field Goals Made0.8—
Average Field Goals Attempted1.9—
Average 3-Point Field Goals Made0.1—
Average 3-Point Field Goals Attempted0.5—
Average Free Throws Made0.1—
Average Free Throws Attempted0.1—
Points Per Game1.7—
Offensive Rebounds Per Game0.6—
Assists Per Game0.6—
Turnovers Per Game0.3—
Offensive Rebound Percentage0.5—
Estimated Possessions30.8—
Estimated Possessions Per Game1.5—
Points Per Estimated Possession1.1—
Team Turnovers Per Game0.0—
Total Turnovers Per Game0.3—
3-Point Field Goal Percentage20.0—
2-Point Field Goals Made13.0Tied-24th
2-Point Field Goals Attempted27.0898th
2-Point Field Goals Made per Game0.7—
2-Point Field Goals Attempted per Game1.4—
2-Point Field Goal Percentage48.1—
Shooting Efficiency0.43—
Scoring Efficiency0.919—
Fieldgoals Made Per 483.53,181st
Fieldgoals Attempted Per 488.7Tied-3,174th
3-Point Fieldgoals Made Per 480.53,017th
3-Point Fieldgoals Attempted Per 482.32,982nd
Freethrows Made Per 480.53,339th
Freethrows Attempted Per 480.53,380th
Points Scored Per 488.03,250th
Offensive Rebounds Per 482.82,722nd
Assists Per 482.63,092nd
Turnovers1.23,168th
P/406.6—
A/402.1—
04 / EFFICIENCY, SHOOTING PROFILE, PER-36

Advanced metrics

True shooting %43.7%
Effective FG %44.7%
2-point FG %50.0%
3-point attempt rate26.3%
Free throw rate5.3%
Points per shot attempt0.89
% of points from 3s17.6%
Assist-to-turnover2.00
Points per 36 min5.9
Rebounds per 36 min6.6
Assists per 36 min2.1
Steals per 36 min0.70
Blocks per 36 min1.40
Turnovers per 36 min1.05
Stocks (STL + BLK) per game0.60
Pts + Reb + Ast per game4.2
Efficiency (EFF) per game3.4
Game Score per game (Hollinger)1.5
Minutes per game10.3

Calculated by BallersCulture from the supplied 2023-24 box-score totals using standard formulas (hover a tile to see the formula). Tracking-based metrics such as BPM, VORP, on/off and RAPTOR are not available from this data source.

05 / 19 GAMES IN 2023-24

Game log: Regular season

DateOppResultMINFGFG%3PT3P%FTFT%REBASTBLKSTLPFTOPTS
Apr 15@ SAL 123-9581-333.30-00.00-00.02000002
Apr 13@ DALW 107-89124-666.70-00.00-00.05210108
Apr 7@ BKNL 113-10392-366.71-250.00-00.00000105
Mar 19@ BOSL 119-94111-250.01-250.00-00.02001103
Feb 15@ ORLL 118-10090-00.00-00.00-00.00001010
Feb 13@ HOUL 105-10350-10.00-00.00-00.02100200
Feb 11vs INDL 125-111190-40.00-00.00-00.03100200
Feb 9vs DALL 122-108220-30.00-10.00-00.04100410
Feb 7vs MEMW 123-113130-10.00-10.02-2100.01100012
Jan 2vs MINW 112-10600-00.00-00.00-00.00000100
Dec 31@ INDL 140-126141-333.30-00.00-00.02100412
Dec 30@ ORLL 117-108151-1100.00-00.00-00.04010402
Dec 28@ OKCL 129-120102-2100.00-00.00-00.02000204
Dec 26vs MILW 129-122150-10.00-10.00-00.03330200
Dec 24vs MILL 130-111151-250.00-10.00-00.01100202
Dec 21@ BKNW 121-102131-250.00-00.00-00.02020302
Dec 19@ LALW 114-10960-00.00-00.00-00.03000210
Dec 17@ LACL 144-12261-333.30-20.00-00.01001002
Dec 16@ PHXW 139-12210-00.00-00.00-00.00000000
06 / 2023-24 HOME / AWAY, RESULTS, MONTHS AND OPPONENTS

Splits

split
SplitGPMINFGFG%3PT3P%FTFT%ORDRREBASTBLKSTLPFTOPTS
All Splits2010.30.8-1.940.50.1-0.520.00.1-0.1100.00.61.31.90.60.40.21.60.31.7
Home712.10.1-1.69.10.0-0.60.00.3-0.3100.00.41.31.71.00.40.01.60.30.6
Road139.21.1-2.053.80.2-0.533.30.0-0.00.00.71.21.90.30.30.21.50.22.3
vs. Division113.01.0-2.050.00.0-0.00.00.0-0.00.00.02.02.00.02.00.03.00.02.0
vs. Conference913.30.8-2.038.90.2-0.733.30.0-0.00.00.31.61.90.70.70.22.10.21.8
3+ Days Rest67.71.2-2.058.30.3-0.840.00.3-0.3100.00.21.21.30.50.20.20.50.23.0
Month
SplitGPMINFGFG%3PT3P%FTFT%ORDRREBASTBLKSTLPFTOPTS
December910.70.8-1.650.00.0-0.40.00.0-0.00.00.71.32.00.60.70.12.10.21.6
January20.50.0-0.00.00.0-0.00.00.0-0.00.00.00.00.00.00.00.00.50.00.0
February513.60.0-1.80.00.0-0.40.00.4-0.4100.00.81.22.00.80.00.21.60.60.4
March111.01.0-2.050.01.0-2.050.00.0-0.00.00.02.02.00.00.01.01.00.03.0
April39.32.3-4.058.30.3-0.750.00.0-0.00.00.71.72.30.70.30.00.70.05.0
Pre All-Star1610.30.4-1.430.40.0-0.40.00.1-0.1100.00.61.11.80.60.40.11.80.31.0
Post All-Star49.82.0-3.557.10.5-1.050.00.0-0.00.00.51.82.30.50.30.30.80.04.5
Result
SplitGPMINFGFG%3PT3P%FTFT%ORDRREBASTBLKSTLPFTOPTS
Wins87.60.6-1.350.00.0-0.30.00.3-0.3100.00.31.51.80.80.80.01.10.31.5
Losses1212.00.8-2.337.00.2-0.725.00.0-0.00.00.81.11.90.40.10.31.80.31.8
Position
SplitGPMINFGFG%3PT3P%FTFT%ORDRREBASTBLKSTLPFTOPTS
As Starter119.00.0-4.00.00.0-0.00.00.0-0.00.00.03.03.01.00.00.02.00.00.0
Day
SplitGPMINFGFG%3PT3P%FTFT%ORDRREBASTBLKSTLPFTOPTS
Monday57.60.2-0.825.00.2-0.633.30.0-0.00.00.61.42.00.80.60.21.60.20.6
Tuesday27.00.0-0.50.00.0-0.50.01.0-1.0100.00.00.50.50.50.00.00.00.51.0
Wednesday310.71.0-1.375.00.0-0.00.00.0-0.00.00.31.01.30.00.70.31.70.32.0
Thursday122.00.0-3.00.00.0-1.00.00.0-0.00.02.02.04.01.00.00.04.01.00.0
Friday39.31.7-2.371.40.0-0.00.00.0-0.00.00.32.73.00.70.70.01.70.03.3
Saturday512.61.0-3.033.30.2-1.020.00.0-0.00.00.80.61.40.60.00.21.80.22.2
Sunday18.01.0-3.033.30.0-0.00.00.0-0.00.01.01.02.00.00.00.00.00.02.0
Opponent
SplitGPMINFGFG%3PT3P%FTFT%ORDRREBASTBLKSTLPFTOPTS
Brooklyn Nets211.01.5-2.560.00.5-1.050.00.0-0.00.00.01.01.00.01.00.02.00.03.5
Boston Celtics111.01.0-2.050.01.0-2.050.00.0-0.00.00.02.02.00.00.01.01.00.03.0
Dallas Mavericks217.02.0-4.544.40.0-0.50.00.0-0.00.01.53.04.51.50.50.02.50.54.0
Houston Rockets15.00.0-1.00.00.0-0.00.00.0-0.00.02.00.02.01.00.00.02.00.00.0
Indiana Pacers216.50.5-3.514.30.0-0.00.00.0-0.00.01.01.52.51.00.00.03.00.51.0
Los Angeles Clippers16.01.0-3.033.30.0-2.00.00.0-0.00.01.00.01.00.00.01.00.00.02.0
Los Angeles Lakers16.00.0-0.00.00.0-0.00.00.0-0.00.01.02.03.00.00.00.02.01.00.0
Memphis Grizzlies113.00.0-1.00.00.0-1.00.02.0-2.0100.00.01.01.01.00.00.00.01.02.0
Milwaukee Bucks215.00.5-1.533.30.0-1.00.00.0-0.00.00.51.52.02.01.50.02.00.01.0
Minnesota Timberwolves10.00.0-0.00.00.0-0.00.00.0-0.00.00.00.00.00.00.00.01.00.00.0
Orlando Magic212.50.5-0.5100.00.0-0.00.00.0-0.00.00.02.02.00.00.50.52.00.51.0
Phoenix Suns11.00.0-0.00.00.0-0.00.00.0-0.00.00.00.00.00.00.00.00.00.00.0
San Antonio Spurs18.01.0-3.033.30.0-0.00.00.0-0.00.01.01.02.00.00.00.00.00.02.0
Oklahoma City Thunder110.02.0-2.0100.00.0-0.00.00.0-0.00.01.01.02.00.00.00.02.00.04.0
Utah Jazz10.00.0-0.00.00.0-0.00.00.0-0.00.00.00.00.00.00.00.00.00.00.0
07 / SEASON-BY-SEASON HISTORY

Career statistics

Regular Season Averages

SeasonTeamGPGSMINFGFG%3PT3P%FTFT%ORDRREBASTBLKSTLPFTOPTS
2009-10Chicago Bulls827026.93.8-7.749.40.0-0.00.01.4-2.164.62.84.77.50.91.30.63.41.49.0
2010-11Chicago Bulls801921.82.9-6.346.60.0-0.112.51.3-1.967.62.03.75.70.71.30.52.50.97.1
2011-12Chicago Bulls63020.43.2-6.449.50.0-0.00.01.3-2.162.22.13.15.30.71.30.42.11.07.7
2012-13Chicago Bulls65522.43.3-6.848.50.0-0.10.01.4-2.067.91.93.45.30.91.40.42.61.28.0
2013-14Chicago Bulls82828.75.2-10.947.90.0-0.10.02.6-3.475.12.44.46.81.11.40.52.51.813.0
2014-15Chicago Bulls621727.34.1-8.250.20.0-0.00.02.1-3.071.72.63.86.41.11.20.62.61.210.3
2015-16Chicago Bulls735526.53.6-6.852.60.0-0.00.01.4-2.069.22.84.16.91.51.10.62.51.18.6
2016-17Chicago Bulls555527.35.0-9.652.10.0-0.216.71.5-2.271.42.24.86.91.10.90.52.21.411.6
2016-17Oklahoma City Thunder231621.23.9-7.849.70.0-0.0100.01.2-1.771.81.72.84.50.60.70.61.71.29.0
2016-172016 17 Totals787125.54.7-9.151.50.0-0.223.11.4-2.071.52.04.26.20.90.80.52.11.310.8
2017-18Minnesota Timberwolves828233.35.2-9.057.70.1-0.420.01.7-2.376.82.44.87.11.20.70.82.71.112.2
2018-19Minnesota Timberwolves705724.14.3-7.756.60.2-0.532.41.9-2.575.72.54.16.51.20.60.82.71.010.8
2019-20New York Knicks625616.52.7-4.658.40.1-0.228.60.7-0.973.21.82.54.30.80.50.42.00.86.1
2020-21New York Knicks45320.82.2-3.562.70.1-0.320.00.9-1.272.72.23.45.60.81.10.72.20.55.4
2021-22New York Knicks52418.21.7-3.251.80.3-0.739.50.8-1.080.81.72.74.40.60.80.42.60.54.4
2022-23Washington Wizards4929.81.3-2.652.00.2-0.533.30.6-0.971.40.71.21.90.70.20.31.70.53.4
2023-24New York Knicks16110.30.4-1.430.40.0-0.40.00.1-0.1100.00.61.11.80.60.40.11.80.31.0
2023-24Detroit Pistons409.82.0-3.557.10.5-1.050.00.0-0.00.00.51.82.30.50.30.30.80.04.5
2023-242023 24 Totals20110.30.8-1.940.50.1-0.520.00.1-0.1100.00.61.31.90.60.40.21.60.31.7
2024-25Charlotte Hornets371111.11.3-2.649.50.0-0.150.00.3-0.560.01.41.93.20.60.50.21.50.72.9
2025-26Memphis Grizzlies1019.71.2-2.646.20.3-0.650.00.7-0.887.51.11.62.70.60.10.21.40.13.4
Career—101246222.93.4-6.751.70.1-0.227.21.4-1.971.32.13.65.70.91.00.52.41.08.3

Regular Season Totals

SeasonTeamFGFG%3PT3P%FTFT%ORDRREBASTBLKSTLPFTOPTS
2009-10Chicago Bulls311-62949.40-00.0113-17564.62263856117010450282114735
2010-11Chicago Bulls234-50246.61-812.5100-14867.6162296458581063920371569
2011-12Chicago Bulls200-40449.50-00.084-13562.213519733247812713160484
2012-13Chicago Bulls214-44148.50-40.089-13167.912522034561902716676517
2013-14Chicago Bulls429-89647.90-70.0211-28175.120035855891112412071501069
2014-15Chicago Bulls254-50650.20-00.0132-18471.716223439671753616277640
2015-16Chicago Bulls263-50052.60-30.0101-14669.2206298504106774718078627
2016-17Chicago Bulls276-53052.12-1216.785-11971.412026238260502712377639
2016-17Oklahoma City Thunder89-17949.71-1100.028-3971.838651031315144028207
2016-172016 17 Totals365-70951.53-1323.1113-15871.5158327485736541163105846
2017-18Minnesota Timberwolves425-73757.77-3520.0142-18576.819439058499596221889999
2018-19Minnesota Timberwolves304-53756.611-3432.4134-17775.717228645884395318673753
2019-20New York Knicks167-28658.44-1428.641-5673.211115626752302712247379
2020-21New York Knicks99-15862.73-1520.040-5572.7991512503649319922241
2021-22New York Knicks86-16651.815-3839.542-5280.88814122932402213727229
2022-23Washington Wizards65-12552.08-2433.330-4271.43261933412158426168
2023-24New York Knicks7-2330.40-60.02-2100.010182896228516
2023-24Detroit Pistons8-1457.12-450.00-00.02792113018
2023-242023 24 Totals15-3740.52-1020.02-2100.0122537117331534
2024-25Charlotte Hornets47-9549.51-250.012-2060.05169120211895425107
2025-26Memphis Grizzlies12-2646.23-650.07-887.511162761214134
Career—3490-675451.758-21327.21393-195571.3214436105754952965532243910468431

Regular Season Misc Totals

SeasonTeamDD2TD3DQEJECTTECHFLAGAST/TOSTL/TOSC-EFFSH-EFF
2009-10Chicago Bulls18090300.60.41.1690.49
2010-11Chicago Bulls6030100.80.51.1330.47
2011-12Chicago Bulls4010000.80.51.1980.50
2012-13Chicago Bulls5021100.80.41.1720.49
2013-14Chicago Bulls15021900.60.31.1930.48
2014-15Chicago Bulls8010300.90.51.2650.50
2015-16Chicago Bulls7010401.40.61.2540.53
2016-17Chicago Bulls11021700.80.41.2060.52
2016-17Oklahoma City Thunder0000200.50.51.1560.50
2016-172016 17 Totals11021900.70.41.1930.52
2017-18Minnesota Timberwolves18060401.10.71.3550.58
2018-19Minnesota Timberwolves13022711.20.71.4020.58
2019-20New York Knicks0000211.10.61.3250.59
2020-21New York Knicks0010211.61.41.5250.64
2021-22New York Knicks0041301.20.81.3800.56
2022-23Washington Wizards0020001.30.61.3440.55
2023-24New York Knicks0000001.80.40.6960.30
2023-24Detroit Pistons000000INFINF1.2860.64
2023-242023 24 Totals0000002.20.60.9190.43
2024-25Charlotte Hornets1000100.80.41.1260.50
2025-26Memphis Grizzlies0000006.02.01.3080.52
Career—10603664930.90.51.2480.52

Scoring, rebounding and assist trend

08 / RECORD, TEAM STATS AND TEAMMATES

Team

TEAM \u00b7 2023-24

2023 24 Totals

09 / SALARY BY SEASON

Contract

SeasonSalary
2015-16$8.5M
2016-17$8.95M
2017-18$14M
2018-19$14M
2019-20$9M
2020-21$1.44M
2021-22$4.91M
2022-23$1.84M
2023-24$348,225
2024-25$2.09M
2025-26$960,753
2026-27$3.19M

Total listed: $69.22M · source: espn.

10 / LATEST REPORT

Injury status

No current injury report entry for this player.
11 / SIGNINGS, TRADES AND ROSTER MOVES

Transactions

12 / LATEST COVERAGE

Player news

LATEST UPDATEGibson is retiring from the NBA and taking an assistant coaching role with the Bulls, Shams Charania of ESPN reports.

The journeyman big man and longtime Bull was most recently traded from the Grizzlies to the Pelicans on Tuesday before being cut loose by New Orleans. Gibson, 41, is hanging it up after 17 years in the league and beginning his coaching career with the team that drafted him back in 2009. He averaged 8.3 points and 5.7 rebounds per game covering 1,012 regular-season appearances for eight clubs.

13 / BIO, DRAFT AND CONTACT DETAILS

Biography & profile

Team2023 24 Totals
PositionForward
Height6' 9"
Weight232 lbs
Age41
CollegeUSC
StatusFree Agent
Data is provided by third-party sources and may be delayed, incomplete or revised. Statistics are displayed as supplied by the relevant provider; advanced metrics are calculated from those figures. Last refreshed 2026-11-17 13:15:24. BallersCulture does not represent this page as an official NBA profile.