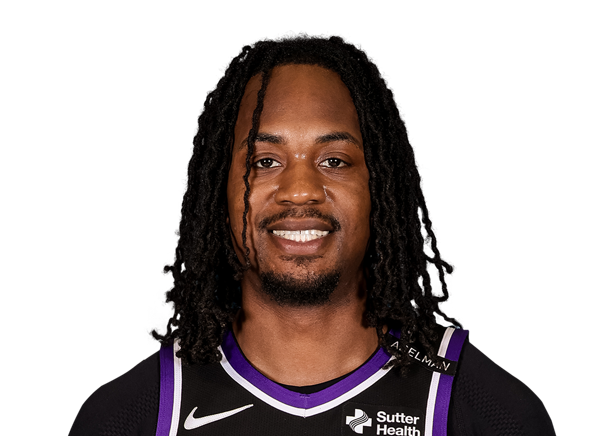
Click a season to open this player’s full game log, splits and advanced stats for that year; click a team to open its page. A dash means no NBA games were recorded.
03 / EVERY CATEGORY THE PROVIDER REPORTS
Full statistical breakdown
Regular season 2024-25
Defensive
Metric
Total
NBA rank
Blocks
0
Tied-519th
Defensive Rebounds
2
Tied-547th
Steals
1
Tied-521st
Defensive Rebound Rate
0.0
—
Defensive Rebounds Per Game
0.3
—
Blocks Per Game
0.0
—
Steals Per Game
0.1
—
Defensive Rebounds Per 48
6.0
2,917th
Blocks Per 48
0.0
2,768th
Steals Per 48
3.0
2,778th
General
Metric
Total
NBA rank
Disqualifications
0
Tied-1st
Flagrant Fouls
0
Tied-88th
Fouls
4
Tied-520th
Player Efficiency Rating
-6.06
—
Rebound Rate
13.9
—
Ejections
0
Tied-66th
Technical Fouls
0
Tied-245th
Rebounds
4
—
Value Over Replacement Player
-4.0
—
Minutes
16
Tied-9th
Minutes Per Game
2.0
—
Rating
0.6
Tied-389th
Plus-Minus
-5
Tied-1st
Rebounds Per Game
0.5
—
Fouls Per Game
0.5
—
Flagrant Fouls Per Game
0.0
—
Technical Fouls Per Game
0.0
—
Ejections Per Game
0.0
—
Disqualifications Per Game
0.0
—
Assist To Turnover Ratio
1.0
—
Steal To Foul Ratio
0.3
—
Block To Foul Ratio
0.0
—
Team Rebounds Per Game
0.0
—
Rebounds
4
—
Total Technical Fouls
0
—
Assist To Turnover Ratio
0.0
—
Steal To Turnover Ratio
0.5
—
Rebounds Per 48 Minutes
12.0
—
Fouls Per 48 Minutes
12.0
2,773rd
Flagrant Fouls Per 48 Minutes
0.0
469th
Technical Fouls Per 48 Minutes
0.0
1,306th
Ejections Per 48 Minutes
0.0
352nd
Disqualifications Per 48 Minutes
0.0
5th
R/40
10.0
—
Games Played
8
8th
Games Started
0
Tied-434th
Double Double
0
Tied-281st
Triple Double
0
Tied-44th
Offensive
Metric
Total
NBA rank
Assists
2
Tied-530th
Effective Field Goal Percentage
12.5
—
Field Goals
1/8
—
Field Goals Attempted
8
Tied-538th
Field Goals Made
1
Tied-552nd
Field Goal Percentage
12.5
—
Free Throws
1/1
—
Free Throw Percentage
100.0
—
Free Throws Attempted
1
Tied-543rd
Free Throws Made
1
Tied-530th
Offensive Rebounds
2
Tied-520th
Points
3
Tied-553rd
Turnovers
2
Tied-520th
3-Point Field Goal Percentage
0.0
—
3-Point Field Goals Attempted
3
Tied-503rd
3-Point Field Goals Made
0
Tied-499th
True Shooting Percentage
17.8
—
Total Turnovers
2
—
Assist Ratio
16.1
—
Points in the Paint
0
Tied-1st
Offensive Rebound Rate
14.1
—
Turnover Ratio
16.1
—
Brick Index
0.00
—
Usage Rate
0.0
—
Average Field Goals Made
0.1
—
Average Field Goals Attempted
1.0
—
Average 3-Point Field Goals Made
0.0
—
Average 3-Point Field Goals Attempted
0.4
—
Average Free Throws Made
0.1
—
Average Free Throws Attempted
0.1
—
Points Per Game
0.4
—
Offensive Rebounds Per Game
0.3
—
Assists Per Game
0.3
—
Turnovers Per Game
0.3
—
Offensive Rebound Percentage
0.3
—
Estimated Possessions
8.4
—
Estimated Possessions Per Game
1.1
—
Points Per Estimated Possession
0.4
—
Team Turnovers Per Game
0.0
—
Total Turnovers Per Game
0.3
—
3-Point Field Goal Percentage
0.0
—
2-Point Field Goals Made
1.0
Tied-53rd
2-Point Field Goals Attempted
5.0
Tied-35th
2-Point Field Goals Made per Game
0.1
—
2-Point Field Goals Attempted per Game
0.6
—
2-Point Field Goal Percentage
20.0
—
Shooting Efficiency
0.13
—
Scoring Efficiency
0.375
—
Fieldgoals Made Per 48
3.0
2,944th
Fieldgoals Attempted Per 48
24.0
2,869th
3-Point Fieldgoals Made Per 48
0.0
2,661st
3-Point Fieldgoals Attempted Per 48
9.0
2,682nd
Freethrows Made Per 48
3.0
2,826th
Freethrows Attempted Per 48
3.0
2,896th
Points Scored Per 48
9.0
2,949th
Offensive Rebounds Per 48
6.0
2,773rd
Assists Per 48
6.0
2,826th
Turnovers
6.0
2,773rd
P/40
7.5
—
A/40
5.0
—
04 / EFFICIENCY, SHOOTING PROFILE, PER-36
Advanced metrics
True shooting %19.2%
Effective FG %10.0%
2-point FG %16.7%
3-point attempt rate40.0%
Free throw rate10.0%
Points per shot attempt0.40
% of points from 3s0.0%
Assist-to-turnover1.00
Points per 36 min7.2
Rebounds per 36 min9.0
Assists per 36 min5.4
Steals per 36 min1.80
Blocks per 36 min0.00
Turnovers per 36 min5.40
Stocks (STL + BLK) per game0.10
Pts + Reb + Ast per game1.2
Efficiency (EFF) per game0.1
Game Score per game (Hollinger)-0.1
Minutes per game2.0
Calculated by BallersCulture from the supplied 2024-25 box-score totals using standard formulas (hover a tile to see the formula). Tracking-based metrics such as BPM, VORP, on/off and RAPTOR are not available from this data source.
05 / 7 GAMES IN 2024-25
Game log: Regular season
Date
Opp
Result
MIN
FG
FG%
3PT
3P%
FT
FT%
REB
AST
BLK
STL
PF
TO
PTS
Feb 14
vs OKC
W 116-101
2
0-1
0.0
0-0
0.0
0-0
0.0
0
0
0
0
0
1
0
Feb 11
@ CLE
L 128-107
5
0-1
0.0
0-0
0.0
0-0
0.0
3
1
0
1
1
0
0
Jan 14
@ WSH
W 120-106
1
0-0
0.0
0-0
0.0
0-0
0.0
1
0
0
0
1
0
0
Dec 2
@ MEM
L 136-121
2
0-1
0.0
0-1
0.0
0-0
0.0
0
1
0
0
0
0
0
Nov 30
vs DET
L 130-106
3
0-2
0.0
0-1
0.0
0-0
0.0
0
0
0
0
2
1
0
Nov 23
@ MIL
L 129-117
2
1-2
50.0
0-1
0.0
1-1
100.0
0
0
0
0
0
0
3
Nov 19
@ TOR
L 130-119
1
0-1
0.0
0-0
0.0
0-0
0.0
0
0
0
0
0
0
0
06 / 2024-25 HOME / AWAY, RESULTS, MONTHS AND OPPONENTS
LATEST UPDATENewton posted 15 points (4-9 FG, 1-3 3Pt, 6-12 FT), three assists, two rebounds and a steal in 19 minutes during Tuesday's 110-98 preseason loss to the Trail Blazers.
Newton scored eight in the first quarter and co-led the Kings in scoring as he continues to audition for Sacramento's open two-way spot after signing a training camp deal last week. The most glaring stat in Tuesday's loss was his work at the charity stripe, where he missed six of his 12 attempts.