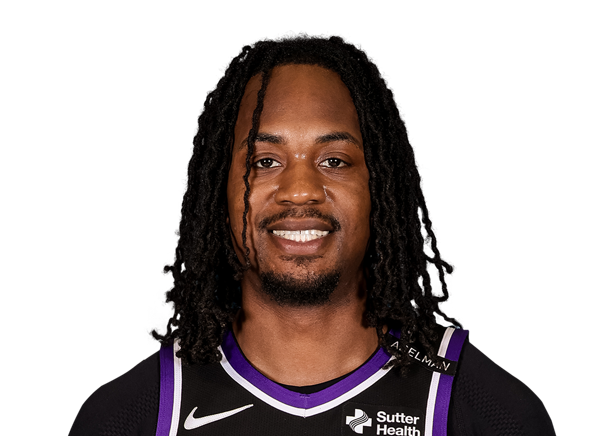
Tristen Newton

Tristen Newton NBA headshot
BALLERSCULTURE PLAYER PROFILE · 2025-26

Tristen Newton

Houston Rockets · G • #00 • 6' 5" 202 lbs

NBAGFree AgentViewing 2025-26
01 / 2025-26 PER-GAME AVERAGES

Season snapshot

PTS12.0
REB3.0
AST0.0
STL1.0
BLK0.0
TO0.0
MIN12.0
FG%44.4
3P%40.0
FT%66.7
GP1
GS0
FG4.0-9.0
3PT2.0-5.0
FT2.0-3.0
OR2.0

Per-game averages, regular season 2025-26 (Houston Rockets).

02 / EVERY SEASON SINCE 2022-23, SIDE BY SIDE

2022-23 to 2026-27

Per game

SeasonTeamGPGSMINPTSREBASTSTLBLKTOFG%3P%FT%
2022-23—————————————
2023-24—————————————
2024-25Indiana Pacers802.00.40.50.30.10.00.312.50.0100.0
2025-26Houston Rockets1012.012.03.00.01.00.00.044.440.066.7
2026-27—————————————

Season totals

SeasonTeamGPGSMINPTSREBASTSTLBLKTOFG%3P%FT%
2022-23—————————————
2023-24—————————————
2024-25Indiana Pacers———30100116.70.0100.0
2025-26Houston Rockets———123010044.440.066.7
2026-27—————————————

Click a season to open this player’s full game log, splits and advanced stats for that year; click a team to open its page. A dash means no NBA games were recorded.

03 / EVERY CATEGORY THE PROVIDER REPORTS

Full statistical breakdown

Regular season 2025-26

Defensive

MetricTotalNBA rank
Blocks0Tied-524th
Defensive Rebounds1Tied-567th
Steals1Tied-540th
Defensive Rebound Rate0.0—
Defensive Rebounds Per Game1.0—
Blocks Per Game0.0—
Steals Per Game1.0—
Defensive Rebounds Per 484.0Tied-2,721st
Blocks Per 480.0Tied-2,515th
Steals Per 484.0Tied-2,592nd

General

MetricTotalNBA rank
Disqualifications0Tied-41st
Flagrant Fouls0Tied-116th
Fouls0Tied-579th
Player Efficiency Rating32.85—
Rebound Rate0.0—
Ejections0Tied-51st
Technical Fouls0Tied-269th
Rebounds3—
Value Over Replacement Player3.9—
Minutes1210th
Minutes Per Game12.0—
Rating16.7Tied-3,131st
Plus-Minus+2Tied-1st
Rebounds Per Game3.0—
Fouls Per Game0.0—
Flagrant Fouls Per Game0.0—
Technical Fouls Per Game0.0—
Ejections Per Game0.0—
Disqualifications Per Game0.0—
Assist To Turnover Ratio0.0—
Steal To Foul Ratio0.0—
Block To Foul Ratio0.0—
Team Rebounds Per Game0.0—
Rebounds3—
Total Technical Fouls0—
Assist To Turnover Ratio0.0—
Steal To Turnover RatioINF—
Rebounds Per 48 Minutes12.0—
Fouls Per 48 Minutes0.0Tied-2,779th
Flagrant Fouls Per 48 Minutes0.0Tied-556th
Technical Fouls Per 48 Minutes0.0Tied-1,291st
Ejections Per 48 Minutes0.0Tied-244th
Disqualifications Per 48 Minutes0.0Tied-196th
R/4010.0—
Games Played11st
Games Started0Tied-450th
Double Double0Tied-284th
Triple Double0Tied-38th

Offensive

MetricTotalNBA rank
Assists0Tied-574th
Effective Field Goal Percentage55.6—
Field Goals4/9—
Field Goals Attempted9Tied-549th
Field Goals Made4Tied-544th
Field Goal Percentage44.4—
Free Throws2/3—
Free Throw Percentage66.7—
Free Throws Attempted3Tied-533rd
Free Throws Made2Tied-525th
Offensive Rebounds2Tied-521st
Points12Tied-545th
Turnovers0Tied-562nd
3-Point Field Goal Percentage40.0—
3-Point Field Goals Attempted5Tied-492nd
3-Point Field Goals Made2Tied-475th
True Shooting Percentage58.1—
Total Turnovers0—
Assist Ratio0.0—
Points in the Paint0Tied-1st
Offensive Rebound Rate0.0—
Turnover Ratio0.0—
Brick Index0.00—
Usage Rate0.0—
Average Field Goals Made4.0—
Average Field Goals Attempted9.0—
Average 3-Point Field Goals Made2.0—
Average 3-Point Field Goals Attempted5.0—
Average Free Throws Made2.0—
Average Free Throws Attempted3.0—
Points Per Game12.0—
Offensive Rebounds Per Game2.0—
Assists Per Game0.0—
Turnovers Per Game0.0—
Offensive Rebound Percentage0.4—
Estimated Possessions8.2—
Estimated Possessions Per Game8.2—
Points Per Estimated Possession1.5—
Team Turnovers Per Game0.0—
Total Turnovers Per Game0.0—
3-Point Field Goal Percentage40.0—
2-Point Field Goals Made2.0Tied-69th
2-Point Field Goals Attempted4.0Tied-57th
2-Point Field Goals Made per Game2.0—
2-Point Field Goals Attempted per Game4.0—
2-Point Field Goal Percentage50.0—
Shooting Efficiency0.56—
Scoring Efficiency1.333—
Fieldgoals Made Per 4816.0Tied-2,611th
Fieldgoals Attempted Per 4836.0Tied-2,635th
3-Point Fieldgoals Made Per 488.0Tied-2,280th
3-Point Fieldgoals Attempted Per 4820.0Tied-2,361st
Freethrows Made Per 488.0Tied-2,520th
Freethrows Attempted Per 4812.0Tied-2,558th
Points Scored Per 4848.0Tied-2,616th
Offensive Rebounds Per 488.0Tied-2,500th
Assists Per 480.0Tied-2,755th
Turnovers0.0Tied-2,697th
P/4040.0—
A/400.0—
04 / EFFICIENCY, SHOOTING PROFILE, PER-36

Advanced metrics

True shooting %58.1%
Effective FG %55.6%
2-point FG %50.0%
3-point attempt rate55.6%
Free throw rate33.3%
Points per shot attempt1.33
% of points from 3s50.0%
Points per 36 min36.0
Rebounds per 36 min9.0
Assists per 36 min0.0
Steals per 36 min3.00
Blocks per 36 min0.00
Turnovers per 36 min0.00
Stocks (STL + BLK) per game1.00
Pts + Reb + Ast per game15.0
Efficiency (EFF) per game10.0
Game Score per game (Hollinger)9.6
Minutes per game12.0

Calculated by BallersCulture from the supplied 2025-26 box-score totals using standard formulas (hover a tile to see the formula). Tracking-based metrics such as BPM, VORP, on/off and RAPTOR are not available from this data source.

05 / 1 GAMES IN 2025-26

Game log: Regular season

DateOppResultMINFGFG%3PT3P%FTFT%REBASTBLKSTLPFTOPTS
Apr 13vs MEMW 132-101124-944.42-540.02-366.730010012
06 / 2025-26 HOME / AWAY, RESULTS, MONTHS AND OPPONENTS

Splits

split
SplitGPMINFGFG%3PT3P%FTFT%ORDRREBASTBLKSTLPFTOPTS
All Splits112.04.0-9.044.42.0-5.040.02.0-3.066.72.01.03.00.00.01.00.00.012.0
Home112.04.0-9.044.42.0-5.040.02.0-3.066.72.01.03.00.00.01.00.00.012.0
vs. Division112.04.0-9.044.42.0-5.040.02.0-3.066.72.01.03.00.00.01.00.00.012.0
vs. Conference112.04.0-9.044.42.0-5.040.02.0-3.066.72.01.03.00.00.01.00.00.012.0
Month
SplitGPMINFGFG%3PT3P%FTFT%ORDRREBASTBLKSTLPFTOPTS
April112.04.0-9.044.42.0-5.040.02.0-3.066.72.01.03.00.00.01.00.00.012.0
Post All-Star112.04.0-9.044.42.0-5.040.02.0-3.066.72.01.03.00.00.01.00.00.012.0
Result
SplitGPMINFGFG%3PT3P%FTFT%ORDRREBASTBLKSTLPFTOPTS
Wins112.04.0-9.044.42.0-5.040.02.0-3.066.72.01.03.00.00.01.00.00.012.0
Day
SplitGPMINFGFG%3PT3P%FTFT%ORDRREBASTBLKSTLPFTOPTS
Sunday112.04.0-9.044.42.0-5.040.02.0-3.066.72.01.03.00.00.01.00.00.012.0
Opponent
SplitGPMINFGFG%3PT3P%FTFT%ORDRREBASTBLKSTLPFTOPTS
Memphis Grizzlies112.04.0-9.044.42.0-5.040.02.0-3.066.72.01.03.00.00.01.00.00.012.0
07 / SEASON-BY-SEASON HISTORY

Career statistics

Regular Season Averages

SeasonTeamGPGSMINFGFG%3PT3P%FTFT%ORDRREBASTBLKSTLPFTOPTS
2024-25Indiana Pacers501.60.2-1.216.70.0-0.60.00.2-0.2100.00.00.00.00.20.00.00.40.20.6
2024-25Minnesota Timberwolves302.70.0-0.70.00.0-0.00.00.0-0.00.00.70.71.30.30.00.30.70.30.0
2024-252024 25 Totals802.00.1-1.012.50.0-0.40.00.1-0.1100.00.30.30.50.30.00.10.50.30.4
2025-26Houston Rockets1012.04.0-9.044.42.0-5.040.02.0-3.066.72.01.03.00.00.01.00.00.012.0
Career—903.10.6-1.929.40.2-0.925.00.3-0.475.00.40.30.80.20.00.20.40.21.7

Regular Season Totals

SeasonTeamFGFG%3PT3P%FTFT%ORDRREBASTBLKSTLPFTOPTS
2024-25Indiana Pacers1-616.70-30.01-1100.0000100213
2024-25Minnesota Timberwolves0-20.00-00.00-00.0224101210
2024-252024 25 Totals1-812.50-30.01-1100.0224201423
2025-26Houston Rockets4-944.42-540.02-366.72130010012
Career—5-1729.42-825.03-475.04372024215

Regular Season Misc Totals

SeasonTeamDD2TD3DQEJECTTECHFLAGAST/TOSTL/TOSC-EFFSH-EFF
2024-25Indiana Pacers0000001.00.00.5000.17
2024-25Minnesota Timberwolves0000001.01.00.0000.00
2024-252024 25 Totals0000001.00.50.3750.13
2025-26Houston Rockets0000000.0INF1.3330.56
Career—0000001.01.00.8820.35

Scoring, rebounding and assist trend

08 / RECORD, TEAM STATS AND TEAMMATES

Team

TEAM \u00b7 2025-26

Houston Rockets

3rd in Western Conference Division · Toyota Center (Houston)

Overall52-30
Home30-11
Road22-19
DIV10-6
CONF29-23
Last Ten Games9-1

Team records for 2025-26 (regular season).

Team statistics 2025-26

Defensive

MetricTotalPer gameNBA rank
Blocks4735.7682nd
Defensive Rebounds271333.0855th
Steals7018.549Tied-9th
Points Conceded Off Turnovers018—
Defensive Rebound Rate0.0——
Defensive Rebounds Per Game33.1——
Blocks Per Game5.8——
Steals Per Game8.5——
Defensive Rebounds Per 480.0——
Blocks Per 480.0——
Steals Per 480.0——

General

MetricTotalPer gameNBA rank
Disqualifications2—Tied-4th
Flagrant Fouls120.1463rd
Fouls150118.30515th
Rebound Rate54.9—1st
Ejections20.024Tied-6th
Technical Fouls920.585Tied-7th
Rebounds394648.122—
Minutes0——
Minutes Per Game0.0——
Fantasy Rating0.0——
Rating216.7——
Plus-Minus-1-1Tied-1st
Game Day of Year0——
Rebounds Per Game48.1——
Fouls Per Game18.3——
Flagrant Fouls Per Game0.1——
Technical Fouls Per Game1.1——
Ejections Per Game0.0——
Disqualifications Per Game0.0——
Assist To Turnover Ratio1.81.765—
Steal To Foul Ratio0.50.467—
Block To Foul Ratio0.30.315—
Team Rebounds Per Game0.0——
Rebounds394648.122—
Total Technical Fouls920.585—
Assist To Turnover Ratio25.7——
Team Rebounds0——
Steal To Turnover Ratio0.60.594—
Rebounds Per 48 Minutes0.0——
Fouls Per 48 Minutes0.0——
Flagrant Fouls Per 48 Minutes0.0——
Technical Fouls Per 48 Minutes0.0——
Ejections Per 48 Minutes0.0——
Disqualifications Per 48 Minutes0.0——
Games Played82—Tied-1st
Games Started0——
Double Double0——
Triple Double0——

Offensive

MetricTotalPer gameNBA rank
Assists208325.40210th
Effective Field Goal Percentage54.2—8th
Field Goals3523/73620.479—
Field Goals Attempted736289.788th
Field Goals Made352342.9634th
Field Goal Percentage47.90.4797th
Free Throws1463/19170.763—
Free Throw Percentage76.30.76312th
Free Throws Attempted191723.37810th
Free Throws Made146317.84112th
Offensive Rebounds123315.0371st
Points9449115.2329th
Turnovers118014.395th
3-Point Field Goal Percentage36.40.3645th
3-Point Field Goals Attempted258031.46314th
3-Point Field Goals Made94011.46312th
True Shooting Percentage57.6—8th
Team Turnovers81—1st
Total Turnovers126114.39—
Assist Ratio18.0—10th
Points in the Paint4344522nd
Offensive Rebound Rate34.8—1st
Turnover Ratio13.3—3rd
Fast Break Points1149——
Possessions8233—14th
Pace Factor99.0—15th
Average Field Goals Made43.0——
Average Field Goals Attempted89.8——
Average 3-Point Field Goals Made11.5——
Average 3-Point Field Goals Attempted31.5——
Average Free Throws Made17.8——
Average Free Throws Attempted23.4——
Points Per Game115.2——
Offensive Rebounds Per Game15.0——
Assists Per Game25.4——
Turnovers Per Game14.4——
Offensive Rebound Percentage0.30.321—
Estimated Possessions8156.898.484—
Estimated Possessions Per Game99.5——
Points Per Estimated Possession1.21.17—
Team Turnovers Per Game1.0——
Total Turnovers Per Game15.4——
3-Point Field Goal Percentage36.40.364—
2-Point Field Goals Made2583.031.5Tied-8th
2-Point Field Goals Attempted4782.058.317Tied-6th
2-Point Field Goals Made per Game31.5——
2-Point Field Goals Attempted per Game58.3——
2-Point Field Goal Percentage54.00.54—
Shooting Efficiency0.540.542—
Scoring Efficiency1.2831.283—
Fieldgoals Made Per 480.0——
Fieldgoals Attempted Per 480.0——
3-Point Fieldgoals Made Per 480.0——
3-Point Fieldgoals Attempted Per 480.0——
Freethrows Made Per 480.0——
Freethrows Attempted Per 480.0——
Points Scored Per 480.0——
Offensive Rebounds Per 480.0——
Assists Per 480.0——
Turnovers0.0——
09 / SALARY BY SEASON

Contract

No contract is on file for this player yet.
10 / LATEST REPORT

Injury status

No current injury report entry for this player.
11 / SIGNINGS, TRADES AND ROSTER MOVES

Transactions

12 / LATEST COVERAGE

Player news

LATEST UPDATENewton posted 15 points (4-9 FG, 1-3 3Pt, 6-12 FT), three assists, two rebounds and a steal in 19 minutes during Tuesday's 110-98 preseason loss to the Trail Blazers.

Newton scored eight in the first quarter and co-led the Kings in scoring as he continues to audition for Sacramento's open two-way spot after signing a training camp deal last week. The most glaring stat in Tuesday's loss was his work at the charity stripe, where he missed six of his 12 attempts.

13 / BIO, DRAFT AND CONTACT DETAILS

Biography & profile

TeamHouston Rockets
PositionGuard
Jersey00
Height6' 5"
Weight202 lbs
Age25
CollegeUConn
StatusFree Agent
Data is provided by third-party sources and may be delayed, incomplete or revised. Statistics are displayed as supplied by the relevant provider; advanced metrics are calculated from those figures. Last refreshed 2026-11-17 12:59:43. BallersCulture does not represent this page as an official NBA profile.