

BALLERSCULTURE TEAM PAGE · 2024-25
Philadelphia 76ers
2026-27: 45-37 (#7 Eastern) · 1st in Atlantic Division · Xfinity Mobile Arena
01 / SEASON BY SEASON
Record since 2022-23
| Season | W | L | PCT | Seed | Home | Away | Div | Conf | PPG | OPP | DIFF | Streak |
|---|---|---|---|---|---|---|---|---|---|---|---|---|
| 2022-23 | 51 | 31 | .622 | #4 Eastern | 24-17 | 27-14 | 6-10 | 32-20 | 109.9 | 107.3 | +2.6 | W2 |
| 2023-24 | 54 | 28 | .659 | #3 Eastern | 29-12 | 25-16 | 10-6 | 34-18 | 115.2 | 110.9 | +4.3 | W2 |
| 2024-25 | 47 | 35 | .573 | #6 Eastern | 25-16 | 22-19 | 8-8 | 31-21 | 114.6 | 111.5 | +3.1 | W8 |
| 2025-26 | 24 | 58 | .293 | #13 Eastern | 12-29 | 12-29 | 3-13 | 15-37 | 109.6 | 115.8 | -6.2 | L2 |
| 2026-27 | 45 | 37 | .549 | #7 Eastern | 23-18 | 22-19 | 9-7 | 27-25 | 115.9 | 116.1 | -0.2 | W2 |
Combined record since 2022-23: 221-189 (53.9%). Click a season to load that year’s stats, roster and results below. 2026-27 is still in progress.
02 / EVERY CATEGORY THE PROVIDER REPORTS
Team statistics 2024-25
Defensive
| Metric | Total | Per game | NBA rank |
|---|---|---|---|
| Blocks | 366 | 4.463 | 2nd |
| Defensive Rebounds | 2411 | 29.402 | 5th |
| Steals | 752 | 9.171 | 1st |
| Points Conceded Off Turnovers | 0 | 16 | — |
| Defensive Rebound Rate | 0.0 | — | — |
| Defensive Rebounds Per Game | 29.4 | — | — |
| Blocks Per Game | 4.5 | — | — |
| Steals Per Game | 9.2 | — | — |
| Defensive Rebounds Per 48 | 0.0 | — | — |
| Blocks Per 48 | 0.0 | — | — |
| Steals Per 48 | 0.0 | — | — |
General
| Metric | Total | Per game | NBA rank |
|---|---|---|---|
| Disqualifications | 0 | — | — |
| Flagrant Fouls | 2 | 0.024 | Tied-4th |
| Fouls | 1556 | 18.976 | 3rd |
| Rebound Rate | 46.6 | — | 5th |
| Ejections | 1 | 0.012 | Tied-2nd |
| Technical Fouls | 78 | 0.476 | 3rd |
| Rebounds | 3263 | 39.792 | — |
| Minutes | 0 | — | — |
| Minutes Per Game | 0.0 | — | — |
| Fantasy Rating | 0.0 | — | — |
| Rating | 196.6 | — | — |
| Plus-Minus | -1 | -1 | Tied-1st |
| Game Day of Year | 0 | — | — |
| Rebounds Per Game | 39.8 | — | — |
| Fouls Per Game | 19.0 | — | — |
| Flagrant Fouls Per Game | 0.0 | — | — |
| Technical Fouls Per Game | 1.0 | — | — |
| Ejections Per Game | 0.0 | — | — |
| Disqualifications Per Game | 0.0 | — | — |
| Assist To Turnover Ratio | 1.8 | 1.805 | — |
| Steal To Foul Ratio | 0.5 | 0.483 | — |
| Block To Foul Ratio | 0.2 | 0.235 | — |
| Team Rebounds Per Game | 0.0 | — | — |
| Rebounds | 3263 | 39.792 | — |
| Total Technical Fouls | 78 | 0.476 | — |
| Assist To Turnover Ratio | 29.7 | — | — |
| Team Rebounds | 0 | — | — |
| Steal To Turnover Ratio | 0.7 | 0.714 | — |
| Rebounds Per 48 Minutes | 0.0 | — | — |
| Fouls Per 48 Minutes | 0.0 | — | — |
| Flagrant Fouls Per 48 Minutes | 0.0 | — | — |
| Technical Fouls Per 48 Minutes | 0.0 | — | — |
| Ejections Per 48 Minutes | 0.0 | — | — |
| Disqualifications Per 48 Minutes | 0.0 | — | — |
| Games Played | 82 | — | Tied-1st |
| Games Started | 0 | — | — |
| Double Double | 0 | — | — |
| Triple Double | 0 | — | — |
Offensive
| Metric | Total | Per game | NBA rank |
|---|---|---|---|
| Assists | 1901 | 23.183 | 5th |
| Effective Field Goal Percentage | 52.7 | — | 3rd |
| Field Goals | 3254/7168 | 0.454 | — |
| Field Goals Attempted | 7168 | 87.415 | 4th |
| Field Goals Made | 3254 | 39.683 | 4th |
| Field Goal Percentage | 45.4 | 0.454 | 4th |
| Free Throws | 1439/1844 | 0.78 | — |
| Free Throw Percentage | 78.0 | 0.78 | 4th |
| Free Throws Attempted | 1844 | 22.488 | 1st |
| Free Throws Made | 1439 | 17.549 | 1st |
| Offensive Rebounds | 852 | 10.39 | 5th |
| Points | 8988 | 109.61 | 4th |
| Turnovers | 1053 | 12.841 | 3rd |
| 3-Point Field Goal Percentage | 34.1 | 0.341 | 5th |
| 3-Point Field Goals Attempted | 3050 | 37.195 | 3rd |
| 3-Point Field Goals Made | 1041 | 12.695 | 3rd |
| True Shooting Percentage | 56.3 | — | 3rd |
| Team Turnovers | 64 | — | 3rd |
| Total Turnovers | 1117 | 12.841 | — |
| Assist Ratio | 17.3 | — | 5th |
| Points in the Paint | 3830 | 46 | 3rd |
| Offensive Rebound Rate | 23.4 | — | 5th |
| Turnover Ratio | 12.3 | — | 3rd |
| Fast Break Points | 1287 | — | — |
| Possessions | 8244 | — | 3rd |
| Pace Factor | 99.9 | — | 2nd |
| Average Field Goals Made | 39.7 | — | — |
| Average Field Goals Attempted | 87.4 | — | — |
| Average 3-Point Field Goals Made | 12.7 | — | — |
| Average 3-Point Field Goals Attempted | 37.2 | — | — |
| Average Free Throws Made | 17.5 | — | — |
| Average Free Throws Attempted | 22.5 | — | — |
| Points Per Game | 109.6 | — | — |
| Offensive Rebounds Per Game | 10.4 | — | — |
| Assists Per Game | 23.2 | — | — |
| Turnovers Per Game | 12.8 | — | — |
| Offensive Rebound Percentage | 0.2 | 0.218 | — |
| Estimated Possessions | 8170.6 | 98.861 | — |
| Estimated Possessions Per Game | 99.6 | — | — |
| Points Per Estimated Possession | 1.1 | 1.109 | — |
| Team Turnovers Per Game | 0.8 | — | — |
| Total Turnovers Per Game | 13.6 | — | — |
| 3-Point Field Goal Percentage | 34.1 | 0.341 | 1st |
| 2-Point Field Goals Made | 2213.0 | 26.988 | 1st |
| 2-Point Field Goals Attempted | 4118.0 | 50.22 | 1st |
| 2-Point Field Goals Made per Game | 27.0 | — | — |
| 2-Point Field Goals Attempted per Game | 50.2 | — | — |
| 2-Point Field Goal Percentage | 53.7 | 0.537 | 1st |
| Shooting Efficiency | 0.53 | 0.527 | — |
| Scoring Efficiency | 1.254 | 1.254 | — |
| Fieldgoals Made Per 48 | 0.0 | — | — |
| Fieldgoals Attempted Per 48 | 0.0 | — | — |
| 3-Point Fieldgoals Made Per 48 | 0.0 | — | — |
| 3-Point Fieldgoals Attempted Per 48 | 0.0 | — | — |
| Freethrows Made Per 48 | 0.0 | — | — |
| Freethrows Attempted Per 48 | 0.0 | — | — |
| Points Scored Per 48 | 0.0 | — | — |
| Offensive Rebounds Per 48 | 0.0 | — | — |
| Assists Per 48 | 0.0 | — | — |
| Turnovers | 0.0 | — | — |
03 / PLAYERS, POSITIONS AND NUMBERS
Roster 2024-25
The roster could not be loaded right now.
04 / GAME-BY-GAME
Results 2024-25
| Date | Opponent | Result | Score |
|---|---|---|---|
| Apr 14, 2025 | vs Chicago Bulls | L | 102-122 |
| Apr 12, 2025 | vs Atlanta Hawks | L | 110-124 |
| Apr 10, 2025 | at Washington Wizards | W | 122-103 |
| Apr 8, 2025 | at Miami Heat | L | 105-117 |
| Apr 6, 2025 | vs Minnesota Timberwolves | L | 109-114 |
| Apr 4, 2025 | vs Milwaukee Bucks | L | 113-126 |
| Apr 2, 2025 | at New York Knicks | L | 91-105 |
| Mar 31, 2025 | vs Toronto Raptors | L | 109-127 |
| Mar 30, 2025 | vs Miami Heat | L | 95-118 |
| Mar 27, 2025 | vs Washington Wizards | L | 114-119 |
| Mar 25, 2025 | at New Orleans Pelicans | L | 99-112 |
| Mar 24, 2025 | at Atlanta Hawks | L | 119-132 |
| Mar 22, 2025 | at San Antonio Spurs | L | 120-128 |
| Mar 20, 2025 | at Oklahoma City Thunder | L | 100-133 |
| Mar 18, 2025 | at Houston Rockets | L | 137-144 |
| Mar 17, 2025 | at Dallas Mavericks | W | 130-125 |
| Mar 15, 2025 | vs Indiana Pacers | L | 100-112 |
| Mar 13, 2025 | at Toronto Raptors | L | 105-118 |
| Mar 11, 2025 | at Atlanta Hawks | L | 123-132 |
| Mar 10, 2025 | vs Utah Jazz | W | 126-122 |
| Mar 7, 2025 | at Boston Celtics | L | 105-123 |
| Mar 5, 2025 | at Minnesota Timberwolves | L | 112-126 |
| Mar 4, 2025 | vs Portland Trail Blazers | L | 102-119 |
| Mar 2, 2025 | vs Golden State Warriors | W | 126-119 |
| Feb 27, 2025 | at New York Knicks | L | 105-110 |
| Feb 25, 2025 | vs Chicago Bulls | L | 110-142 |
| Feb 23, 2025 | vs Brooklyn Nets | L | 103-105 |
| Feb 21, 2025 | vs Boston Celtics | L | 104-124 |
| Feb 13, 2025 | at Brooklyn Nets | L | 96-100 |
| Feb 12, 2025 | vs Toronto Raptors | L | 103-106 |
| Feb 10, 2025 | at Milwaukee Bucks | L | 127-135 |
| Feb 8, 2025 | at Detroit Pistons | L | 112-125 |
| Feb 6, 2025 | vs Miami Heat | L | 101-108 |
| Feb 5, 2025 | vs Dallas Mavericks | W | 118-116 |
| Feb 3, 2025 | vs Boston Celtics | L | 110-118 |
| Feb 1, 2025 | vs Denver Nuggets | L | 134-137 |
| Jan 30, 2025 | vs Sacramento Kings | W | 117-104 |
| Jan 29, 2025 | vs Los Angeles Lakers | W | 118-104 |
| Jan 26, 2025 | at Chicago Bulls | W | 109-97 |
| Jan 25, 2025 | vs Cleveland Cavaliers | W | 132-129 |
Most recent 40 completed games, 2024-25.
05 / PAYROLL AND SALARIES
Contracts
2026-27 payroll on file: $199.94M across 9 players.
| Player | 2026-27 | Total | Type / notes |
|---|---|---|---|
 Joel Embiid | $58.1M | $394.05M | |
 Jaylen Brown | $57.08M | $291.9M | |
 Tyrese Maxey | $40.77M | $126.03M | |
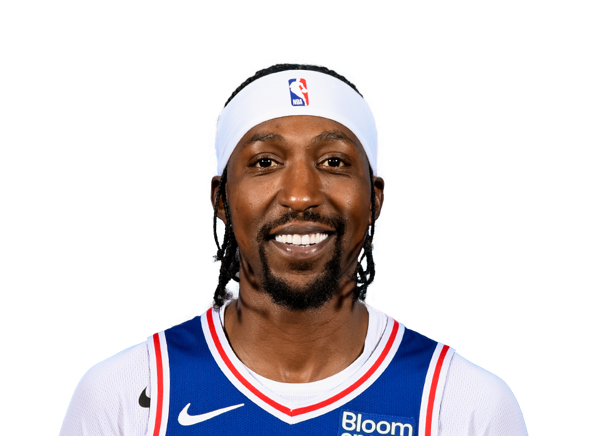 Kentavious Caldwell-Pope | $21.62M | $164.23M | |
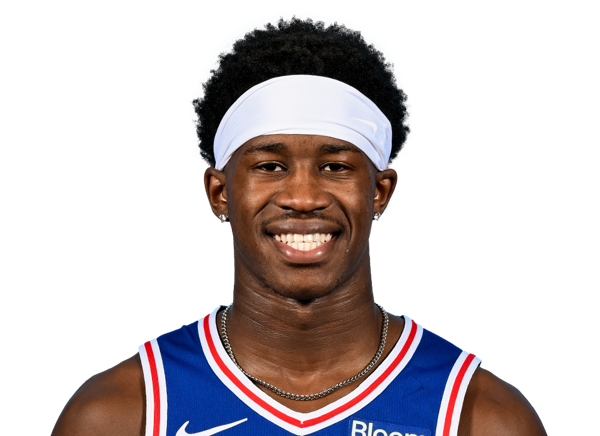 VJ Edgecombe | $11.66M | $22.77M | |
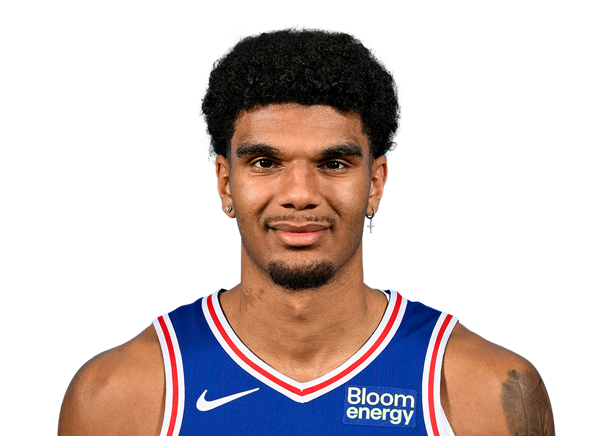 Dominick Barlow | $3.42M | $7.78M | |
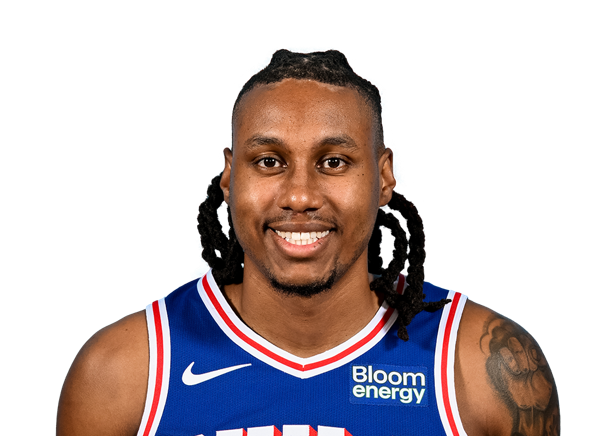 Jabari Walker | $2.58M | $8.07M | |
 Justin Edwards | $2.41M | $4.89M | |
 Adem Bona | $2.3M | $5.41M |
06 / CURRENT INJURY REPORT
Injuries
LeBron James Day-To-Day
Philadelphia 76ers · Back / Torso · est. return Nov 18
Philadelphia 76ers · Back / Torso · est. return Nov 18
James (back) has been ruled out for Monday's game against the Nets.
Dominick Barlow Out
Philadelphia 76ers · Back / Torso / Fracture · est. return Nov 18
Philadelphia 76ers · Back / Torso / Fracture · est. return Nov 18
Barlow (back) will be re-evaluated later in the week and is thought to be nearing his 2026-27 season debut, Tony Jones of The Athletic reports.
Adem Bona Out
Philadelphia 76ers · Back / Torso / Sprain · est. return Nov 21
Philadelphia 76ers · Back / Torso / Sprain · est. return Nov 21
Bona (back) will be re-evaluated in approximately one week after seeing a specialist, Ky Carlin of USA Today reports.
Ariel Hukporti Out
Philadelphia 76ers · Achilles / Leg / Surgery · est. return Oct 1
Philadelphia 76ers · Achilles / Leg / Surgery · est. return Oct 1
Hukporti has sustained a season-ending ruptured right Achilles tendon, per Shams Charania of ESPN.
07 / SIGNINGS, TRADES AND ROSTER MOVES
Adjustments & transactions
- Waived Fs Cris Carroll, Taye Fields and Dillon Jones. Waived G Jameer Nelson Jr.
- Signed F LeBron James to a contract. Waived F Dalen Terry.