


Oklahoma City Thunder
2026-27: 64-18 (#1 Western) · 7th in Western Conference Division · Paycom Center
Record since 2022-23
| Season | W | L | PCT | Seed | Home | Away | Div | Conf | PPG | OPP | DIFF | Streak |
|---|---|---|---|---|---|---|---|---|---|---|---|---|
| 2022-23 | 24 | 58 | .293 | #14 Western | 12-29 | 12-29 | 6-10 | 17-35 | 103.7 | 111.8 | -8.1 | L3 |
| 2023-24 | 40 | 42 | .488 | #10 Western | 24-17 | 16-25 | 9-7 | 25-27 | 117.5 | 116.4 | +1.1 | W2 |
| 2024-25 | 57 | 25 | .695 | #1 Western | 33-8 | 24-17 | 12-4 | 36-16 | 120.1 | 112.7 | +7.4 | W5 |
| 2025-26 | 68 | 14 | .829 | #1 Western | 35-6 | 32-8 | 12-4 | 39-13 | 120.5 | 107.6 | +12.9 | W4 |
| 2026-27 | 64 | 18 | .780 | #1 Western | 34-7 | 30-10 | 12-4 | 41-11 | 119.0 | 107.9 | +11.1 | L2 |
Combined record since 2022-23: 253-157 (61.7%). Click a season to load that year’s stats, roster and results below. 2026-27 is still in progress.
Team statistics 2024-25
Defensive
| Metric | Total | Per game | NBA rank |
|---|---|---|---|
| Blocks | 465 | 5.671 | 1st |
| Defensive Rebounds | 2801 | 34.159 | 3rd |
| Steals | 847 | 10.329 | 1st |
| Points Conceded Off Turnovers | 0 | 12 | — |
| Defensive Rebound Rate | 0.0 | — | — |
| Defensive Rebounds Per Game | 34.2 | — | — |
| Blocks Per Game | 5.7 | — | — |
| Steals Per Game | 10.3 | — | — |
| Defensive Rebounds Per 48 | 0.0 | — | — |
| Blocks Per 48 | 0.0 | — | — |
| Steals Per 48 | 0.0 | — | — |
General
| Metric | Total | Per game | NBA rank |
|---|---|---|---|
| Disqualifications | 0 | — | — |
| Flagrant Fouls | 4 | 0.049 | Tied-6th |
| Fouls | 1631 | 19.89 | 2nd |
| Rebound Rate | 50.0 | — | 10th |
| Ejections | 3 | 0.037 | Tied-5th |
| Technical Fouls | 62 | 0.378 | 12th |
| Rebounds | 3672 | 44.781 | — |
| Minutes | 0 | — | — |
| Minutes Per Game | 0.0 | — | — |
| Fantasy Rating | 0.0 | — | — |
| Rating | 228.1 | — | — |
| Plus-Minus | -1 | -1 | Tied-1st |
| Game Day of Year | 0 | — | — |
| Rebounds Per Game | 44.8 | — | — |
| Fouls Per Game | 19.9 | — | — |
| Flagrant Fouls Per Game | 0.0 | — | — |
| Technical Fouls Per Game | 0.8 | — | — |
| Ejections Per Game | 0.0 | — | — |
| Disqualifications Per Game | 0.0 | — | — |
| Assist To Turnover Ratio | 2.4 | 2.436 | — |
| Steal To Foul Ratio | 0.5 | 0.519 | — |
| Block To Foul Ratio | 0.3 | 0.285 | — |
| Team Rebounds Per Game | 0.0 | — | — |
| Rebounds | 3672 | 44.781 | — |
| Total Technical Fouls | 62 | 0.378 | — |
| Assist To Turnover Ratio | 38.6 | — | — |
| Team Rebounds | 0 | — | — |
| Steal To Turnover Ratio | 0.9 | 0.937 | — |
| Rebounds Per 48 Minutes | 0.0 | — | — |
| Fouls Per 48 Minutes | 0.0 | — | — |
| Flagrant Fouls Per 48 Minutes | 0.0 | — | — |
| Technical Fouls Per 48 Minutes | 0.0 | — | — |
| Ejections Per 48 Minutes | 0.0 | — | — |
| Disqualifications Per 48 Minutes | 0.0 | — | — |
| Games Played | 82 | — | Tied-1st |
| Games Started | 0 | — | — |
| Double Double | 0 | — | — |
| Triple Double | 0 | — | — |
Offensive
| Metric | Total | Per game | NBA rank |
|---|---|---|---|
| Assists | 2202 | 26.854 | 6th |
| Effective Field Goal Percentage | 56.0 | — | 3rd |
| Field Goals | 3660/7600 | 0.482 | — |
| Field Goals Attempted | 7600 | 92.683 | 3rd |
| Field Goals Made | 3660 | 44.634 | 3rd |
| Field Goal Percentage | 48.2 | 0.482 | 3rd |
| Free Throws | 1369/1672 | 0.819 | — |
| Free Throw Percentage | 81.9 | 0.819 | 1st |
| Free Throws Attempted | 1672 | 20.39 | 15th |
| Free Throws Made | 1369 | 16.695 | 12th |
| Offensive Rebounds | 871 | 10.622 | 11th |
| Points | 9881 | 120.5 | 3rd |
| Turnovers | 904 | 11.024 | 15th |
| 3-Point Field Goal Percentage | 37.4 | 0.374 | 4th |
| 3-Point Field Goals Attempted | 3184 | 38.829 | 5th |
| 3-Point Field Goals Made | 1192 | 14.537 | 3rd |
| True Shooting Percentage | 59.3 | — | Tied-3rd |
| Team Turnovers | 57 | — | 13th |
| Total Turnovers | 961 | 11.024 | — |
| Assist Ratio | 19.2 | — | 7th |
| Points in the Paint | 4192 | 51 | 5th |
| Offensive Rebound Rate | 24.2 | — | 12th |
| Turnover Ratio | 10.3 | — | 15th |
| Fast Break Points | 1318 | — | — |
| Possessions | 8426 | — | 4th |
| Pace Factor | 102.6 | — | 3rd |
| Average Field Goals Made | 44.6 | — | — |
| Average Field Goals Attempted | 92.7 | — | — |
| Average 3-Point Field Goals Made | 14.5 | — | — |
| Average 3-Point Field Goals Attempted | 38.8 | — | — |
| Average Free Throws Made | 16.7 | — | — |
| Average Free Throws Attempted | 20.4 | — | — |
| Points Per Game | 120.5 | — | — |
| Offensive Rebounds Per Game | 10.6 | — | — |
| Assists Per Game | 26.9 | — | — |
| Turnovers Per Game | 11.0 | — | — |
| Offensive Rebound Percentage | 0.2 | 0.221 | — |
| Estimated Possessions | 8358.8 | 101.241 | — |
| Estimated Possessions Per Game | 101.9 | — | — |
| Points Per Estimated Possession | 1.2 | 1.19 | — |
| Team Turnovers Per Game | 0.7 | — | — |
| Total Turnovers Per Game | 11.7 | — | — |
| 3-Point Field Goal Percentage | 37.4 | 0.374 | — |
| 2-Point Field Goals Made | 2468.0 | 30.097 | — |
| 2-Point Field Goals Attempted | 4416.0 | 53.854 | Tied-2nd |
| 2-Point Field Goals Made per Game | 30.1 | — | — |
| 2-Point Field Goals Attempted per Game | 53.9 | — | — |
| 2-Point Field Goal Percentage | 55.9 | 0.559 | — |
| Shooting Efficiency | 0.56 | 0.56 | — |
| Scoring Efficiency | 1.300 | 1.3 | — |
| Fieldgoals Made Per 48 | 0.0 | — | — |
| Fieldgoals Attempted Per 48 | 0.0 | — | — |
| 3-Point Fieldgoals Made Per 48 | 0.0 | — | — |
| 3-Point Fieldgoals Attempted Per 48 | 0.0 | — | — |
| Freethrows Made Per 48 | 0.0 | — | — |
| Freethrows Attempted Per 48 | 0.0 | — | — |
| Points Scored Per 48 | 0.0 | — | — |
| Offensive Rebounds Per 48 | 0.0 | — | — |
| Assists Per 48 | 0.0 | — | — |
| Turnovers | 0.0 | — | — |
Roster 2024-25
Results 2024-25
| Date | Opponent | Result | Score |
|---|---|---|---|
| Apr 14, 2025 | at New Orleans Pelicans | W | 115-100 |
| Apr 12, 2025 | at Utah Jazz | W | 145-111 |
| Apr 10, 2025 | at Phoenix Suns | W | 125-112 |
| Apr 9, 2025 | vs Los Angeles Lakers | W | 136-120 |
| Apr 7, 2025 | vs Los Angeles Lakers | L | 99-126 |
| Apr 5, 2025 | at Houston Rockets | L | 111-125 |
| Apr 3, 2025 | vs Detroit Pistons | W | 119-103 |
| Apr 1, 2025 | vs Chicago Bulls | W | 145-117 |
| Mar 30, 2025 | vs Indiana Pacers | W | 132-111 |
| Mar 28, 2025 | vs Memphis Grizzlies | W | 125-104 |
| Mar 26, 2025 | at Sacramento Kings | W | 121-105 |
| Mar 24, 2025 | at LA Clippers | W | 103-101 |
| Mar 22, 2025 | vs Charlotte Hornets | W | 141-106 |
| Mar 20, 2025 | vs Philadelphia 76ers | W | 133-100 |
| Mar 17, 2025 | at Milwaukee Bucks | W | 121-105 |
| Mar 16, 2025 | at Detroit Pistons | W | 113-107 |
| Mar 13, 2025 | at Boston Celtics | W | 118-112 |
| Mar 11, 2025 | vs Denver Nuggets | L | 127-140 |
| Mar 10, 2025 | vs Denver Nuggets | W | 127-103 |
| Mar 8, 2025 | vs Portland Trail Blazers | W | 107-89 |
| Mar 6, 2025 | at Memphis Grizzlies | W | 120-103 |
| Mar 4, 2025 | vs Houston Rockets | W | 137-128 |
| Mar 3, 2025 | at San Antonio Spurs | W | 146-132 |
| Mar 1, 2025 | at Atlanta Hawks | W | 135-119 |
| Feb 27, 2025 | at Brooklyn Nets | W | 129-121 |
| Feb 25, 2025 | vs Minnesota Timberwolves | L | 128-131 |
| Feb 24, 2025 | at Minnesota Timberwolves | W | 130-123 |
| Feb 22, 2025 | at Utah Jazz | W | 130-107 |
| Feb 14, 2025 | at Minnesota Timberwolves | L | 101-116 |
| Feb 13, 2025 | vs Miami Heat | W | 115-101 |
| Feb 11, 2025 | vs New Orleans Pelicans | W | 137-101 |
| Feb 9, 2025 | at Memphis Grizzlies | W | 125-112 |
| Feb 8, 2025 | vs Toronto Raptors | W | 121-109 |
| Feb 6, 2025 | vs Phoenix Suns | W | 140-109 |
| Feb 4, 2025 | vs Milwaukee Bucks | W | 125-96 |
| Feb 2, 2025 | vs Sacramento Kings | W | 144-110 |
| Jan 30, 2025 | at Golden State Warriors | L | 109-116 |
| Jan 27, 2025 | at Portland Trail Blazers | W | 118-108 |
| Jan 24, 2025 | vs Dallas Mavericks | L | 115-121 |
| Jan 23, 2025 | vs Utah Jazz | W | 123-114 |
Most recent 40 completed games, 2024-25.
Contracts
2026-27 payroll on file: $217.22M across 14 players.
| Player | 2026-27 | Total | Type / notes |
|---|---|---|---|
 Chet Holmgren | $41.5M | $86.39M | |
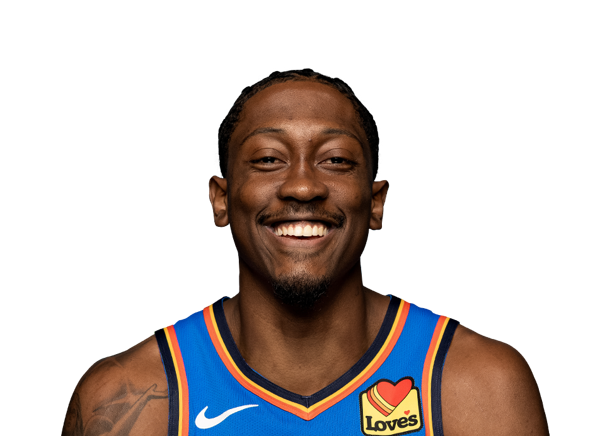 Jalen Williams | $41.5M | $61.76M | |
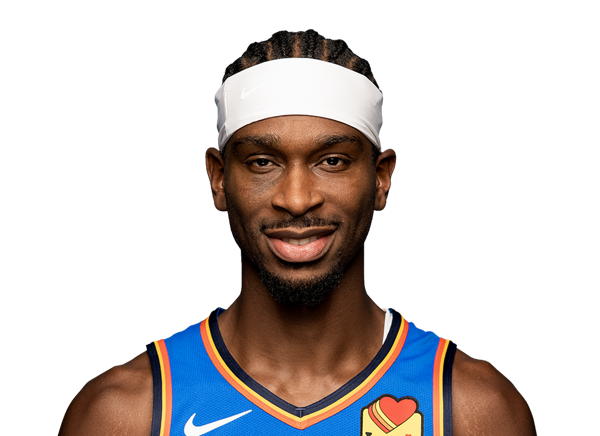 Shai Gilgeous-Alexander | $40.81M | $196.26M | |
 Isaiah Hartenstein | $28.5M | $109.6M | |
 Alex Caruso | $19.55M | $80.73M | |
 Jaylin Williams | $7.77M | $22.25M | |
 Cason Wallace | $7.42M | $24.09M | |
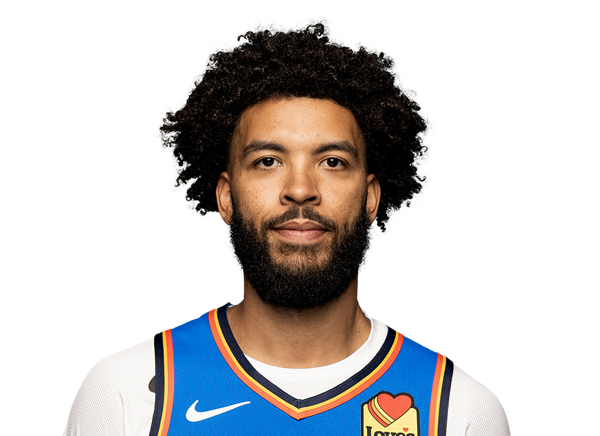 Kenrich Williams | $7.16M | $35.43M | |
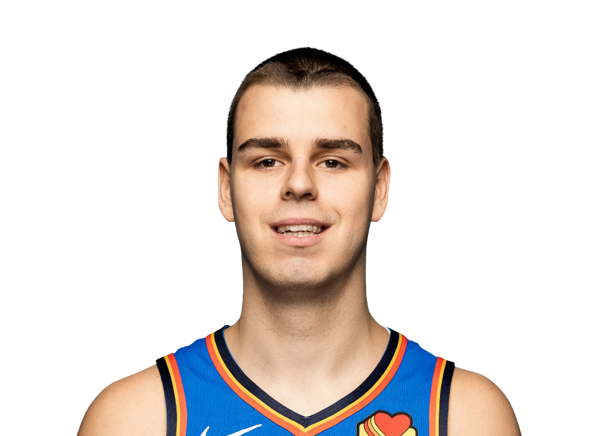 Nikola Topic | $5.43M | $15.55M | |
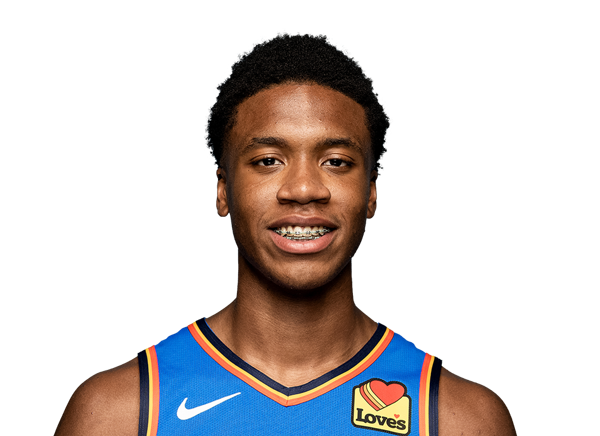 Thomas Sorber | $4.89M | $9.54M | |
 Jared McCain | $4.42M | $12.68M | |
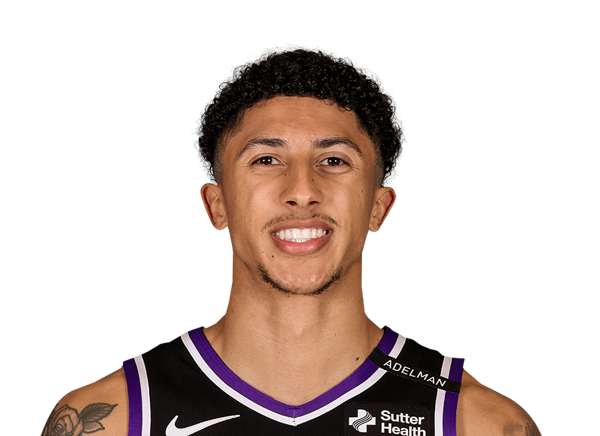 Nique Clifford | $3.26M | $6.37M | |
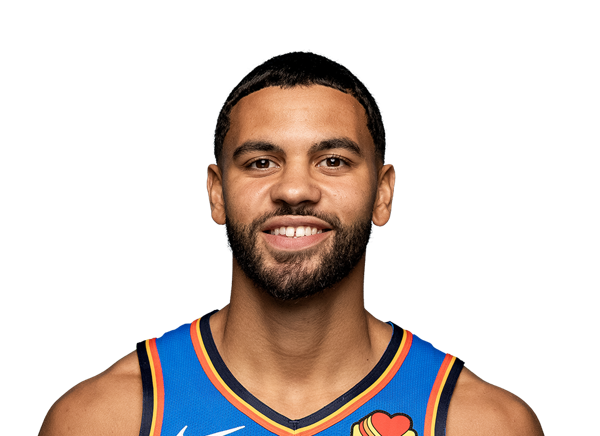 Ajay Mitchell | $2.85M | $8.85M | |
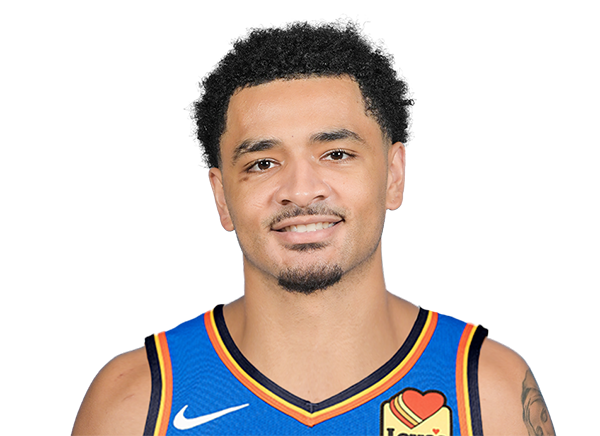 Micah Peavy | $2.15M | $3.42M |
Injuries
Oklahoma City Thunder · Back / Torso / Spasms · est. return Nov 18
Williams (back) has been ruled out for Sunday's game against the Kings.
Oklahoma City Thunder · Knee / Leg · est. return Nov 20
Sorber (knee) has been ruled out for Friday's game against the Clippers.
Oklahoma City Thunder · Shoulder / Arm / Surgery · est. return Mar 2
Wallace underwent surgery Friday to repair a torn labrum in his left shoulder and will be re-evaluated before the end of the regular season, Clemente Almanza of USA Today reports.
Oklahoma City Thunder · Knee / Leg · est. return Jan 2
Holmgren underwent a biological treatment Friday to address a small patellar tendon tear and will miss at least 8-10 weeks, Nick Crain of Slam reports.
Oklahoma City Thunder · Leg / Leg / Fracture · est. return Mar 2
Williams (leg) underwent successful surgery Wednesday to "address a fractured left fibula and reconstruction of ankle ligaments following a fracture and dislocation." He will be re-evaluated before the end of the regular season, Tim MacMahon of ESPN.com reports.
Adjustments & transactions
- Waived F Dalen Terry.
- Signed F Dalen Terry to a contract for the remainder of the season.
- Re-signed G Cason Wallace to a rookie-scale contract extension.
- Waived F Buddy Boeheim, C Christoph Tilly and Gs. Nate Johnson, Dariq Whitehead and Lamar Wilderson.
- Waived G Robert McCray V.