Click a season to open this player’s full game log, splits and advanced stats for that year; click a team to open its page. A dash means no NBA games were recorded.
03 / EVERY CATEGORY THE PROVIDER REPORTS
Full statistical breakdown
Regular season 2026-27
Defensive
Metric
Total
NBA rank
Blocks
0
Tied-370th
Defensive Rebounds
7
Tied-349th
Steals
7
Tied-193rd
Defensive Rebound Rate
0.0
—
Defensive Rebounds Per Game
2.3
—
Blocks Per Game
0.0
—
Steals Per Game
2.3
—
Defensive Rebounds Per 48
6.9
Tied-2,792nd
Blocks Per 48
0.0
Tied-2,960th
Steals Per 48
6.9
Tied-1,544th
General
Metric
Total
NBA rank
Disqualifications
0
Tied-21st
Flagrant Fouls
0
Tied-22nd
Fouls
7
Tied-340th
Player Efficiency Rating
13.56
—
Rebound Rate
0.0
—
Ejections
0
Tied-7th
Technical Fouls
0
Tied-101st
Rebounds
8
—
Value Over Replacement Player
2.0
—
Minutes
49
6th
Minutes Per Game
16.3
—
Rating
12.5
Tied-637th
Plus-Minus
+5
Tied-1st
Rebounds Per Game
2.7
—
Fouls Per Game
2.3
—
Flagrant Fouls Per Game
0.0
—
Technical Fouls Per Game
0.0
—
Ejections Per Game
0.0
—
Disqualifications Per Game
0.0
—
Assist To Turnover Ratio
1.3
—
Steal To Foul Ratio
1.0
—
Block To Foul Ratio
0.0
—
Team Rebounds Per Game
0.0
—
Rebounds
8
—
Total Technical Fouls
0
—
Assist To Turnover Ratio
0.0
—
Steal To Turnover Ratio
2.3
—
Rebounds Per 48 Minutes
7.8
—
Fouls Per 48 Minutes
6.9
Tied-2,720th
Flagrant Fouls Per 48 Minutes
0.0
Tied-176th
Technical Fouls Per 48 Minutes
0.0
Tied-808th
Ejections Per 48 Minutes
0.0
Tied-56th
Disqualifications Per 48 Minutes
0.0
Tied-168th
R/40
6.5
—
Games Played
3
3rd
Games Started
3
Tied-177th
Double Double
0
Tied-119th
Triple Double
0
Tied-12th
Offensive
Metric
Total
NBA rank
Assists
4
Tied-351st
Effective Field Goal Percentage
47.5
—
Field Goals
8/20
—
Field Goals Attempted
20
Tied-340th
Field Goals Made
8
Tied-345th
Field Goal Percentage
40.0
—
Free Throws
0/0
—
Free Throw Percentage
0.0
—
Free Throws Attempted
0
Tied-418th
Free Throws Made
0
Tied-413th
Offensive Rebounds
1
Tied-386th
Points
19
Tied-353rd
Turnovers
3
Tied-340th
3-Point Field Goal Percentage
30.0
—
3-Point Field Goals Attempted
10
Tied-304th
3-Point Field Goals Made
3
Tied-293rd
True Shooting Percentage
47.5
—
Total Turnovers
3
—
Assist Ratio
14.8
—
Points in the Paint
0
Tied-1st
Offensive Rebound Rate
0.0
—
Turnover Ratio
11.1
—
Brick Index
0.00
—
Usage Rate
0.0
—
Average Field Goals Made
2.7
—
Average Field Goals Attempted
6.7
—
Average 3-Point Field Goals Made
1.0
—
Average 3-Point Field Goals Attempted
3.3
—
Average Free Throws Made
0.0
—
Average Free Throws Attempted
0.0
—
Points Per Game
6.3
—
Offensive Rebounds Per Game
0.3
—
Assists Per Game
1.3
—
Turnovers Per Game
1.0
—
Offensive Rebound Percentage
0.1
—
Estimated Possessions
22.0
—
Estimated Possessions Per Game
7.3
—
Points Per Estimated Possession
0.9
—
Team Turnovers Per Game
0.0
—
Total Turnovers Per Game
1.0
—
3-Point Field Goal Percentage
30.0
—
2-Point Field Goals Made
5.0
Tied-52nd
2-Point Field Goals Attempted
10.0
Tied-36th
2-Point Field Goals Made per Game
1.7
—
2-Point Field Goals Attempted per Game
3.3
—
2-Point Field Goal Percentage
50.0
—
Shooting Efficiency
0.48
—
Scoring Efficiency
0.950
—
Fieldgoals Made Per 48
7.8
Tied-2,760th
Fieldgoals Attempted Per 48
19.6
Tied-2,720th
3-Point Fieldgoals Made Per 48
2.9
Tied-2,344th
3-Point Fieldgoals Attempted Per 48
9.8
Tied-2,432nd
Freethrows Made Per 48
0.0
Tied-3,304th
Freethrows Attempted Per 48
0.0
Tied-3,344th
Points Scored Per 48
18.6
Tied-2,824th
Offensive Rebounds Per 48
1.0
Tied-3,088th
Assists Per 48
3.9
Tied-2,808th
Turnovers
2.9
Tied-2,720th
P/40
15.5
—
A/40
3.3
—
04 / EFFICIENCY, SHOOTING PROFILE, PER-36
Advanced metrics
True shooting %47.0%
Effective FG %47.8%
2-point FG %50.0%
3-point attempt rate49.3%
Free throw rate0.0%
Points per shot attempt0.94
% of points from 3s47.6%
Assist-to-turnover1.30
Points per 36 min13.9
Rebounds per 36 min6.0
Assists per 36 min2.9
Steals per 36 min5.08
Blocks per 36 min0.00
Turnovers per 36 min2.21
Stocks (STL + BLK) per game2.30
Pts + Reb + Ast per game10.3
Efficiency (EFF) per game7.6
Game Score per game (Hollinger)4.9
Minutes per game16.3
Calculated by BallersCulture from the supplied 2026-27 box-score totals using standard formulas (hover a tile to see the formula). Tracking-based metrics such as BPM, VORP, on/off and RAPTOR are not available from this data source.
05 / 3 GAMES IN 2026-27
Game log: Regular season
Date
Opp
Result
MIN
FG
FG%
3PT
3P%
FT
FT%
REB
AST
BLK
STL
PF
TO
PTS
Oct 26
vs LAC
W 108-101
6
2-4
50.0
0-0
0.0
0-0
0.0
3
1
0
2
0
2
4
Oct 23
vs DEN
W 96-84
24
3-8
37.5
3-6
50.0
0-0
0.0
2
1
0
4
4
0
9
Oct 21
@ SA
W 116-104
19
3-8
37.5
0-4
0.0
0-0
0.0
3
2
0
1
3
1
6
06 / 2026-27 HOME / AWAY, RESULTS, MONTHS AND OPPONENTS
Splits
split
Split
GP
MIN
FG
FG%
3PT
3P%
FT
FT%
OR
DR
REB
AST
BLK
STL
PF
TO
PTS
All Splits
3
16.3
2.7-6.7
40.0
1.0-3.3
30.0
0.0-0.0
0.0
0.3
2.3
2.7
1.3
0.0
2.3
2.3
1.0
6.3
Home
2
15.0
2.5-6.0
41.7
1.5-3.0
50.0
0.0-0.0
0.0
0.5
2.0
2.5
1.0
0.0
3.0
2.0
1.0
6.5
Road
1
19.0
3.0-8.0
37.5
0.0-4.0
0.0
0.0-0.0
0.0
0.0
3.0
3.0
2.0
0.0
1.0
3.0
1.0
6.0
vs. Division
1
24.0
3.0-8.0
37.5
3.0-6.0
50.0
0.0-0.0
0.0
0.0
2.0
2.0
1.0
0.0
4.0
4.0
0.0
9.0
vs. Conference
3
16.3
2.7-6.7
40.0
1.0-3.3
30.0
0.0-0.0
0.0
0.3
2.3
2.7
1.3
0.0
2.3
2.3
1.0
6.3
3+ Days Rest
1
19.0
3.0-8.0
37.5
0.0-4.0
0.0
0.0-0.0
0.0
0.0
3.0
3.0
2.0
0.0
1.0
3.0
1.0
6.0
Month
Split
GP
MIN
FG
FG%
3PT
3P%
FT
FT%
OR
DR
REB
AST
BLK
STL
PF
TO
PTS
October
3
16.3
2.7-6.7
40.0
1.0-3.3
30.0
0.0-0.0
0.0
0.3
2.3
2.7
1.3
0.0
2.3
2.3
1.0
6.3
Pre All-Star
3
16.3
2.7-6.7
40.0
1.0-3.3
30.0
0.0-0.0
0.0
0.3
2.3
2.7
1.3
0.0
2.3
2.3
1.0
6.3
Result
Split
GP
MIN
FG
FG%
3PT
3P%
FT
FT%
OR
DR
REB
AST
BLK
STL
PF
TO
PTS
Wins
3
16.3
2.7-6.7
40.0
1.0-3.3
30.0
0.0-0.0
0.0
0.3
2.3
2.7
1.3
0.0
2.3
2.3
1.0
6.3
Position
Split
GP
MIN
FG
FG%
3PT
3P%
FT
FT%
OR
DR
REB
AST
BLK
STL
PF
TO
PTS
As Starter
3
16.3
2.7-6.7
40.0
1.0-3.3
30.0
0.0-0.0
0.0
0.3
2.3
2.7
1.3
0.0
2.3
2.3
1.0
6.3
Day
Split
GP
MIN
FG
FG%
3PT
3P%
FT
FT%
OR
DR
REB
AST
BLK
STL
PF
TO
PTS
Tuesday
1
19.0
3.0-8.0
37.5
0.0-4.0
0.0
0.0-0.0
0.0
0.0
3.0
3.0
2.0
0.0
1.0
3.0
1.0
6.0
Thursday
1
24.0
3.0-8.0
37.5
3.0-6.0
50.0
0.0-0.0
0.0
0.0
2.0
2.0
1.0
0.0
4.0
4.0
0.0
9.0
Sunday
1
6.0
2.0-4.0
50.0
0.0-0.0
0.0
0.0-0.0
0.0
1.0
2.0
3.0
1.0
0.0
2.0
0.0
2.0
4.0
Opponent
Split
GP
MIN
FG
FG%
3PT
3P%
FT
FT%
OR
DR
REB
AST
BLK
STL
PF
TO
PTS
Denver Nuggets
1
24.0
3.0-8.0
37.5
3.0-6.0
50.0
0.0-0.0
0.0
0.0
2.0
2.0
1.0
0.0
4.0
4.0
0.0
9.0
Los Angeles Clippers
1
6.0
2.0-4.0
50.0
0.0-0.0
0.0
0.0-0.0
0.0
1.0
2.0
3.0
1.0
0.0
2.0
0.0
2.0
4.0
San Antonio Spurs
1
19.0
3.0-8.0
37.5
0.0-4.0
0.0
0.0-0.0
0.0
0.0
3.0
3.0
2.0
0.0
1.0
3.0
1.0
6.0
07 / SEASON-BY-SEASON HISTORY
Career statistics
Regular Season Averages
Season
Team
GP
GS
MIN
FG
FG%
3PT
3P%
FT
FT%
OR
DR
REB
AST
BLK
STL
PF
TO
PTS
2023-24
Oklahoma City Thunder
82
13
20.6
2.6-5.4
49.1
1.2-2.9
41.9
0.4-0.5
78.4
0.6
1.6
2.3
1.5
0.5
0.9
1.6
0.5
6.8
2024-25
Oklahoma City Thunder
68
43
27.6
3.4-7.2
47.4
1.1-3.1
35.6
0.4-0.5
81.1
1.0
2.3
3.4
2.5
0.5
1.8
2.1
0.9
8.4
2025-26
Oklahoma City Thunder
77
58
26.6
3.3-7.6
43.2
1.3-3.7
35.1
0.7-0.9
80.9
0.8
2.3
3.1
2.6
0.4
1.9
2.0
0.9
8.6
2026-27
Oklahoma City Thunder
3
3
16.3
2.7-6.7
40.0
1.0-3.3
30.0
0.0-0.0
0.0
0.3
2.3
2.7
1.3
0.0
2.3
2.3
1.0
6.3
Career
—
230
117
24.6
3.1-6.7
46.2
1.2-3.2
37.3
0.5-0.6
80.3
0.8
2.1
2.9
2.2
0.4
1.5
1.9
0.8
7.9
Regular Season Totals
Season
Team
FG
FG%
3PT
3P%
FT
FT%
OR
DR
REB
AST
BLK
STL
PF
TO
PTS
2023-24
Oklahoma City Thunder
217-442
49.1
98-234
41.9
29-37
78.4
52
135
187
120
37
76
129
45
561
2024-25
Oklahoma City Thunder
232-489
47.4
74-208
35.6
30-37
81.1
71
158
229
173
35
120
145
59
568
2025-26
Oklahoma City Thunder
252-584
43.2
101-288
35.1
55-68
80.9
63
175
238
200
28
150
154
73
660
2026-27
Oklahoma City Thunder
8-20
40.0
3-10
30.0
0-0
0.0
1
7
8
4
0
7
7
3
19
Career
—
709-1535
46.2
276-740
37.3
114-142
80.3
187
475
662
497
100
353
435
180
1808
Regular Season Misc Totals
Season
Team
DD2
TD3
DQ
EJECT
TECH
FLAG
AST/TO
STL/TO
SC-EFF
SH-EFF
2023-24
Oklahoma City Thunder
0
0
0
0
0
0
2.7
1.7
1.269
0.60
2024-25
Oklahoma City Thunder
0
0
0
0
1
0
2.9
2.0
1.162
0.55
2025-26
Oklahoma City Thunder
1
0
0
1
2
0
2.7
2.1
1.130
0.52
2026-27
Oklahoma City Thunder
0
0
0
0
0
0
1.3
2.3
0.950
0.48
Career
—
1
0
0
1
3
0
2.8
2.0
1.178
0.55
Scoring, rebounding and assist trend
08 / SHOT CHART AND ZONE SHOOTING
Shot profile
Shot-location data is not connected. Add a BALLDONTLIE GOAT-tier NBA API key in NBA Players → Settings to enable shot charts and zone shooting.
Re-signed G Cason Wallace to a rookie-scale contract extension.
13 / LATEST COVERAGE
Player news
LATEST UPDATEWallace underwent surgery Friday to repair a torn labrum in his left shoulder and will be re-evaluated before the end of the regular season, Clemente Almanza of USA Today reports.
Wallace is expected to miss most, if not all, of the season. However, there's still a chance he will return late in the campaign after sustaining the shoulder injury in Sunday's win over the Clippers. With Jalen Williams (leg) also set to be re-evaluated before the end of the regular season, Alex Caruso (ankle) should see significant playing time once cleared to return. In the meantime, Jared McCain, Bennett Stirtz and Josh Dix are expected to see increased burn.




 Aday MaraC #15
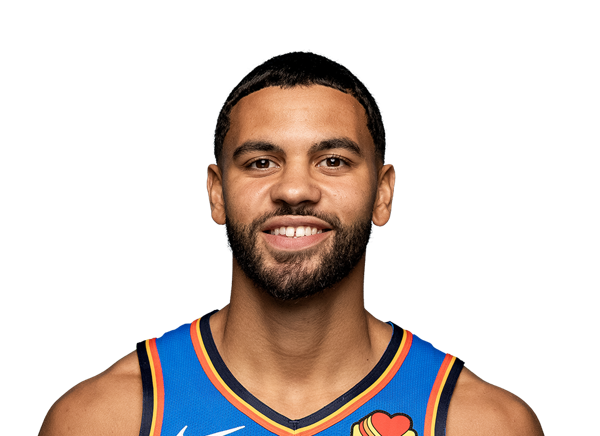 Ajay MitchellG #25
 Alex CarusoG #9
 Andrew HolifieldF #17
 Anthony PritchardG #5
 Bennett StirtzG #14
 Brooks BarnhizerF #23
 Buddy BoeheimF #14
 Chet HolmgrenC #7
 Christoph TillyC #33
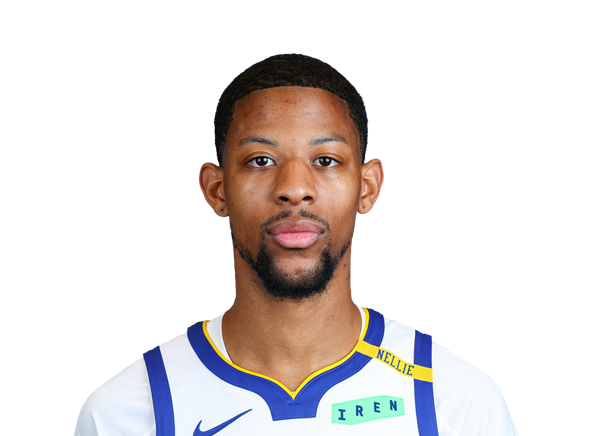 Dalen TerryG
 Isaiah HartensteinC #55
 Jalen WilliamsG #8
 Jared McCainG #3
 Jaylin WilliamsF #6
 Josh DixG #21
 Kenrich WilliamsG #34
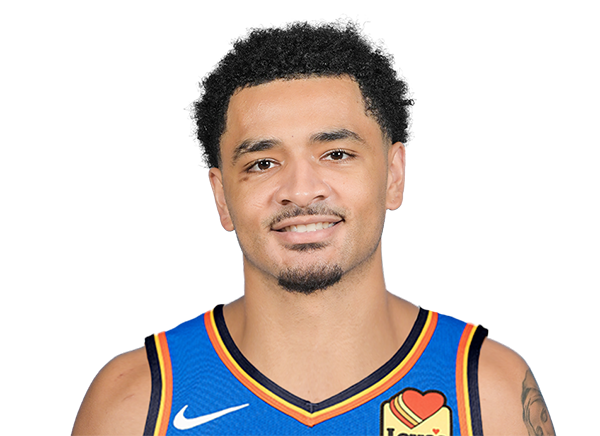 Micah PeavyG
 Nikola TopicG #44
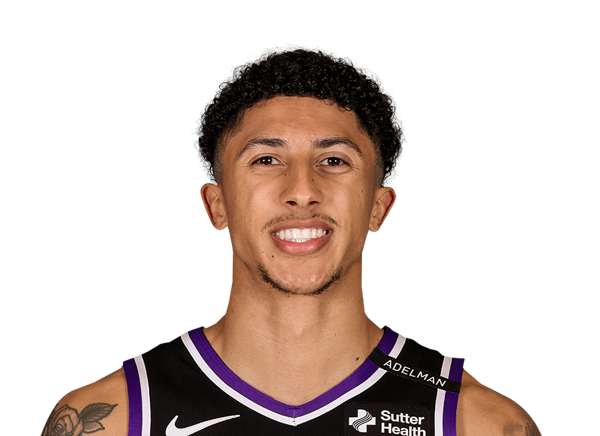 Nique CliffordG
 Ochai AgbajiG #30
 Otega OwehG #13
 Payton SandfortF #14
 Robert McCray VG #16
 Shai Gilgeous-AlexanderG #2
 Thomas SorberC #12
 Zhaire SmithG #40