Click a season to open this player’s full game log, splits and advanced stats for that year; click a team to open its page. A dash means no NBA games were recorded.
03 / EVERY CATEGORY THE PROVIDER REPORTS
Full statistical breakdown
Regular season 2026-27
Defensive
Metric
Total
NBA rank
Blocks
0
Tied-370th
Defensive Rebounds
26
Tied-200th
Steals
3
Tied-295th
Defensive Rebound Rate
0.0
—
Defensive Rebounds Per Game
3.7
—
Blocks Per Game
0.0
—
Steals Per Game
0.4
—
Defensive Rebounds Per 48
9.7
Tied-1,920th
Blocks Per 48
0.0
Tied-3,552nd
Steals Per 48
1.1
Tied-2,832nd
General
Metric
Total
NBA rank
Disqualifications
0
Tied-21st
Flagrant Fouls
0
Tied-22nd
Fouls
5
Tied-365th
Player Efficiency Rating
4.44
—
Rebound Rate
0.0
—
Ejections
0
Tied-7th
Technical Fouls
1
Tied-29th
Rebounds
28
—
Value Over Replacement Player
-12.3
—
Minutes
129
5th
Minutes Per Game
18.4
—
Rating
7.7
Tied-346th
Plus-Minus
-19
Tied-1st
Rebounds Per Game
4.0
—
Fouls Per Game
0.7
—
Flagrant Fouls Per Game
0.0
—
Technical Fouls Per Game
0.1
—
Ejections Per Game
0.0
—
Disqualifications Per Game
0.0
—
Assist To Turnover Ratio
2.8
—
Steal To Foul Ratio
0.6
—
Block To Foul Ratio
0.0
—
Team Rebounds Per Game
0.0
—
Rebounds
28
—
Total Technical Fouls
1
—
Assist To Turnover Ratio
0.0
—
Steal To Turnover Ratio
0.8
—
Rebounds Per 48 Minutes
10.4
—
Fouls Per 48 Minutes
1.9
Tied-3,504th
Flagrant Fouls Per 48 Minutes
0.0
Tied-211th
Technical Fouls Per 48 Minutes
0.4
Tied-278th
Ejections Per 48 Minutes
0.0
Tied-67th
Disqualifications Per 48 Minutes
0.0
Tied-201st
R/40
8.7
—
Games Played
7
7th
Games Started
1
Tied-219th
Double Double
0
Tied-119th
Triple Double
0
Tied-12th
Offensive
Metric
Total
NBA rank
Assists
11
Tied-270th
Effective Field Goal Percentage
28.3
—
Field Goals
6/30
—
Field Goals Attempted
30
313th
Field Goals Made
6
Tied-366th
Field Goal Percentage
20.0
—
Free Throws
3/3
—
Free Throw Percentage
100.0
—
Free Throws Attempted
3
Tied-358th
Free Throws Made
3
Tied-331st
Offensive Rebounds
2
Tied-358th
Points
20
Tied-349th
Turnovers
4
Tied-308th
3-Point Field Goal Percentage
20.8
—
3-Point Field Goals Attempted
24
Tied-238th
3-Point Field Goals Made
5
Tied-261st
True Shooting Percentage
31.9
—
Total Turnovers
4
—
Assist Ratio
23.7
—
Points in the Paint
0
Tied-1st
Offensive Rebound Rate
0.0
—
Turnover Ratio
8.6
—
Brick Index
0.00
—
Usage Rate
0.0
—
Average Field Goals Made
0.9
—
Average Field Goals Attempted
4.3
—
Average 3-Point Field Goals Made
0.7
—
Average 3-Point Field Goals Attempted
3.4
—
Average Free Throws Made
0.4
—
Average Free Throws Attempted
0.4
—
Points Per Game
2.9
—
Offensive Rebounds Per Game
0.3
—
Assists Per Game
1.6
—
Turnovers Per Game
0.6
—
Offensive Rebound Percentage
0.1
—
Estimated Possessions
33.2
—
Estimated Possessions Per Game
4.7
—
Points Per Estimated Possession
0.6
—
Team Turnovers Per Game
0.0
—
Total Turnovers Per Game
0.6
—
3-Point Field Goal Percentage
20.8
—
2-Point Field Goals Made
1.0
Tied-105th
2-Point Field Goals Attempted
6.0
551st
2-Point Field Goals Made per Game
0.1
—
2-Point Field Goals Attempted per Game
0.9
—
2-Point Field Goal Percentage
16.7
—
Shooting Efficiency
0.28
—
Scoring Efficiency
0.667
—
Fieldgoals Made Per 48
2.2
Tied-3,513th
Fieldgoals Attempted Per 48
11.2
3,004th
3-Point Fieldgoals Made Per 48
1.9
Tied-2,505th
3-Point Fieldgoals Attempted Per 48
8.9
Tied-2,284th
Freethrows Made Per 48
1.1
Tied-3,177th
Freethrows Attempted Per 48
1.1
Tied-3,436th
Points Scored Per 48
7.4
Tied-3,350th
Offensive Rebounds Per 48
0.7
Tied-3,436th
Assists Per 48
4.1
Tied-2,592nd
Turnovers
1.5
Tied-2,956th
P/40
6.2
—
A/40
3.4
—
04 / EFFICIENCY, SHOOTING PROFILE, PER-36
Advanced metrics
True shooting %32.4%
Effective FG %29.1%
2-point FG %22.2%
3-point attempt rate79.1%
Free throw rate9.3%
Points per shot attempt0.67
% of points from 3s72.4%
Assist-to-turnover2.67
Points per 36 min5.7
Rebounds per 36 min7.8
Assists per 36 min3.1
Steals per 36 min0.78
Blocks per 36 min0.00
Turnovers per 36 min1.17
Stocks (STL + BLK) per game0.40
Pts + Reb + Ast per game8.5
Efficiency (EFF) per game4.9
Game Score per game (Hollinger)2.2
Minutes per game18.4
Calculated by BallersCulture from the supplied 2026-27 box-score totals using standard formulas (hover a tile to see the formula). Tracking-based metrics such as BPM, VORP, on/off and RAPTOR are not available from this data source.
05 / 7 GAMES IN 2026-27
Game log: Regular season
Date
Opp
Result
MIN
FG
FG%
3PT
3P%
FT
FT%
REB
AST
BLK
STL
PF
TO
PTS
Nov 3
@ CLE
W 117-112
20
1-6
16.7
1-5
20.0
0-0
0.0
3
2
0
1
0
1
3
Nov 1
@ HOU
L 119-98
26
1-6
16.7
0-3
0.0
1-1
100.0
4
1
0
1
1
1
3
Oct 29
@ DAL
L 120-96
20
0-2
0.0
0-2
0.0
0-0
0.0
5
1
0
0
1
0
0
Oct 27
vs PHX
W 125-114
26
2-5
40.0
2-4
50.0
0-0
0.0
6
3
0
1
0
1
6
Oct 26
vs LAC
W 108-101
5
0-1
0.0
0-1
0.0
0-0
0.0
0
0
0
0
0
0
0
Oct 23
vs DEN
W 96-84
15
1-4
25.0
1-4
25.0
0-0
0.0
6
3
0
0
2
0
3
Oct 21
@ SA
W 116-104
17
1-6
16.7
1-5
20.0
2-2
100.0
4
1
0
0
1
1
5
06 / 2026-27 HOME / AWAY, RESULTS, MONTHS AND OPPONENTS
Splits
split
Split
GP
MIN
FG
FG%
3PT
3P%
FT
FT%
OR
DR
REB
AST
BLK
STL
PF
TO
PTS
All Splits
7
18.4
0.9-4.3
20.0
0.7-3.4
20.8
0.4-0.4
100.0
0.3
3.7
4.0
1.6
0.0
0.4
0.7
0.6
2.9
Home
3
15.3
1.0-3.3
30.0
1.0-3.0
33.3
0.0-0.0
0.0
0.0
4.0
4.0
2.0
0.0
0.3
0.7
0.3
3.0
Road
4
20.8
0.8-5.0
15.0
0.5-3.8
13.3
0.8-0.8
100.0
0.5
3.5
4.0
1.3
0.0
0.5
0.8
0.8
2.8
vs. Division
1
15.0
1.0-4.0
25.0
1.0-4.0
25.0
0.0-0.0
0.0
0.0
6.0
6.0
3.0
0.0
0.0
2.0
0.0
3.0
vs. Conference
6
18.2
0.8-4.0
20.8
0.7-3.2
21.1
0.5-0.5
100.0
0.2
4.0
4.2
1.5
0.0
0.3
0.8
0.5
2.8
3+ Days Rest
1
17.0
1.0-6.0
16.7
1.0-5.0
20.0
2.0-2.0
100.0
1.0
3.0
4.0
1.0
0.0
0.0
1.0
1.0
5.0
Month
Split
GP
MIN
FG
FG%
3PT
3P%
FT
FT%
OR
DR
REB
AST
BLK
STL
PF
TO
PTS
October
6
18.2
0.8-4.0
20.8
0.7-3.2
21.1
0.5-0.5
100.0
0.2
4.0
4.2
1.5
0.0
0.3
0.8
0.5
2.8
November
1
20.0
1.0-6.0
16.7
1.0-5.0
20.0
0.0-0.0
0.0
1.0
2.0
3.0
2.0
0.0
1.0
0.0
1.0
3.0
Pre All-Star
7
18.4
0.9-4.3
20.0
0.7-3.4
20.8
0.4-0.4
100.0
0.3
3.7
4.0
1.6
0.0
0.4
0.7
0.6
2.9
Result
Split
GP
MIN
FG
FG%
3PT
3P%
FT
FT%
OR
DR
REB
AST
BLK
STL
PF
TO
PTS
Wins
5
16.6
1.0-4.4
22.7
1.0-3.8
26.3
0.4-0.4
100.0
0.4
3.4
3.8
1.8
0.0
0.4
0.6
0.6
3.4
Losses
2
23.5
0.5-4.0
12.5
0.0-2.5
0.0
0.5-0.5
100.0
0.0
4.5
4.5
1.0
0.0
0.5
1.0
0.5
1.5
Position
Split
GP
MIN
FG
FG%
3PT
3P%
FT
FT%
OR
DR
REB
AST
BLK
STL
PF
TO
PTS
As Starter
1
20.0
1.0-6.0
16.7
1.0-5.0
20.0
0.0-0.0
0.0
1.0
2.0
3.0
2.0
0.0
1.0
0.0
1.0
3.0
Day
Split
GP
MIN
FG
FG%
3PT
3P%
FT
FT%
OR
DR
REB
AST
BLK
STL
PF
TO
PTS
Monday
2
23.0
1.5-5.5
27.3
1.5-4.5
33.3
0.0-0.0
0.0
0.5
4.0
4.5
2.5
0.0
1.0
0.0
1.0
4.5
Tuesday
1
17.0
1.0-6.0
16.7
1.0-5.0
20.0
2.0-2.0
100.0
1.0
3.0
4.0
1.0
0.0
0.0
1.0
1.0
5.0
Wednesday
1
20.0
0.0-2.0
0.0
0.0-2.0
0.0
0.0-0.0
0.0
0.0
5.0
5.0
1.0
0.0
0.0
1.0
0.0
0.0
Thursday
1
15.0
1.0-4.0
25.0
1.0-4.0
25.0
0.0-0.0
0.0
0.0
6.0
6.0
3.0
0.0
0.0
2.0
0.0
3.0
Saturday
1
26.0
1.0-6.0
16.7
0.0-3.0
0.0
1.0-1.0
100.0
0.0
4.0
4.0
1.0
0.0
1.0
1.0
1.0
3.0
Sunday
1
5.0
0.0-1.0
0.0
0.0-1.0
0.0
0.0-0.0
0.0
0.0
0.0
0.0
0.0
0.0
0.0
0.0
0.0
0.0
Opponent
Split
GP
MIN
FG
FG%
3PT
3P%
FT
FT%
OR
DR
REB
AST
BLK
STL
PF
TO
PTS
Cleveland Cavaliers
1
20.0
1.0-6.0
16.7
1.0-5.0
20.0
0.0-0.0
0.0
1.0
2.0
3.0
2.0
0.0
1.0
0.0
1.0
3.0
Dallas Mavericks
1
20.0
0.0-2.0
0.0
0.0-2.0
0.0
0.0-0.0
0.0
0.0
5.0
5.0
1.0
0.0
0.0
1.0
0.0
0.0
Denver Nuggets
1
15.0
1.0-4.0
25.0
1.0-4.0
25.0
0.0-0.0
0.0
0.0
6.0
6.0
3.0
0.0
0.0
2.0
0.0
3.0
Houston Rockets
1
26.0
1.0-6.0
16.7
0.0-3.0
0.0
1.0-1.0
100.0
0.0
4.0
4.0
1.0
0.0
1.0
1.0
1.0
3.0
Los Angeles Clippers
1
5.0
0.0-1.0
0.0
0.0-1.0
0.0
0.0-0.0
0.0
0.0
0.0
0.0
0.0
0.0
0.0
0.0
0.0
0.0
Phoenix Suns
1
26.0
2.0-5.0
40.0
2.0-4.0
50.0
0.0-0.0
0.0
0.0
6.0
6.0
3.0
0.0
1.0
0.0
1.0
6.0
San Antonio Spurs
1
17.0
1.0-6.0
16.7
1.0-5.0
20.0
2.0-2.0
100.0
1.0
3.0
4.0
1.0
0.0
0.0
1.0
1.0
5.0
07 / SEASON-BY-SEASON HISTORY
Career statistics
Regular Season Averages
Season
Team
GP
GS
MIN
FG
FG%
3PT
3P%
FT
FT%
OR
DR
REB
AST
BLK
STL
PF
TO
PTS
2022-23
Oklahoma City Thunder
49
36
18.7
2.1-4.8
43.6
0.9-2.3
40.7
0.8-1.1
70.4
0.9
4.0
4.9
1.6
0.2
0.6
2.3
0.8
5.9
2023-24
Oklahoma City Thunder
69
1
13.0
1.4-3.3
41.7
0.8-2.1
36.8
0.5-0.6
80.5
0.5
2.9
3.4
1.6
0.4
0.4
1.4
0.5
4.0
2024-25
Oklahoma City Thunder
47
9
16.7
2.1-4.7
43.9
1.3-3.3
39.9
0.5-0.6
76.7
1.0
4.6
5.6
2.6
0.6
0.5
1.7
0.7
5.9
2025-26
Oklahoma City Thunder
65
11
19.6
2.3-5.4
42.3
1.5-3.9
38.3
1.1-1.4
79.3
0.5
5.0
5.5
2.4
0.6
0.5
2.0
1.0
7.2
2026-27
Oklahoma City Thunder
7
1
18.4
0.9-4.3
20.0
0.7-3.4
20.8
0.4-0.4
100.0
0.3
3.7
4.0
1.6
0.0
0.4
0.7
0.6
2.9
Career
—
237
58
16.9
1.9-4.5
42.2
1.1-2.9
38.1
0.7-0.9
77.3
0.7
4.1
4.7
2.0
0.5
0.5
1.8
0.7
5.6
Regular Season Totals
Season
Team
FG
FG%
3PT
3P%
FT
FT%
OR
DR
REB
AST
BLK
STL
PF
TO
PTS
2022-23
Oklahoma City Thunder
102-234
43.6
46-113
40.7
38-54
70.4
44
197
241
76
12
28
111
37
288
2023-24
Oklahoma City Thunder
95-228
41.7
53-144
36.8
33-41
80.5
36
198
234
110
27
28
98
34
276
2024-25
Oklahoma City Thunder
97-221
43.9
61-153
39.9
23-30
76.7
48
214
262
120
29
22
79
35
278
2025-26
Oklahoma City Thunder
149-352
42.3
98-256
38.3
73-92
79.3
32
326
358
158
42
31
127
67
469
2026-27
Oklahoma City Thunder
6-30
20.0
5-24
20.8
3-3
100.0
2
26
28
11
0
3
5
4
20
Career
—
449-1065
42.2
263-690
38.1
170-220
77.3
162
961
1123
475
110
112
420
177
1331
Regular Season Misc Totals
Season
Team
DD2
TD3
DQ
EJECT
TECH
FLAG
AST/TO
STL/TO
SC-EFF
SH-EFF
2022-23
Oklahoma City Thunder
0
0
0
0
0
0
2.1
0.8
1.231
0.53
2023-24
Oklahoma City Thunder
0
0
0
0
0
0
3.2
0.8
1.211
0.53
2024-25
Oklahoma City Thunder
4
3
0
0
0
0
3.4
0.6
1.258
0.58
2025-26
Oklahoma City Thunder
6
0
0
1
4
1
2.4
0.5
1.332
0.56
2026-27
Oklahoma City Thunder
0
0
0
0
1
0
2.8
0.8
0.667
0.28
Career
—
10
3
0
1
5
1
2.7
0.6
1.250
0.55
Scoring, rebounding and assist trend
08 / SHOT CHART AND ZONE SHOOTING
Shot profile
Shot-location data is not connected. Add a BALLDONTLIE GOAT-tier NBA API key in NBA Players → Settings to enable shot charts and zone shooting.
LATEST UPDATEWilliams (back) has been ruled out for Sunday's game against the Kings.
Williams will miss a sixth straight contest due to lower-back spasms and is still without a timetable to return. Isaiah Hartenstein, Kenrich Williams and rookie Aday Mara will continue holding down the frontcourt for as long as Williams is sidelined.




 Aday MaraC #15
 Ajay MitchellG #25
 Alex CarusoG #9
 Andrew HolifieldF #17
 Anthony PritchardG #5
 Bennett StirtzG #14
 Brooks BarnhizerF #23
 Buddy BoeheimF #14
 Cason WallaceG #22
 Chet HolmgrenC #7
 Christoph TillyC #33
 Dalen TerryG
 Isaiah HartensteinC #55
 Jalen WilliamsG #8
 Jared McCainG #3
 Josh DixG #21
 Kenrich WilliamsG #34
 Micah PeavyG
 Nikola TopicG #44
 Nique CliffordG
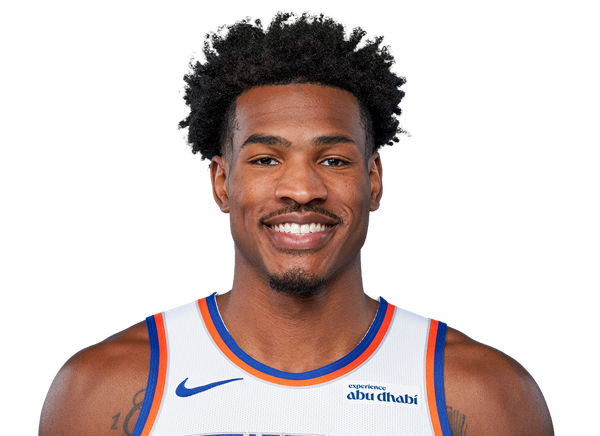 Ochai AgbajiG #30
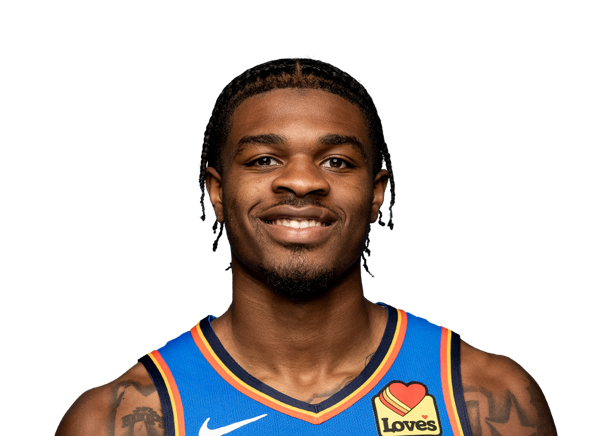 Otega OwehG #13
 Payton SandfortF #14
 Robert McCray VG #16
 Shai Gilgeous-AlexanderG #2
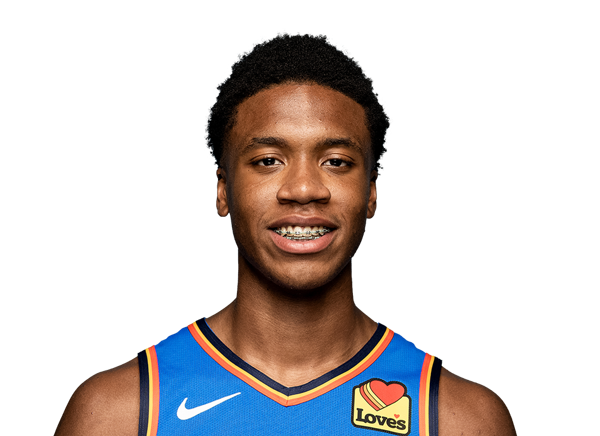 Thomas SorberC #12
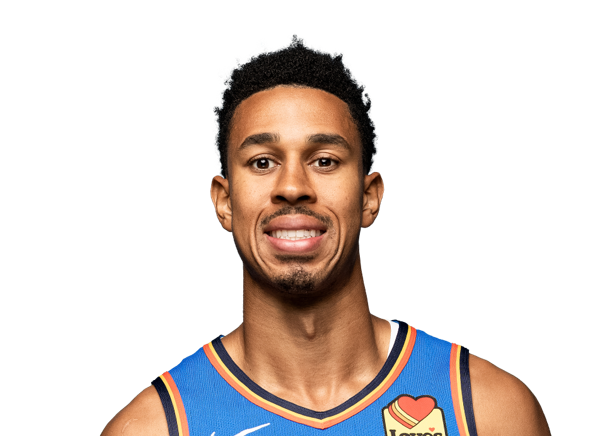 Zhaire SmithG #40