


BALLERSCULTURE TEAM PAGE · 2025-26
Toronto Raptors
2026-27: 46-36 (#6 Eastern) · 4th in Atlantic Division · Scotiabank Arena
01 / SEASON BY SEASON
Record since 2022-23
| Season | W | L | PCT | Seed | Home | Away | Div | Conf | PPG | OPP | DIFF | Streak |
|---|---|---|---|---|---|---|---|---|---|---|---|---|
| 2022-23 | 48 | 34 | .585 | #5 Eastern | 24-17 | 24-17 | 10-6 | 30-22 | 109.4 | 107.1 | +2.3 | L1 |
| 2023-24 | 41 | 41 | .500 | #9 Eastern | 27-14 | 14-27 | 4-12 | 26-26 | 112.9 | 111.4 | +1.5 | W1 |
| 2024-25 | 25 | 57 | .305 | #12 Eastern | 14-27 | 11-30 | 1-15 | 18-34 | 112.4 | 118.8 | -6.4 | L4 |
| 2025-26 | 30 | 52 | .366 | #11 Eastern | 18-23 | 12-29 | 8-8 | 21-31 | 110.9 | 115.2 | -4.3 | L2 |
| 2026-27 | 46 | 36 | .561 | #6 Eastern | 24-17 | 22-19 | 5-12 | 33-19 | 114.6 | 111.8 | +2.8 | W1 |
Combined record since 2022-23: 190-220 (46.3%). Click a season to load that year’s stats, roster and results below. 2026-27 is still in progress.
02 / EVERY CATEGORY THE PROVIDER REPORTS
Team statistics 2025-26
Defensive
| Metric | Total | Per game | NBA rank |
|---|---|---|---|
| Blocks | 395 | 4.817 | 3rd |
| Defensive Rebounds | 2557 | 31.183 | 4th |
| Steals | 722 | 8.805 | 2nd |
| Points Conceded Off Turnovers | 0 | 16 | — |
| Defensive Rebound Rate | 0.0 | — | — |
| Defensive Rebounds Per Game | 31.2 | — | — |
| Blocks Per Game | 4.8 | — | — |
| Steals Per Game | 8.8 | — | — |
| Defensive Rebounds Per 48 | 0.0 | — | — |
| Blocks Per 48 | 0.0 | — | — |
| Steals Per 48 | 0.0 | — | — |
General
| Metric | Total | Per game | NBA rank |
|---|---|---|---|
| Disqualifications | 2 | — | 3rd |
| Flagrant Fouls | 4 | 0.049 | 5th |
| Fouls | 1710 | 20.854 | 2nd |
| Rebound Rate | 49.5 | — | 3rd |
| Ejections | 0 | — | — |
| Technical Fouls | 60 | 0.366 | 3rd |
| Rebounds | 3452 | 42.098 | — |
| Minutes | 0 | — | — |
| Minutes Per Game | 0.0 | — | — |
| Fantasy Rating | 0.0 | — | — |
| Rating | 216.4 | — | — |
| Plus-Minus | -1 | -1 | Tied-1st |
| Game Day of Year | 0 | — | — |
| Rebounds Per Game | 42.1 | — | — |
| Fouls Per Game | 20.9 | — | — |
| Flagrant Fouls Per Game | 0.0 | — | — |
| Technical Fouls Per Game | 0.7 | — | — |
| Ejections Per Game | 0.0 | — | — |
| Disqualifications Per Game | 0.0 | — | — |
| Assist To Turnover Ratio | 2.3 | 2.291 | — |
| Steal To Foul Ratio | 0.4 | 0.422 | — |
| Block To Foul Ratio | 0.2 | 0.231 | — |
| Team Rebounds Per Game | 0.0 | — | — |
| Rebounds | 3452 | 42.098 | — |
| Total Technical Fouls | 60 | 0.366 | — |
| Assist To Turnover Ratio | 36.6 | — | — |
| Team Rebounds | 0 | — | — |
| Steal To Turnover Ratio | 0.7 | 0.684 | — |
| Rebounds Per 48 Minutes | 0.0 | — | — |
| Fouls Per 48 Minutes | 0.0 | — | — |
| Flagrant Fouls Per 48 Minutes | 0.0 | — | — |
| Technical Fouls Per 48 Minutes | 0.0 | — | — |
| Ejections Per 48 Minutes | 0.0 | — | — |
| Disqualifications Per 48 Minutes | 0.0 | — | — |
| Games Played | 82 | — | Tied-1st |
| Games Started | 0 | — | — |
| Double Double | 0 | — | — |
| Triple Double | 0 | — | — |
Offensive
| Metric | Total | Per game | NBA rank |
|---|---|---|---|
| Assists | 2417 | 29.476 | 1st |
| Effective Field Goal Percentage | 54.6 | — | 3rd |
| Field Goals | 3495/7250 | 0.482 | — |
| Field Goals Attempted | 7250 | 88.415 | 4th |
| Field Goals Made | 3495 | 42.622 | 2nd |
| Field Goal Percentage | 48.2 | 0.482 | 1st |
| Free Throws | 1478/1922 | 0.769 | — |
| Free Throw Percentage | 76.9 | 0.769 | 5th |
| Free Throws Attempted | 1922 | 23.439 | 2nd |
| Free Throws Made | 1478 | 18.024 | 2nd |
| Offensive Rebounds | 895 | 10.915 | 4th |
| Points | 9400 | 114.634 | 4th |
| Turnovers | 1055 | 12.866 | 3rd |
| 3-Point Field Goal Percentage | 35.4 | 0.354 | 3rd |
| 3-Point Field Goals Attempted | 2633 | 32.11 | 5th |
| 3-Point Field Goals Made | 932 | 11.366 | 5th |
| True Shooting Percentage | 58.1 | — | 3rd |
| Team Turnovers | 66 | — | Tied-2nd |
| Total Turnovers | 1121 | 12.866 | — |
| Assist Ratio | 20.8 | — | 1st |
| Points in the Paint | 4362 | 53 | 1st |
| Offensive Rebound Rate | 25.5 | — | 4th |
| Turnover Ratio | 12.2 | — | 2nd |
| Fast Break Points | 1545 | — | — |
| Possessions | 8322 | — | 2nd |
| Pace Factor | 101.0 | — | 2nd |
| Average Field Goals Made | 42.6 | — | — |
| Average Field Goals Attempted | 88.4 | — | — |
| Average 3-Point Field Goals Made | 11.4 | — | — |
| Average 3-Point Field Goals Attempted | 32.1 | — | — |
| Average Free Throws Made | 18.0 | — | — |
| Average Free Throws Attempted | 23.4 | — | — |
| Points Per Game | 114.6 | — | — |
| Offensive Rebounds Per Game | 10.9 | — | — |
| Assists Per Game | 29.5 | — | — |
| Turnovers Per Game | 12.9 | — | — |
| Offensive Rebound Percentage | 0.2 | 0.238 | — |
| Estimated Possessions | 8244.8 | 99.742 | — |
| Estimated Possessions Per Game | 100.5 | — | — |
| Points Per Estimated Possession | 1.1 | 1.149 | — |
| Team Turnovers Per Game | 0.8 | — | — |
| Total Turnovers Per Game | 13.7 | — | — |
| 3-Point Field Goal Percentage | 35.4 | 0.354 | 1st |
| 2-Point Field Goals Made | 2563.0 | 31.256 | Tied-3rd |
| 2-Point Field Goals Attempted | 4617.0 | 56.305 | Tied-1st |
| 2-Point Field Goals Made per Game | 31.3 | — | — |
| 2-Point Field Goals Attempted per Game | 56.3 | — | — |
| 2-Point Field Goal Percentage | 55.5 | 0.555 | — |
| Shooting Efficiency | 0.55 | 0.546 | — |
| Scoring Efficiency | 1.297 | 1.297 | — |
| Fieldgoals Made Per 48 | 0.0 | — | — |
| Fieldgoals Attempted Per 48 | 0.0 | — | — |
| 3-Point Fieldgoals Made Per 48 | 0.0 | — | — |
| 3-Point Fieldgoals Attempted Per 48 | 0.0 | — | — |
| Freethrows Made Per 48 | 0.0 | — | — |
| Freethrows Attempted Per 48 | 0.0 | — | — |
| Points Scored Per 48 | 0.0 | — | — |
| Offensive Rebounds Per 48 | 0.0 | — | — |
| Assists Per 48 | 0.0 | — | — |
| Turnovers | 0.0 | — | — |
03 / PLAYERS, POSITIONS AND NUMBERS
Roster 2025-26
The roster could not be loaded right now.
04 / GAME-BY-GAME
Results 2025-26
| Date | Opponent | Result | Score |
|---|---|---|---|
| Apr 13, 2026 | vs Brooklyn Nets | W | 136-101 |
| Apr 11, 2026 | at New York Knicks | L | 95-112 |
| Apr 10, 2026 | vs Miami Heat | W | 128-114 |
| Apr 8, 2026 | vs Miami Heat | W | 121-95 |
| Apr 6, 2026 | at Boston Celtics | L | 101-115 |
| Apr 4, 2026 | at Memphis Grizzlies | W | 128-96 |
| Apr 2, 2026 | vs Sacramento Kings | L | 115-123 |
| Apr 1, 2026 | at Detroit Pistons | L | 116-127 |
| Mar 30, 2026 | vs Orlando Magic | W | 139-87 |
| Mar 28, 2026 | vs New Orleans Pelicans | W | 119-106 |
| Mar 26, 2026 | at LA Clippers | L | 94-119 |
| Mar 24, 2026 | at Utah Jazz | W | 143-127 |
| Mar 23, 2026 | at Phoenix Suns | L | 98-120 |
| Mar 21, 2026 | at Denver Nuggets | L | 115-121 |
| Mar 19, 2026 | at Chicago Bulls | W | 139-109 |
| Mar 16, 2026 | vs Detroit Pistons | W | 119-108 |
| Mar 14, 2026 | vs Phoenix Suns | W | 122-115 |
| Mar 12, 2026 | at New Orleans Pelicans | L | 111-122 |
| Mar 11, 2026 | at Houston Rockets | L | 99-113 |
| Mar 9, 2026 | vs Dallas Mavericks | W | 122-92 |
| Mar 6, 2026 | at Minnesota Timberwolves | L | 107-115 |
| Mar 4, 2026 | vs New York Knicks | L | 95-111 |
| Mar 1, 2026 | at Washington Wizards | W | 134-125 |
| Feb 26, 2026 | vs San Antonio Spurs | L | 107-110 |
| Feb 25, 2026 | vs Oklahoma City Thunder | L | 107-116 |
| Feb 23, 2026 | at Milwaukee Bucks | W | 122-94 |
| Feb 20, 2026 | at Chicago Bulls | W | 110-101 |
| Feb 12, 2026 | vs Detroit Pistons | L | 95-113 |
| Feb 9, 2026 | vs Indiana Pacers | W | 122-104 |
| Feb 6, 2026 | vs Chicago Bulls | W | 123-107 |
| Feb 5, 2026 | vs Minnesota Timberwolves | L | 126-128 |
| Feb 2, 2026 | vs Utah Jazz | W | 107-100 |
| Jan 31, 2026 | at Orlando Magic | L | 120-130 |
| Jan 29, 2026 | vs New York Knicks | L | 92-119 |
| Jan 26, 2026 | at Oklahoma City Thunder | W | 103-101 |
| Jan 24, 2026 | at Portland Trail Blazers | W | 110-98 |
| Jan 22, 2026 | at Sacramento Kings | W | 122-109 |
| Jan 21, 2026 | at Golden State Warriors | W | 145-127 |
| Jan 19, 2026 | at Los Angeles Lakers | L | 93-110 |
| Jan 17, 2026 | vs LA Clippers | L | 117-121 |
Most recent 40 completed games, 2025-26.
05 / PAYROLL AND SALARIES
Contracts
2026-27 payroll on file: $191.13M across 10 players.
| Player | 2026-27 | Total | Type / notes |
|---|---|---|---|
 Kawhi Leonard | $50.3M | $420.28M | |
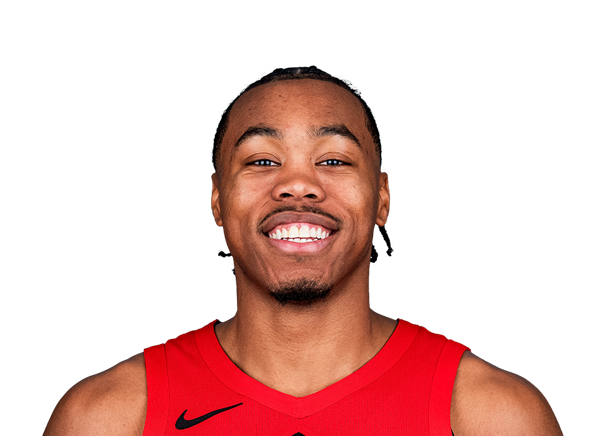 Scottie Barnes | $41.75M | $113.48M | |
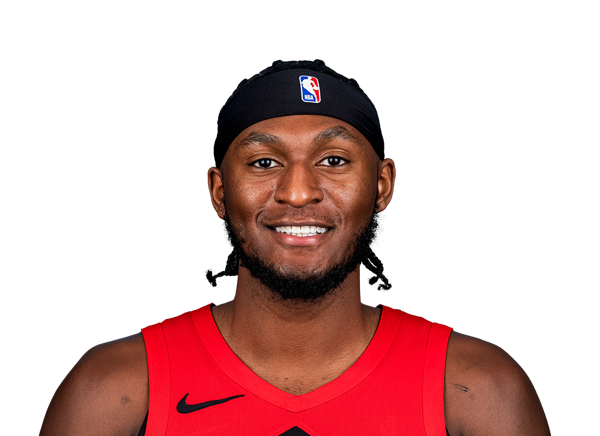 Immanuel Quickley | $32.5M | $108.3M | |
 RJ Barrett | $29.62M | $142.6M | |
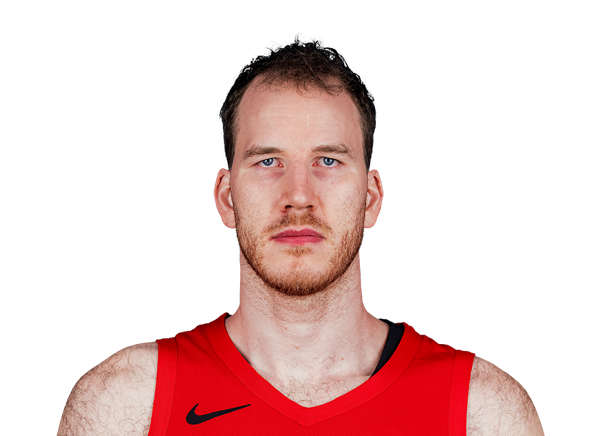 Jakob Poeltl | $19.5M | $116.6M | |
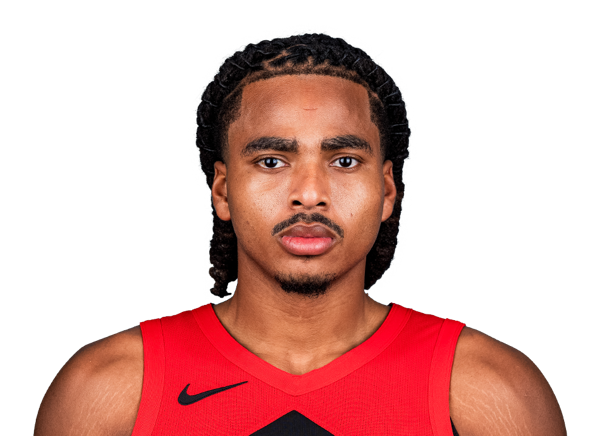 Collin Murray-Boyles | $6.65M | $12.98M | |
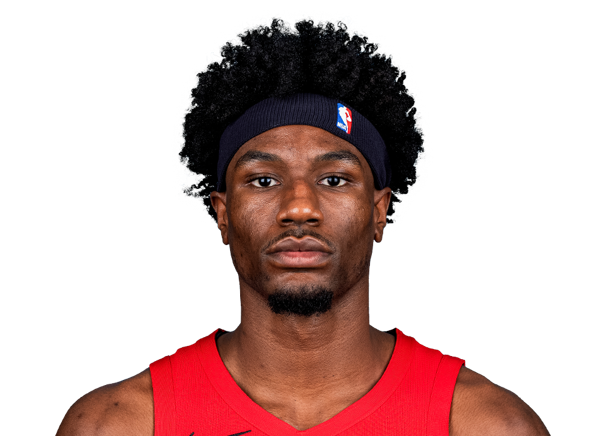 Ja’Kobe Walter | $3.81M | $11.01M | |
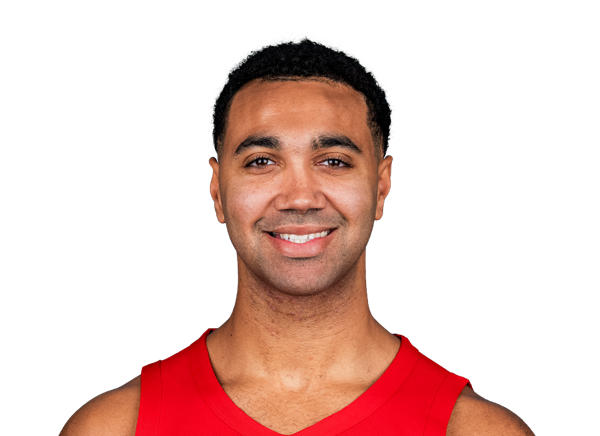 Trayce Jackson-Davis | $2.41M | $7.64M | |
 Jamison Battle | $2.3M | $5.25M | |
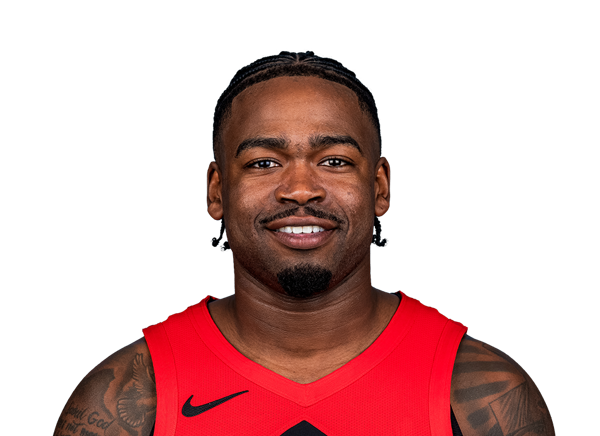 Jamal Shead | $2.3M | $6.11M |
06 / CURRENT INJURY REPORT
Injuries
Kawhi Leonard Out
Toronto Raptors · Knee / Leg / Inflammation · est. return Nov 27
Toronto Raptors · Knee / Leg / Inflammation · est. return Nov 27
Leonard (knee) has progressed in his strength and conditioning program but will miss at least one more week, Michael Scotto of HoopsHype.com reports.
Nate Bittle Out
Toronto Raptors · Foot / Leg / Fracture · est. return Nov 23
Toronto Raptors · Foot / Leg / Fracture · est. return Nov 23
Bittle (foot) has been ruled out for Sunday's game against the Knicks, Zulfi Sheikh of Sportsnet.ca reports.
Kevin McCullar Jr. Day-To-Day
Toronto Raptors · Illness / Other · est. return Nov 20
Toronto Raptors · Illness / Other · est. return Nov 20
McCullar signed a two-way contract with the Raptors on Thursday, Michael Scotto of HoopsHype.com reports.
07 / SIGNINGS, TRADES AND ROSTER MOVES
Adjustments & transactions
- Signed G Kevin McCullar Jr. to a two-way contract.
- Converted the contract of C Nate Bittle to a two-way contract. Waived Gs Nimari Burnett, Jalen Celestine, Tyreke Key, F Tyson Degenhart and C Jamarion Sharp.
- Waived C Trey Jemison III.
- Waived G Chucky Hepburn.
- Waived G Andre Jackson Jr.
- Re-signed G Jamal Shead to a veteran extension.
- Waived G AJ Hoggard.
- Signed G Jaden Bradley. Converted G Malachi Smith to a two-way contract.