Click a season to open this player’s full game log, splits and advanced stats for that year; click a team to open its page. A dash means no NBA games were recorded.
03 / EVERY CATEGORY THE PROVIDER REPORTS
Full statistical breakdown
Regular season 2026-27
Defensive
Metric
Total
NBA rank
Blocks
4
Tied-160th
Defensive Rebounds
6
Tied-360th
Steals
1
Tied-364th
Defensive Rebound Rate
0.0
—
Defensive Rebounds Per Game
1.0
—
Blocks Per Game
0.7
—
Steals Per Game
0.2
—
Defensive Rebounds Per 48
9.9
2,468th
Blocks Per 48
6.6
1,097th
Steals Per 48
1.7
2,496th
General
Metric
Total
NBA rank
Disqualifications
0
Tied-22nd
Flagrant Fouls
0
Tied-24th
Fouls
6
Tied-358th
Player Efficiency Rating
15.22
—
Rebound Rate
0.0
—
Ejections
0
Tied-7th
Technical Fouls
0
Tied-104th
Rebounds
15
—
Value Over Replacement Player
2.0
—
Minutes
29
Tied-7th
Minutes Per Game
4.8
—
Rating
4.5
Tied-340th
Plus-Minus
0
Tied-1st
Rebounds Per Game
2.5
—
Fouls Per Game
1.0
—
Flagrant Fouls Per Game
0.0
—
Technical Fouls Per Game
0.0
—
Ejections Per Game
0.0
—
Disqualifications Per Game
0.0
—
Assist To Turnover Ratio
0.0
—
Steal To Foul Ratio
0.2
—
Block To Foul Ratio
0.7
—
Team Rebounds Per Game
0.0
—
Rebounds
15
—
Total Technical Fouls
0
—
Assist To Turnover Ratio
0.0
—
Steal To Turnover Ratio
0.3
—
Rebounds Per 48 Minutes
24.8
—
Fouls Per 48 Minutes
9.9
2,454th
Flagrant Fouls Per 48 Minutes
0.0
164th
Technical Fouls Per 48 Minutes
0.0
713th
Ejections Per 48 Minutes
0.0
48th
Disqualifications Per 48 Minutes
0.0
150th
R/40
20.7
—
Games Played
6
6th
Games Started
0
Tied-258th
Double Double
0
Tied-121st
Triple Double
0
Tied-13th
Offensive
Metric
Total
NBA rank
Assists
0
Tied-434th
Effective Field Goal Percentage
40.0
—
Field Goals
4/10
—
Field Goals Attempted
10
Tied-392nd
Field Goals Made
4
Tied-391st
Field Goal Percentage
40.0
—
Free Throws
0/0
—
Free Throw Percentage
0.0
—
Free Throws Attempted
0
Tied-422nd
Free Throws Made
0
Tied-416th
Offensive Rebounds
9
Tied-197th
Points
8
Tied-411th
Turnovers
3
Tied-343rd
3-Point Field Goal Percentage
0.0
—
3-Point Field Goals Attempted
0
Tied-421st
3-Point Field Goals Made
0
Tied-379th
True Shooting Percentage
40.0
—
Total Turnovers
3
—
Assist Ratio
0.0
—
Points in the Paint
0
Tied-1st
Offensive Rebound Rate
0.0
—
Turnover Ratio
23.1
—
Brick Index
0.00
—
Usage Rate
0.0
—
Average Field Goals Made
0.7
—
Average Field Goals Attempted
1.7
—
Average 3-Point Field Goals Made
0.0
—
Average 3-Point Field Goals Attempted
0.0
—
Average Free Throws Made
0.0
—
Average Free Throws Attempted
0.0
—
Points Per Game
1.3
—
Offensive Rebounds Per Game
1.5
—
Assists Per Game
0.0
—
Turnovers Per Game
0.5
—
Offensive Rebound Percentage
1.5
—
Estimated Possessions
4.0
—
Estimated Possessions Per Game
0.7
—
Points Per Estimated Possession
2.0
—
Team Turnovers Per Game
0.0
—
Total Turnovers Per Game
0.5
—
3-Point Field Goal Percentage
0.0
—
2-Point Field Goals Made
4.0
Tied-12th
2-Point Field Goals Attempted
10.0
29th
2-Point Field Goals Made per Game
0.7
—
2-Point Field Goals Attempted per Game
1.7
—
2-Point Field Goal Percentage
40.0
—
Shooting Efficiency
0.40
—
Scoring Efficiency
0.800
—
Fieldgoals Made Per 48
6.6
2,681st
Fieldgoals Attempted Per 48
16.6
2,688th
3-Point Fieldgoals Made Per 48
0.0
2,598th
3-Point Fieldgoals Attempted Per 48
0.0
2,886th
Freethrows Made Per 48
0.0
2,852nd
Freethrows Attempted Per 48
0.0
2,893rd
Points Scored Per 48
13.2
2,818th
Offensive Rebounds Per 48
14.9
1,350th
Assists Per 48
0.0
2,976th
Turnovers
5.0
2,352nd
P/40
11.0
—
A/40
0.0
—
04 / EFFICIENCY, SHOOTING PROFILE, PER-36
Advanced metrics
True shooting %38.2%
Effective FG %41.2%
2-point FG %41.2%
3-point attempt rate0.0%
Free throw rate0.0%
Points per shot attempt0.76
% of points from 3s0.0%
Assist-to-turnover0.00
Points per 36 min9.8
Rebounds per 36 min18.8
Assists per 36 min0.0
Steals per 36 min1.50
Blocks per 36 min5.25
Turnovers per 36 min3.75
Stocks (STL + BLK) per game0.90
Pts + Reb + Ast per game3.8
Efficiency (EFF) per game3.2
Game Score per game (Hollinger)1.5
Minutes per game4.8
Calculated by BallersCulture from the supplied 2026-27 box-score totals using standard formulas (hover a tile to see the formula). Tracking-based metrics such as BPM, VORP, on/off and RAPTOR are not available from this data source.
05 / 6 GAMES IN 2026-27
Game log: Regular season
Date
Opp
Result
MIN
FG
FG%
3PT
3P%
FT
FT%
REB
AST
BLK
STL
PF
TO
PTS
Nov 16
@ TOR
W 112-108 OT
3
0-0
0.0
0-0
0.0
0-0
0.0
3
0
0
0
1
0
0
Nov 11
vs MIL
W 117-85
5
0-0
0.0
0-0
0.0
0-0
0.0
1
0
0
1
0
0
0
Nov 5
vs CHI
W 135-105
10
4-5
80.0
0-0
0.0
0-0
0.0
8
0
3
0
2
1
8
Oct 28
vs DET
W 111-97
1
0-0
0.0
0-0
0.0
0-0
0.0
1
0
0
0
0
1
0
Oct 26
vs ORL
L 111-102
7
0-5
0.0
0-0
0.0
0-0
0.0
2
0
1
0
2
1
0
Oct 24
@ BOS
L 107-103
2
0-0
0.0
0-0
0.0
0-0
0.0
0
0
0
0
1
0
0
06 / 2026-27 HOME / AWAY, RESULTS, MONTHS AND OPPONENTS
Splits
split
Split
GP
MIN
FG
FG%
3PT
3P%
FT
FT%
OR
DR
REB
AST
BLK
STL
PF
TO
PTS
All Splits
6
4.8
0.7-1.7
40.0
0.0-0.0
0.0
0.0-0.0
0.0
1.5
1.0
2.5
0.0
0.7
0.2
1.0
0.5
1.3
Home
4
6.0
1.0-2.5
40.0
0.0-0.0
0.0
0.0-0.0
0.0
2.0
1.0
3.0
0.0
1.0
0.3
1.0
0.8
2.0
Road
2
2.5
0.0-0.0
0.0
0.0-0.0
0.0
0.0-0.0
0.0
0.5
1.0
1.5
0.0
0.0
0.0
1.0
0.0
0.0
vs. Division
2
2.5
0.0-0.0
0.0
0.0-0.0
0.0
0.0-0.0
0.0
0.5
1.0
1.5
0.0
0.0
0.0
1.0
0.0
0.0
vs. Conference
6
4.8
0.7-1.7
40.0
0.0-0.0
0.0
0.0-0.0
0.0
1.5
1.0
2.5
0.0
0.7
0.2
1.0
0.5
1.3
3+ Days Rest
4
5.0
1.0-1.3
80.0
0.0-0.0
0.0
0.0-0.0
0.0
1.5
1.5
3.0
0.0
0.8
0.3
1.0
0.3
2.0
Month
Split
GP
MIN
FG
FG%
3PT
3P%
FT
FT%
OR
DR
REB
AST
BLK
STL
PF
TO
PTS
October
3
3.3
0.0-1.7
0.0
0.0-0.0
0.0
0.0-0.0
0.0
1.0
0.0
1.0
0.0
0.3
0.0
1.0
0.7
0.0
November
3
6.0
1.3-1.7
80.0
0.0-0.0
0.0
0.0-0.0
0.0
2.0
2.0
4.0
0.0
1.0
0.3
1.0
0.3
2.7
Pre All-Star
6
4.8
0.7-1.7
40.0
0.0-0.0
0.0
0.0-0.0
0.0
1.5
1.0
2.5
0.0
0.7
0.2
1.0
0.5
1.3
Result
Split
GP
MIN
FG
FG%
3PT
3P%
FT
FT%
OR
DR
REB
AST
BLK
STL
PF
TO
PTS
Wins
4
5.0
1.0-1.3
80.0
0.0-0.0
0.0
0.0-0.0
0.0
1.8
1.5
3.3
0.0
0.8
0.3
0.8
0.5
2.0
Losses
2
4.5
0.0-2.5
0.0
0.0-0.0
0.0
0.0-0.0
0.0
1.0
0.0
1.0
0.0
0.5
0.0
1.5
0.5
0.0
Day
Split
GP
MIN
FG
FG%
3PT
3P%
FT
FT%
OR
DR
REB
AST
BLK
STL
PF
TO
PTS
Tuesday
2
3.0
0.0-0.0
0.0
0.0-0.0
0.0
0.0-0.0
0.0
1.0
0.0
1.0
0.0
0.0
0.5
0.0
0.5
0.0
Wednesday
1
10.0
4.0-5.0
80.0
0.0-0.0
0.0
0.0-0.0
0.0
4.0
4.0
8.0
0.0
3.0
0.0
2.0
1.0
8.0
Friday
1
2.0
0.0-0.0
0.0
0.0-0.0
0.0
0.0-0.0
0.0
0.0
0.0
0.0
0.0
0.0
0.0
1.0
0.0
0.0
Sunday
2
5.0
0.0-2.5
0.0
0.0-0.0
0.0
0.0-0.0
0.0
1.5
1.0
2.5
0.0
0.5
0.0
1.5
0.5
0.0
Opponent
Split
GP
MIN
FG
FG%
3PT
3P%
FT
FT%
OR
DR
REB
AST
BLK
STL
PF
TO
PTS
Boston Celtics
1
2.0
0.0-0.0
0.0
0.0-0.0
0.0
0.0-0.0
0.0
0.0
0.0
0.0
0.0
0.0
0.0
1.0
0.0
0.0
Chicago Bulls
1
10.0
4.0-5.0
80.0
0.0-0.0
0.0
0.0-0.0
0.0
4.0
4.0
8.0
0.0
3.0
0.0
2.0
1.0
8.0
Detroit Pistons
1
1.0
0.0-0.0
0.0
0.0-0.0
0.0
0.0-0.0
0.0
1.0
0.0
1.0
0.0
0.0
0.0
0.0
1.0
0.0
Milwaukee Bucks
1
5.0
0.0-0.0
0.0
0.0-0.0
0.0
0.0-0.0
0.0
1.0
0.0
1.0
0.0
0.0
1.0
0.0
0.0
0.0
Orlando Magic
1
7.0
0.0-5.0
0.0
0.0-0.0
0.0
0.0-0.0
0.0
2.0
0.0
2.0
0.0
1.0
0.0
2.0
1.0
0.0
Toronto Raptors
1
3.0
0.0-0.0
0.0
0.0-0.0
0.0
0.0-0.0
0.0
1.0
2.0
3.0
0.0
0.0
0.0
1.0
0.0
0.0
07 / SEASON-BY-SEASON HISTORY
Career statistics
Regular Season Averages
Season
Team
GP
GS
MIN
FG
FG%
3PT
3P%
FT
FT%
OR
DR
REB
AST
BLK
STL
PF
TO
PTS
2020-21
Golden State Warriors
39
27
21.4
4.9-9.4
51.9
0.3-1.0
31.6
1.4-2.2
62.8
1.4
4.4
5.8
0.7
0.9
0.3
3.1
1.5
11.5
2022-23
Golden State Warriors
21
0
12.5
2.8-4.5
62.8
0.0-0.1
50.0
1.2-1.8
68.4
0.9
2.6
3.5
0.7
0.3
0.1
1.9
0.7
6.9
2022-23
Detroit Pistons
24
22
25.2
5.4-10.2
53.1
0.1-0.8
16.7
1.8-2.5
71.2
2.3
5.8
8.1
0.7
0.8
0.2
2.9
1.5
12.7
2022-23
2022 23 Totals
45
22
19.3
4.2-7.5
55.8
0.1-0.4
20.0
1.5-2.2
70.1
1.6
4.3
5.9
0.7
0.6
0.2
2.4
1.1
10.0
2023-24
Detroit Pistons
63
6
17.3
3.0-4.8
61.3
0.0-0.0
0.0
1.1-1.6
70.6
1.7
3.6
5.3
0.9
0.6
0.2
2.2
1.0
7.1
2024-25
Indiana Pacers
1
0
5.0
2.0-4.0
50.0
0.0-1.0
0.0
2.0-2.0
100.0
0.0
1.0
1.0
0.0
0.0
0.0
0.0
0.0
6.0
2025-26
Indiana Pacers
4
1
14.5
1.5-2.5
60.0
0.0-0.0
0.0
0.3-0.5
50.0
1.3
0.8
2.0
0.8
0.3
0.0
2.5
1.3
3.3
2026-27
New York Knicks
6
0
4.8
0.7-1.7
40.0
0.0-0.0
0.0
0.0-0.0
0.0
1.5
1.0
2.5
0.0
0.7
0.2
1.0
0.5
1.3
Career
—
158
56
18.3
3.7-6.6
55.9
0.1-0.4
26.2
1.2-1.8
68.2
1.6
3.8
5.4
0.7
0.7
0.2
2.4
1.2
8.7
Regular Season Totals
Season
Team
FG
FG%
3PT
3P%
FT
FT%
OR
DR
REB
AST
BLK
STL
PF
TO
PTS
2020-21
Golden State Warriors
191-368
51.9
12-38
31.6
54-86
62.8
55
171
226
26
36
11
121
60
448
2022-23
Golden State Warriors
59-94
62.8
1-2
50.0
26-38
68.4
18
55
73
14
7
3
39
14
145
2022-23
Detroit Pistons
130-245
53.1
3-18
16.7
42-59
71.2
55
139
194
16
20
4
69
37
305
2022-23
2022 23 Totals
189-339
55.8
4-20
20.0
68-97
70.1
73
194
267
30
27
7
108
51
450
2023-24
Detroit Pistons
187-305
61.3
0-2
0.0
72-102
70.6
110
226
336
54
39
12
141
66
446
2024-25
Indiana Pacers
2-4
50.0
0-1
0.0
2-2
100.0
0
1
1
0
0
0
0
0
6
2025-26
Indiana Pacers
6-10
60.0
0-0
0.0
1-2
50.0
5
3
8
3
1
0
10
5
13
2026-27
New York Knicks
4-10
40.0
0-0
0.0
0-0
0.0
9
6
15
0
4
1
6
3
8
Career
—
579-1036
55.9
16-61
26.2
197-289
68.2
252
601
853
113
107
31
386
185
1371
Regular Season Misc Totals
Season
Team
DD2
TD3
DQ
EJECT
TECH
FLAG
AST/TO
STL/TO
SC-EFF
SH-EFF
2020-21
Golden State Warriors
3
0
4
0
2
0
0.4
0.2
1.217
0.54
2022-23
Golden State Warriors
0
0
0
0
1
0
1.0
0.2
1.543
0.63
2022-23
Detroit Pistons
8
0
4
0
2
1
0.4
0.1
1.245
0.54
2022-23
2022 23 Totals
8
0
4
0
3
1
0.6
0.1
1.327
0.56
2023-24
Detroit Pistons
7
0
0
0
0
0
0.8
0.2
1.462
0.61
2024-25
Indiana Pacers
0
0
0
0
0
0
0.0
0.0
1.500
0.50
2025-26
Indiana Pacers
0
0
0
0
0
0
0.6
0.0
1.300
0.60
2026-27
New York Knicks
0
0
0
0
0
0
0.0
0.3
0.800
0.40
Career
—
18
0
8
0
5
1
0.6
0.2
1.323
0.57
Scoring, rebounding and assist trend
08 / SHOT CHART AND ZONE SHOOTING
Shot profile
Shot-location data is not connected. Add a BALLDONTLIE GOAT-tier NBA API key in NBA Players → Settings to enable shot charts and zone shooting.
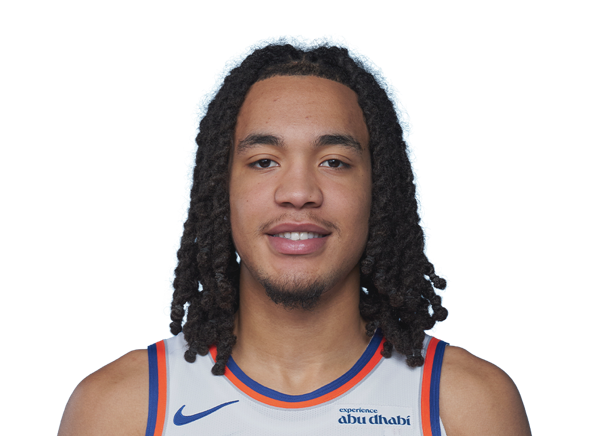
LATEST UPDATEWiseman isn't listed in the starting lineup for Thursday's preseason meeting with the Raptors.
With Karl-Anthony Towns (rest) back in the lineup, Wiseman will slide to the second unit. The big man turned in an 18-point, 10-rebound double-double in Tuesday's loss to the Raptors.




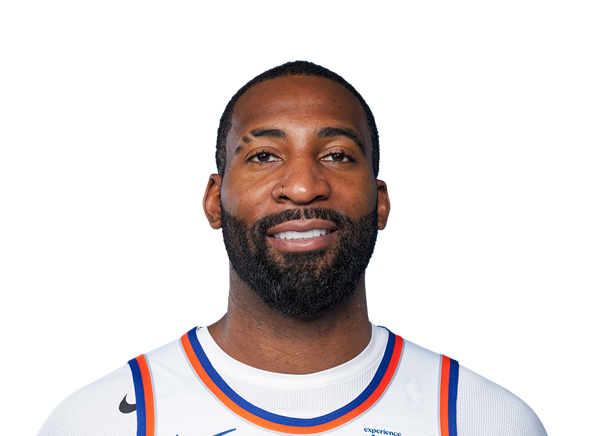 Andre DrummondC
 Bruce BrownG #1
 Dalton KnechtF #1
 Drew EubanksF #19
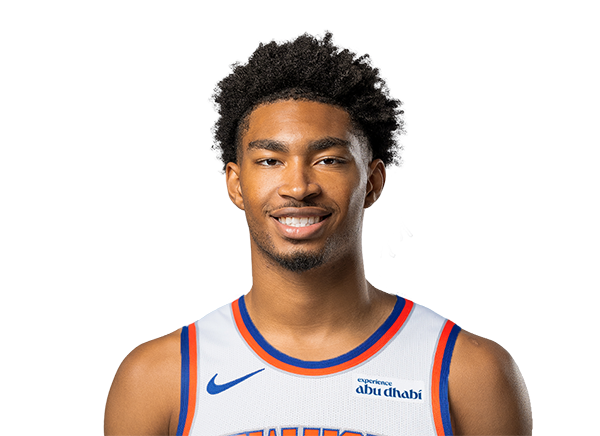 Jaden AkinsG #14
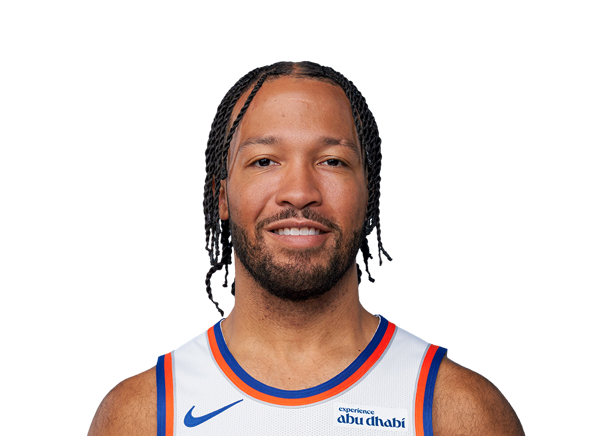 Jalen BrunsonG #11
 John KoncharG #55
 Jordan ClarksonG #00
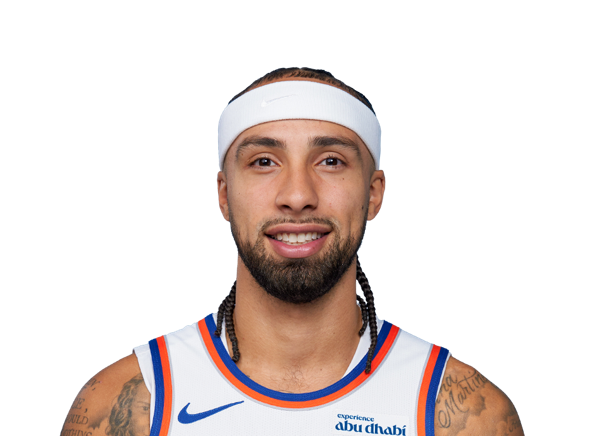 Jose AlvaradoG #5
 Josh HartG #3
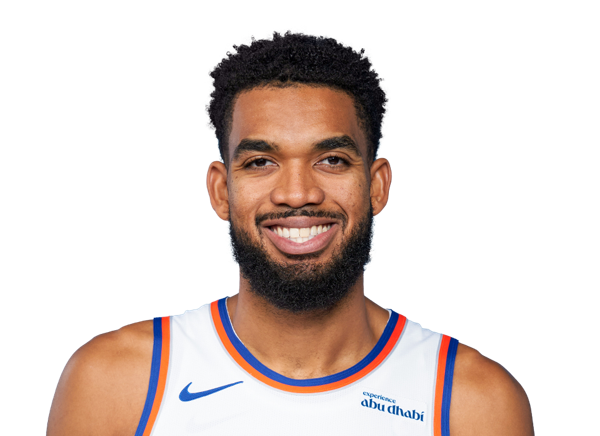 Karl-Anthony TownsC #32
 Landry ShametG #44
 Mikal BridgesG #25
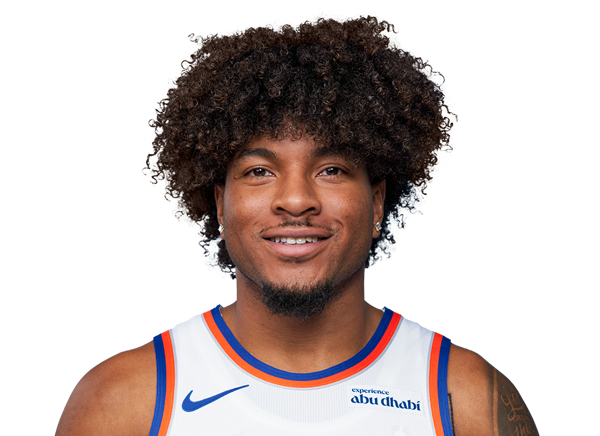 Miles McBrideG #2
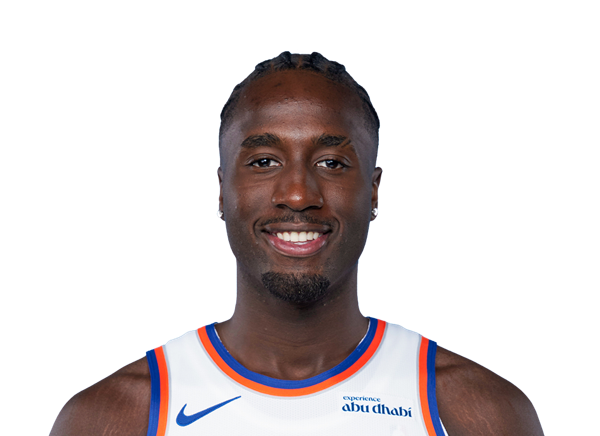 Mohamed DiawaraF #51
 N’Faly DanteC #12
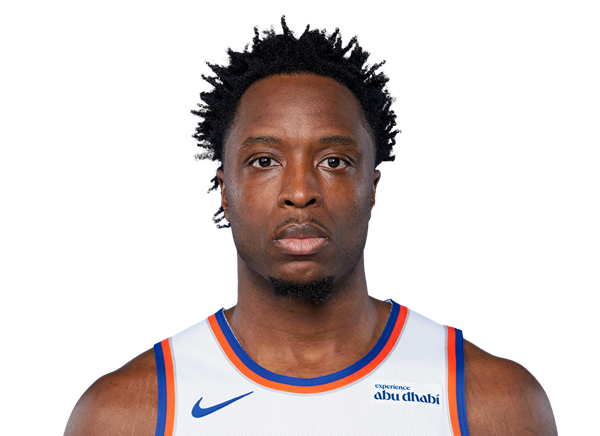 OG AnunobyF #8
 Pacome DadietF #4
 Tyler KolekG #13
 Tyler NickelF #55