Click a season to open this player’s full game log, splits and advanced stats for that year; click a team to open its page. A dash means no NBA games were recorded.
03 / EVERY CATEGORY THE PROVIDER REPORTS
Full statistical breakdown
Regular season 2026-27
Defensive
Metric
Total
NBA rank
Blocks
4
Tied-157th
Defensive Rebounds
13
Tied-302nd
Steals
10
Tied-129th
Defensive Rebound Rate
0.0
—
Defensive Rebounds Per Game
1.0
Tied-266th
Blocks Per Game
0.3
Tied-157th
Steals Per Game
0.8
139th
Defensive Rebounds Per 48
2.6
Tied-4,832nd
Blocks Per 48
0.8
Tied-2,512th
Steals Per 48
2.0
Tied-2,064th
General
Metric
Total
NBA rank
Disqualifications
0
Tied-21st
Flagrant Fouls
0
Tied-22nd
Fouls
21
Tied-198th
Player Efficiency Rating
13.70
170th
Rebound Rate
0.0
—
Ejections
0
Tied-7th
Technical Fouls
0
Tied-101st
Rebounds
19
—
Value Over Replacement Player
0.0
—
Minutes
244
3rd
Minutes Per Game
18.8
—
Rating
12.5
Tied-72nd
Plus-Minus
+29
Tied-1st
Rebounds Per Game
1.5
266th
Fouls Per Game
1.6
Tied-215th
Flagrant Fouls Per Game
0.0
Tied-19th
Technical Fouls Per Game
0.0
Tied-82nd
Ejections Per Game
0.0
Tied-6th
Disqualifications Per Game
0.0
Tied-20th
Assist To Turnover Ratio
3.5
—
Steal To Foul Ratio
0.5
—
Block To Foul Ratio
0.2
—
Team Rebounds Per Game
0.0
—
Rebounds
19
—
Total Technical Fouls
0
—
Assist To Turnover Ratio
0.0
—
Steal To Turnover Ratio
2.5
—
Rebounds Per 48 Minutes
3.7
—
Fouls Per 48 Minutes
4.1
Tied-3,168th
Flagrant Fouls Per 48 Minutes
0.0
Tied-352nd
Technical Fouls Per 48 Minutes
0.0
Tied-1,616th
Ejections Per 48 Minutes
0.0
Tied-112th
Disqualifications Per 48 Minutes
0.0
Tied-336th
R/40
3.1
—
Games Played
13
13th
Games Started
0
Tied-257th
Double Double
0
Tied-119th
Triple Double
0
Tied-12th
Offensive
Metric
Total
NBA rank
Assists
14
Tied-238th
Effective Field Goal Percentage
60.9
—
Field Goals
34/78
—
Field Goals Attempted
78
Tied-181st
Field Goals Made
34
Tied-194th
Field Goal Percentage
43.6
—
Free Throws
4/5
—
Free Throw Percentage
80.0
Tied-120th
Free Throws Attempted
5
Tied-325th
Free Throws Made
4
Tied-309th
Offensive Rebounds
6
Tied-255th
Points
99
Tied-185th
Turnovers
4
Tied-308th
3-Point Field Goal Percentage
43.5
Tied-43rd
3-Point Field Goals Attempted
62
Tied-79th
3-Point Field Goals Made
27
Tied-55th
True Shooting Percentage
61.7
—
Total Turnovers
4
—
Assist Ratio
14.3
—
Points in the Paint
0
Tied-1st
Offensive Rebound Rate
0.0
—
Turnover Ratio
4.1
—
Brick Index
0.00
—
Usage Rate
0.0
—
Average Field Goals Made
2.6
—
Average Field Goals Attempted
6.0
Tied-247th
Average 3-Point Field Goals Made
2.1
Tied-69th
Average 3-Point Field Goals Attempted
4.8
Tied-86th
Average Free Throws Made
0.3
—
Average Free Throws Attempted
0.4
269th
Points Per Game
7.6
191st
Offensive Rebounds Per Game
0.5
Tied-236th
Assists Per Game
1.1
Tied-229th
Turnovers Per Game
0.3
271st
Offensive Rebound Percentage
0.1
—
Estimated Possessions
78.0
—
Estimated Possessions Per Game
6.0
—
Points Per Estimated Possession
1.3
—
Team Turnovers Per Game
0.0
—
Total Turnovers Per Game
0.3
—
3-Point Field Goal Percentage
43.5
—
2-Point Field Goals Made
7.0
Tied-139th
2-Point Field Goals Attempted
16.0
Tied-102nd
2-Point Field Goals Made per Game
0.5
—
2-Point Field Goals Attempted per Game
1.2
—
2-Point Field Goal Percentage
43.8
—
Shooting Efficiency
0.61
—
Scoring Efficiency
1.269
—
Fieldgoals Made Per 48
6.7
Tied-3,104th
Fieldgoals Attempted Per 48
15.3
Tied-2,896th
3-Point Fieldgoals Made Per 48
5.3
Tied-880th
3-Point Fieldgoals Attempted Per 48
12.2
Tied-1,264th
Freethrows Made Per 48
0.8
Tied-4,944th
Freethrows Attempted Per 48
1.0
Tied-5,200th
Points Scored Per 48
19.5
Tied-2,960th
Offensive Rebounds Per 48
1.2
Tied-4,080th
Assists Per 48
2.8
Tied-3,808th
Turnovers
0.8
Tied-4,928th
P/40
16.2
—
A/40
2.3
—
04 / EFFICIENCY, SHOOTING PROFILE, PER-36
Advanced metrics
True shooting %61.5%
Effective FG %60.8%
2-point FG %41.7%
3-point attempt rate80.0%
Free throw rate6.7%
Points per shot attempt1.27
% of points from 3s82.9%
Assist-to-turnover3.67
Points per 36 min14.6
Rebounds per 36 min2.9
Assists per 36 min2.1
Steals per 36 min1.53
Blocks per 36 min0.57
Turnovers per 36 min0.57
Stocks (STL + BLK) per game1.10
Pts + Reb + Ast per game10.2
Efficiency (EFF) per game7.5
Game Score per game (Hollinger)5.9
Minutes per game18.8
Calculated by BallersCulture from the supplied 2026-27 box-score totals using standard formulas (hover a tile to see the formula). Tracking-based metrics such as BPM, VORP, on/off and RAPTOR are not available from this data source.
05 / 13 GAMES IN 2026-27
Game log: Regular season
Date
Opp
Result
MIN
FG
FG%
3PT
3P%
FT
FT%
REB
AST
BLK
STL
PF
TO
PTS
Nov 16
@ TOR
W 112-108 OT
14
1-3
33.3
1-3
33.3
0-0
0.0
1
0
0
0
1
0
3
Nov 14
@ IND
L 106-104
22
3-8
37.5
3-7
42.9
0-0
0.0
1
1
1
1
1
0
9
Nov 12
vs CLE
L 115-107
27
7-13
53.8
5-10
50.0
0-0
0.0
2
2
0
1
2
0
19
Nov 11
vs MIL
W 117-85
25
3-6
50.0
2-5
40.0
0-0
0.0
0
3
0
1
1
0
8
Nov 8
@ CLE
W 109-97
16
2-4
50.0
1-3
33.3
0-0
0.0
0
0
0
0
0
0
5
Nov 5
vs CHI
W 135-105
11
2-4
50.0
2-3
66.7
1-1
100.0
1
1
0
2
0
1
7
Nov 3
vs BKN
W 103-90
17
2-4
50.0
2-4
50.0
0-0
0.0
1
2
0
2
3
1
6
Oct 31
@ PHI
L 98-93
24
4-8
50.0
2-5
40.0
0-0
0.0
3
1
0
0
3
0
10
Oct 29
@ CHI
W 133-127
14
1-9
11.1
1-7
14.3
0-0
0.0
5
0
2
1
3
1
3
Oct 28
vs DET
W 111-97
17
2-4
50.0
1-3
33.3
0-0
0.0
1
1
0
0
3
0
5
Oct 26
vs ORL
L 111-102
13
0-1
0.0
0-1
0.0
1-2
50.0
1
1
0
1
2
0
1
Oct 24
@ BOS
L 107-103
30
6-9
66.7
6-8
75.0
2-2
100.0
2
1
0
1
2
0
20
Oct 21
vs PHI
L 106-100
14
1-5
20.0
1-3
33.3
0-0
0.0
1
1
1
0
0
1
3
06 / 2026-27 HOME / AWAY, RESULTS, MONTHS AND OPPONENTS
Splits
split
Split
GP
MIN
FG
FG%
3PT
3P%
FT
FT%
OR
DR
REB
AST
BLK
STL
PF
TO
PTS
All Splits
13
18.8
2.6-6.0
43.6
2.1-4.8
43.5
0.3-0.4
80.0
0.5
1.0
1.5
1.1
0.3
0.8
1.6
0.3
7.6
Home
7
17.7
2.4-5.3
45.9
1.9-4.1
44.8
0.3-0.4
66.7
0.1
0.9
1.0
1.6
0.1
1.0
1.6
0.4
7.0
Road
6
20.0
2.8-6.8
41.5
2.3-5.5
42.4
0.3-0.3
100.0
0.8
1.2
2.0
0.5
0.5
0.5
1.7
0.2
8.3
vs. Division
5
19.6
2.8-5.8
48.3
2.4-4.6
52.2
0.4-0.4
100.0
0.6
1.0
1.6
1.0
0.2
0.6
1.8
0.4
8.4
vs. Conference
13
18.8
2.6-6.0
43.6
2.1-4.8
43.5
0.3-0.4
80.0
0.5
1.0
1.5
1.1
0.3
0.8
1.6
0.3
7.6
3+ Days Rest
1
14.0
1.0-5.0
20.0
1.0-3.0
33.3
0.0-0.0
0.0
0.0
1.0
1.0
1.0
1.0
0.0
0.0
1.0
3.0
Month
Split
GP
MIN
FG
FG%
3PT
3P%
FT
FT%
OR
DR
REB
AST
BLK
STL
PF
TO
PTS
October
6
18.7
2.3-6.0
38.9
1.8-4.5
40.7
0.5-0.7
75.0
0.8
1.3
2.2
0.8
0.5
0.5
2.2
0.3
7.0
November
7
18.9
2.9-6.0
47.6
2.3-5.0
45.7
0.1-0.1
100.0
0.1
0.7
0.9
1.3
0.1
1.0
1.1
0.3
8.1
Pre All-Star
13
18.8
2.6-6.0
43.6
2.1-4.8
43.5
0.3-0.4
80.0
0.5
1.0
1.5
1.1
0.3
0.8
1.6
0.3
7.6
Result
Split
GP
MIN
FG
FG%
3PT
3P%
FT
FT%
OR
DR
REB
AST
BLK
STL
PF
TO
PTS
Wins
7
16.3
1.9-4.9
38.2
1.4-4.0
35.7
0.1-0.1
100.0
0.3
1.0
1.3
1.0
0.3
0.9
1.6
0.4
5.3
Losses
6
21.7
3.5-7.3
47.7
2.8-5.7
50.0
0.5-0.7
75.0
0.7
1.0
1.7
1.2
0.3
0.7
1.7
0.2
10.3
Day
Split
GP
MIN
FG
FG%
3PT
3P%
FT
FT%
OR
DR
REB
AST
BLK
STL
PF
TO
PTS
Monday
1
17.0
2.0-4.0
50.0
2.0-4.0
50.0
0.0-0.0
0.0
0.0
1.0
1.0
2.0
0.0
2.0
3.0
1.0
6.0
Tuesday
3
18.7
2.0-5.0
40.0
1.3-3.7
36.4
0.0-0.0
0.0
0.0
0.7
0.7
1.7
0.3
0.3
1.3
0.3
5.3
Wednesday
3
17.7
3.3-8.7
38.5
2.7-6.7
40.0
0.3-0.3
100.0
1.0
1.7
2.7
1.0
0.7
1.3
1.7
0.7
9.7
Friday
3
25.3
4.3-8.3
52.0
3.7-6.7
55.0
0.7-0.7
100.0
1.0
1.0
2.0
1.0
0.3
0.7
2.0
0.0
13.0
Saturday
1
16.0
2.0-4.0
50.0
1.0-3.0
33.3
0.0-0.0
0.0
0.0
0.0
0.0
0.0
0.0
0.0
0.0
0.0
5.0
Sunday
2
13.0
0.5-2.0
25.0
0.5-2.0
25.0
0.5-1.0
50.0
0.0
1.0
1.0
0.5
0.0
0.5
1.5
0.0
2.0
Opponent
Split
GP
MIN
FG
FG%
3PT
3P%
FT
FT%
OR
DR
REB
AST
BLK
STL
PF
TO
PTS
Brooklyn Nets
1
17.0
2.0-4.0
50.0
2.0-4.0
50.0
0.0-0.0
0.0
0.0
1.0
1.0
2.0
0.0
2.0
3.0
1.0
6.0
Boston Celtics
1
30.0
6.0-9.0
66.7
6.0-8.0
75.0
2.0-2.0
100.0
0.0
2.0
2.0
1.0
0.0
1.0
2.0
0.0
20.0
Chicago Bulls
2
12.5
1.5-6.5
23.1
1.5-5.0
30.0
0.5-0.5
100.0
1.0
2.0
3.0
0.5
1.0
1.5
1.5
1.0
5.0
Cleveland Cavaliers
2
21.5
4.5-8.5
52.9
3.0-6.5
46.2
0.0-0.0
0.0
0.5
0.5
1.0
1.0
0.0
0.5
1.0
0.0
12.0
Detroit Pistons
1
17.0
2.0-4.0
50.0
1.0-3.0
33.3
0.0-0.0
0.0
0.0
1.0
1.0
1.0
0.0
0.0
3.0
0.0
5.0
Indiana Pacers
1
22.0
3.0-8.0
37.5
3.0-7.0
42.9
0.0-0.0
0.0
0.0
1.0
1.0
1.0
1.0
1.0
1.0
0.0
9.0
Milwaukee Bucks
1
25.0
3.0-6.0
50.0
2.0-5.0
40.0
0.0-0.0
0.0
0.0
0.0
0.0
3.0
0.0
1.0
1.0
0.0
8.0
Orlando Magic
1
13.0
0.0-1.0
0.0
0.0-1.0
0.0
1.0-2.0
50.0
0.0
1.0
1.0
1.0
0.0
1.0
2.0
0.0
1.0
Philadelphia 76ers
2
19.0
2.5-6.5
38.5
1.5-4.0
37.5
0.0-0.0
0.0
1.5
0.5
2.0
1.0
0.5
0.0
1.5
0.5
6.5
Toronto Raptors
1
14.0
1.0-3.0
33.3
1.0-3.0
33.3
0.0-0.0
0.0
0.0
1.0
1.0
0.0
0.0
0.0
1.0
0.0
3.0
07 / SEASON-BY-SEASON HISTORY
Career statistics
Regular Season Averages
Season
Team
GP
GS
MIN
FG
FG%
3PT
3P%
FT
FT%
OR
DR
REB
AST
BLK
STL
PF
TO
PTS
2021-22
New York Knicks
40
2
9.3
0.8-2.7
29.6
0.4-1.7
25.0
0.2-0.3
66.7
0.1
1.0
1.1
1.0
0.0
0.4
1.1
0.1
2.2
2022-23
New York Knicks
64
2
11.9
1.2-3.4
35.8
0.6-2.1
29.9
0.4-0.7
66.7
0.2
0.6
0.8
1.1
0.1
0.6
0.9
0.4
3.5
2023-24
New York Knicks
68
14
19.5
3.0-6.7
45.2
1.6-3.9
41.0
0.6-0.7
86.0
0.5
1.0
1.5
1.7
0.1
0.7
1.6
0.4
8.3
2024-25
New York Knicks
64
10
24.9
3.5-8.5
40.6
1.8-4.9
36.9
0.8-1.0
81.3
0.7
1.8
2.5
2.9
0.3
1.0
1.7
0.6
9.5
2025-26
New York Knicks
41
15
26.3
4.2-9.9
42.3
2.7-6.6
41.3
0.9-1.1
78.7
0.6
1.9
2.4
2.6
0.2
0.9
1.7
0.8
12.0
2026-27
New York Knicks
13
0
18.8
2.6-6.0
43.6
2.1-4.8
43.5
0.3-0.4
80.0
0.5
1.0
1.5
1.1
0.3
0.8
1.6
0.3
7.6
Career
—
290
43
18.5
2.6-6.2
41.0
1.4-3.8
37.7
0.6-0.8
78.2
0.4
1.2
1.6
1.8
0.2
0.7
1.4
0.5
7.2
Regular Season Totals
Season
Team
FG
FG%
3PT
3P%
FT
FT%
OR
DR
REB
AST
BLK
STL
PF
TO
PTS
2021-22
New York Knicks
32-108
29.6
17-68
25.0
8-12
66.7
4
38
42
41
1
14
45
5
89
2022-23
New York Knicks
77-215
35.8
40-134
29.9
28-42
66.7
13
37
50
72
8
37
60
25
222
2023-24
New York Knicks
205-454
45.2
109-266
41.0
43-50
86.0
31
69
100
114
7
50
108
30
562
2024-25
New York Knicks
222-547
40.6
115-312
36.9
52-64
81.3
47
114
161
187
17
67
108
41
611
2025-26
New York Knicks
171-404
42.3
112-271
41.3
37-47
78.7
24
76
100
106
9
35
70
33
491
2026-27
New York Knicks
34-78
43.6
27-62
43.5
4-5
80.0
6
13
19
14
4
10
21
4
99
Career
—
741-1806
41.0
420-1113
37.7
172-220
78.2
125
347
472
534
46
213
412
138
2074
Regular Season Misc Totals
Season
Team
DD2
TD3
DQ
EJECT
TECH
FLAG
AST/TO
STL/TO
SC-EFF
SH-EFF
2021-22
New York Knicks
0
0
0
0
0
0
8.2
2.8
0.824
0.38
2022-23
New York Knicks
0
0
0
0
0
0
2.9
1.5
1.033
0.45
2023-24
New York Knicks
0
0
0
0
0
0
3.8
1.7
1.238
0.57
2024-25
New York Knicks
0
0
0
0
0
0
4.6
1.6
1.117
0.51
2025-26
New York Knicks
0
0
0
0
0
0
3.2
1.1
1.215
0.56
2026-27
New York Knicks
0
0
0
0
0
0
3.5
2.5
1.269
0.61
Career
—
0
0
0
0
0
0
3.9
1.5
1.148
0.53
Scoring, rebounding and assist trend
08 / SHOT CHART AND ZONE SHOOTING
Shot profile
Shot-location data is not connected. Add a BALLDONTLIE GOAT-tier NBA API key in NBA Players → Settings to enable shot charts and zone shooting.
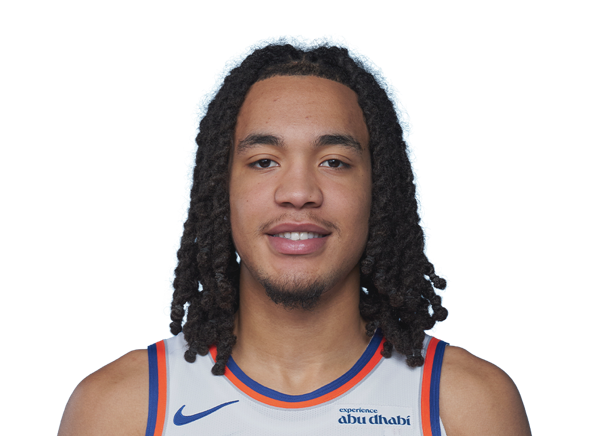
LATEST UPDATEMcBride finished with 19 points (7-13 FG, 5-10 3Pt), two rebounds, two assists and one steal over 27 minutes in Wednesday's 115-107 loss to the Cavaliers.
McBride caught fire off the bench Wednesday, turning in his highest scoring output since the Oct. 23 loss in Boston. The Knicks don't seem to be ready to demote the struggling Mikal Bridges to the second unit quite yet, but more performances like Wednesday's could strengthen McBride's case for an expanded role.




 Andre DrummondC
 Bruce BrownG #1
 Dalton KnechtF #1
 Drew EubanksF #19
 Jaden AkinsG #14
 Jalen BrunsonG #11
 James WisemanC #35
 John KoncharG #55
 Jordan ClarksonG #00
 Jose AlvaradoG #5
 Josh HartG #3
 Karl-Anthony TownsC #32
 Landry ShametG #44
 Mikal BridgesG #25
 Mohamed DiawaraF #51
 N’Faly DanteC #12
 OG AnunobyF #8
 Pacome DadietF #4
 Tyler KolekG #13
 Tyler NickelF #55