Click a season to open this player’s full game log, splits and advanced stats for that year; click a team to open its page. A dash means no NBA games were recorded.
03 / EVERY CATEGORY THE PROVIDER REPORTS
Full statistical breakdown
Regular season 2026-27
Defensive
Metric
Total
NBA rank
Blocks
0
Tied-370th
Defensive Rebounds
2
Tied-405th
Steals
0
Tied-402nd
Defensive Rebound Rate
0.0
—
Defensive Rebounds Per Game
0.7
—
Blocks Per Game
0.0
—
Steals Per Game
0.0
—
Defensive Rebounds Per 48
10.7
2,777th
Blocks Per 48
0.0
2,537th
Steals Per 48
0.0
2,756th
General
Metric
Total
NBA rank
Disqualifications
0
Tied-21st
Flagrant Fouls
0
Tied-22nd
Fouls
3
Tied-391st
Player Efficiency Rating
6.23
—
Rebound Rate
0.0
—
Ejections
0
Tied-7th
Technical Fouls
0
Tied-101st
Rebounds
4
—
Value Over Replacement Player
-0.6
—
Minutes
9
Tied-7th
Minutes Per Game
3.0
—
Rating
1.3
Tied-803rd
Plus-Minus
-2
Tied-1st
Rebounds Per Game
1.3
—
Fouls Per Game
1.0
—
Flagrant Fouls Per Game
0.0
—
Technical Fouls Per Game
0.0
—
Ejections Per Game
0.0
—
Disqualifications Per Game
0.0
—
Assist To Turnover Ratio
0.0
—
Steal To Foul Ratio
0.0
—
Block To Foul Ratio
0.0
—
Team Rebounds Per Game
0.0
—
Rebounds
4
—
Total Technical Fouls
0
—
Assist To Turnover Ratio
0.0
—
Steal To Turnover Ratio
0.0
—
Rebounds Per 48 Minutes
21.3
—
Fouls Per 48 Minutes
16.0
2,681st
Flagrant Fouls Per 48 Minutes
0.0
150th
Technical Fouls Per 48 Minutes
0.0
692nd
Ejections Per 48 Minutes
0.0
48th
Disqualifications Per 48 Minutes
0.0
144th
R/40
17.8
—
Games Played
3
3rd
Games Started
0
Tied-257th
Double Double
0
Tied-119th
Triple Double
0
Tied-12th
Offensive
Metric
Total
NBA rank
Assists
0
Tied-431st
Effective Field Goal Percentage
0.0
—
Field Goals
0/0
—
Field Goals Attempted
0
Tied-460th
Field Goals Made
0
Tied-452nd
Field Goal Percentage
0.0
—
Free Throws
0/0
—
Free Throw Percentage
0.0
—
Free Throws Attempted
0
Tied-418th
Free Throws Made
0
Tied-413th
Offensive Rebounds
2
Tied-358th
Points
0
Tied-458th
Turnovers
0
Tied-435th
3-Point Field Goal Percentage
0.0
—
3-Point Field Goals Attempted
0
Tied-420th
3-Point Field Goals Made
0
Tied-379th
True Shooting Percentage
0.0
—
Total Turnovers
0
—
Assist Ratio
0.0
—
Points in the Paint
0
Tied-1st
Offensive Rebound Rate
0.0
—
Turnover Ratio
0.0
—
Brick Index
0.00
—
Usage Rate
0.0
—
Average Field Goals Made
0.0
—
Average Field Goals Attempted
0.0
—
Average 3-Point Field Goals Made
0.0
—
Average 3-Point Field Goals Attempted
0.0
—
Average Free Throws Made
0.0
—
Average Free Throws Attempted
0.0
—
Points Per Game
0.0
—
Offensive Rebounds Per Game
0.7
—
Assists Per Game
0.0
—
Turnovers Per Game
0.0
—
Offensive Rebound Percentage
0.0
—
Estimated Possessions
-2.0
—
Estimated Possessions Per Game
-0.7
—
Points Per Estimated Possession
0.0
—
Team Turnovers Per Game
0.0
—
Total Turnovers Per Game
0.0
—
3-Point Field Goal Percentage
0.0
—
2-Point Field Goals Made
0.0
Tied-73rd
2-Point Field Goals Attempted
0.0
Tied-40th
2-Point Field Goals Made per Game
0.0
—
2-Point Field Goals Attempted per Game
0.0
—
2-Point Field Goal Percentage
0.0
—
Shooting Efficiency
0.00
—
Scoring Efficiency
0.000
—
Fieldgoals Made Per 48
0.0
3,099th
Fieldgoals Attempted Per 48
0.0
3,154th
3-Point Fieldgoals Made Per 48
0.0
2,598th
3-Point Fieldgoals Attempted Per 48
0.0
2,880th
Freethrows Made Per 48
0.0
2,832nd
Freethrows Attempted Per 48
0.0
2,866th
Points Scored Per 48
0.0
3,140th
Offensive Rebounds Per 48
10.7
2,454th
Assists Per 48
0.0
2,955th
Turnovers
0.0
2,982nd
P/40
0.0
—
A/40
0.0
—
04 / EFFICIENCY, SHOOTING PROFILE, PER-36
Advanced metrics
Stocks (STL + BLK) per game0.00
Pts + Reb + Ast per game1.3
Efficiency (EFF) per game1.3
Game Score per game (Hollinger)0.3
Calculated by BallersCulture from the supplied 2026-27 box-score totals using standard formulas (hover a tile to see the formula). Tracking-based metrics such as BPM, VORP, on/off and RAPTOR are not available from this data source.
05 / 3 GAMES IN 2026-27
Game log: Regular season
Date
Opp
Result
MIN
FG
FG%
3PT
3P%
FT
FT%
REB
AST
BLK
STL
PF
TO
PTS
Nov 16
vs IND
W 131-124
5
0-0
0.0
0-0
0.0
0-0
0.0
3
0
0
0
1
0
0
Nov 13
vs TOR
W 123-112
1
0-0
0.0
0-0
0.0
0-0
0.0
0
0
0
0
1
0
0
Nov 7
@ CLE
L 119-95
3
0-0
0.0
0-0
0.0
0-0
0.0
1
0
0
0
1
0
0
06 / 2026-27 HOME / AWAY, RESULTS, MONTHS AND OPPONENTS
Splits
split
Split
GP
MIN
FG
FG%
3PT
3P%
FT
FT%
OR
DR
REB
AST
BLK
STL
PF
TO
PTS
All Splits
3
3.0
0.0-0.0
0.0
0.0-0.0
0.0
0.0-0.0
0.0
0.7
0.7
1.3
0.0
0.0
0.0
1.0
0.0
0.0
Home
2
3.0
0.0-0.0
0.0
0.0-0.0
0.0
0.0-0.0
0.0
1.0
0.5
1.5
0.0
0.0
0.0
1.0
0.0
0.0
Road
1
3.0
0.0-0.0
0.0
0.0-0.0
0.0
0.0-0.0
0.0
0.0
1.0
1.0
0.0
0.0
0.0
1.0
0.0
0.0
vs. Division
1
1.0
0.0-0.0
0.0
0.0-0.0
0.0
0.0-0.0
0.0
0.0
0.0
0.0
0.0
0.0
0.0
1.0
0.0
0.0
vs. Conference
3
3.0
0.0-0.0
0.0
0.0-0.0
0.0
0.0-0.0
0.0
0.7
0.7
1.3
0.0
0.0
0.0
1.0
0.0
0.0
3+ Days Rest
2
2.0
0.0-0.0
0.0
0.0-0.0
0.0
0.0-0.0
0.0
0.0
0.5
0.5
0.0
0.0
0.0
1.0
0.0
0.0
Month
Split
GP
MIN
FG
FG%
3PT
3P%
FT
FT%
OR
DR
REB
AST
BLK
STL
PF
TO
PTS
November
3
3.0
0.0-0.0
0.0
0.0-0.0
0.0
0.0-0.0
0.0
0.7
0.7
1.3
0.0
0.0
0.0
1.0
0.0
0.0
Pre All-Star
3
3.0
0.0-0.0
0.0
0.0-0.0
0.0
0.0-0.0
0.0
0.7
0.7
1.3
0.0
0.0
0.0
1.0
0.0
0.0
Result
Split
GP
MIN
FG
FG%
3PT
3P%
FT
FT%
OR
DR
REB
AST
BLK
STL
PF
TO
PTS
Wins
2
3.0
0.0-0.0
0.0
0.0-0.0
0.0
0.0-0.0
0.0
1.0
0.5
1.5
0.0
0.0
0.0
1.0
0.0
0.0
Losses
1
3.0
0.0-0.0
0.0
0.0-0.0
0.0
0.0-0.0
0.0
0.0
1.0
1.0
0.0
0.0
0.0
1.0
0.0
0.0
Day
Split
GP
MIN
FG
FG%
3PT
3P%
FT
FT%
OR
DR
REB
AST
BLK
STL
PF
TO
PTS
Thursday
1
1.0
0.0-0.0
0.0
0.0-0.0
0.0
0.0-0.0
0.0
0.0
0.0
0.0
0.0
0.0
0.0
1.0
0.0
0.0
Friday
1
3.0
0.0-0.0
0.0
0.0-0.0
0.0
0.0-0.0
0.0
0.0
1.0
1.0
0.0
0.0
0.0
1.0
0.0
0.0
Sunday
1
5.0
0.0-0.0
0.0
0.0-0.0
0.0
0.0-0.0
0.0
2.0
1.0
3.0
0.0
0.0
0.0
1.0
0.0
0.0
Opponent
Split
GP
MIN
FG
FG%
3PT
3P%
FT
FT%
OR
DR
REB
AST
BLK
STL
PF
TO
PTS
Cleveland Cavaliers
1
3.0
0.0-0.0
0.0
0.0-0.0
0.0
0.0-0.0
0.0
0.0
1.0
1.0
0.0
0.0
0.0
1.0
0.0
0.0
Indiana Pacers
1
5.0
0.0-0.0
0.0
0.0-0.0
0.0
0.0-0.0
0.0
2.0
1.0
3.0
0.0
0.0
0.0
1.0
0.0
0.0
Toronto Raptors
1
1.0
0.0-0.0
0.0
0.0-0.0
0.0
0.0-0.0
0.0
0.0
0.0
0.0
0.0
0.0
0.0
1.0
0.0
0.0
07 / SEASON-BY-SEASON HISTORY
Career statistics
Regular Season Averages
Season
Team
GP
GS
MIN
FG
FG%
3PT
3P%
FT
FT%
OR
DR
REB
AST
BLK
STL
PF
TO
PTS
2019-20
Boston Celtics
7
0
4.7
1.6-2.0
78.6
0.0-0.0
0.0
0.1-0.4
33.3
0.1
2.0
2.1
0.1
0.6
0.1
1.0
0.4
3.3
2020-21
Boston Celtics
19
0
7.2
1.1-1.5
72.4
0.0-0.0
0.0
0.3-0.8
33.3
0.8
1.9
2.7
0.2
1.1
0.1
1.2
0.3
2.5
2021-22
Cleveland Cavaliers
11
1
5.4
0.5-1.1
41.7
0.0-0.0
0.0
0.2-0.6
28.6
0.6
1.5
2.1
0.2
0.5
0.0
0.3
0.3
1.1
2026-27
Philadelphia 76ers
3
0
3.0
0.0-0.0
0.0
0.0-0.0
0.0
0.0-0.0
0.0
0.7
0.7
1.3
0.0
0.0
0.0
1.0
0.0
0.0
Career
—
40
1
5.9
0.9-1.4
67.3
0.0-0.0
0.0
0.2-0.6
32.0
0.7
1.7
2.4
0.2
0.8
0.1
0.9
0.3
2.1
Regular Season Totals
Season
Team
FG
FG%
3PT
3P%
FT
FT%
OR
DR
REB
AST
BLK
STL
PF
TO
PTS
2019-20
Boston Celtics
11-14
78.6
0-0
0.0
1-3
33.3
1
14
15
1
4
1
7
3
23
2020-21
Boston Celtics
21-29
72.4
0-0
0.0
5-15
33.3
16
36
52
3
20
1
22
6
47
2021-22
Cleveland Cavaliers
5-12
41.7
0-0
0.0
2-7
28.6
7
16
23
2
6
0
3
3
12
2026-27
Philadelphia 76ers
0-0
0.0
0-0
0.0
0-0
0.0
2
2
4
0
0
0
3
0
0
Career
—
37-55
67.3
0-0
0.0
8-25
32.0
26
68
94
6
30
2
35
12
82
Regular Season Misc Totals
Season
Team
DD2
TD3
DQ
EJECT
TECH
FLAG
AST/TO
STL/TO
SC-EFF
SH-EFF
2019-20
Boston Celtics
0
0
0
0
0
0
0.3
0.3
1.643
0.79
2020-21
Boston Celtics
0
0
0
0
0
0
0.5
0.2
1.621
0.72
2021-22
Cleveland Cavaliers
0
0
0
0
0
0
0.7
0.0
1.000
0.42
Career
—
0
0
0
0
0
0
0.5
0.2
1.491
0.67
Scoring, rebounding and assist trend
08 / SHOT CHART AND ZONE SHOOTING
Shot profile
Shot-location data is not connected. Add a BALLDONTLIE GOAT-tier NBA API key in NBA Players → Settings to enable shot charts and zone shooting.
LATEST UPDATEFall chipped in one rebound across three minutes during Friday's 119-95 loss to the Cavaliers.
Fall was sidelined at the start of the regular season with a quadriceps injury but has since recovered and finally made his season debut in garbage time Friday. However, even when he's healthy, the backup big man isn't expected to be part of the regular rotation.



 Adem BonaC #30
 Anfernee SimonsG #5
 Ariel HukportiC #55
 Caleb LoveG #8
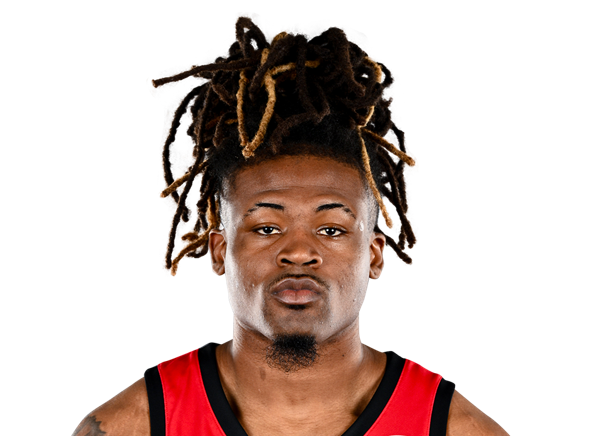 Cris CarrollF
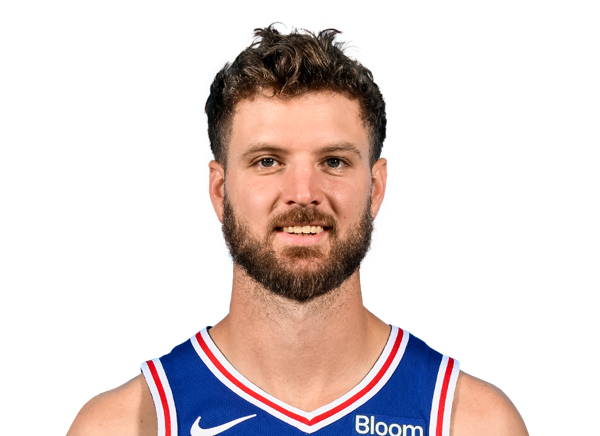 Dean WadeF #45
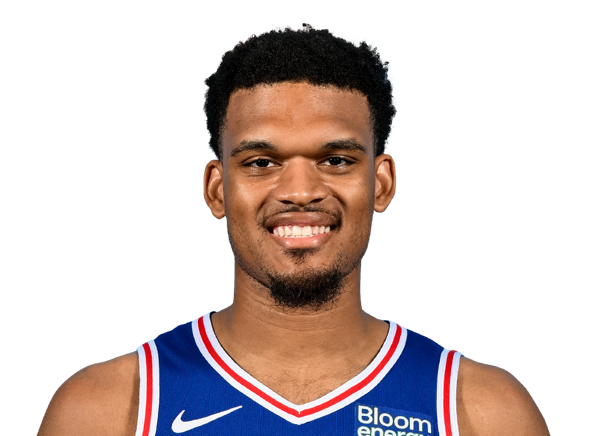 Dillon JonesF #35
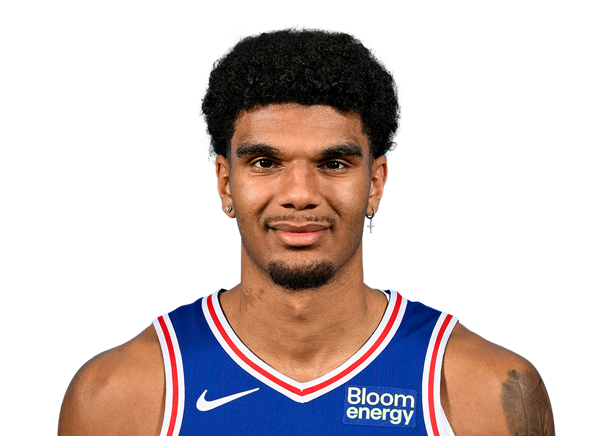 Dominick BarlowF #25
 Duke MilesG #31
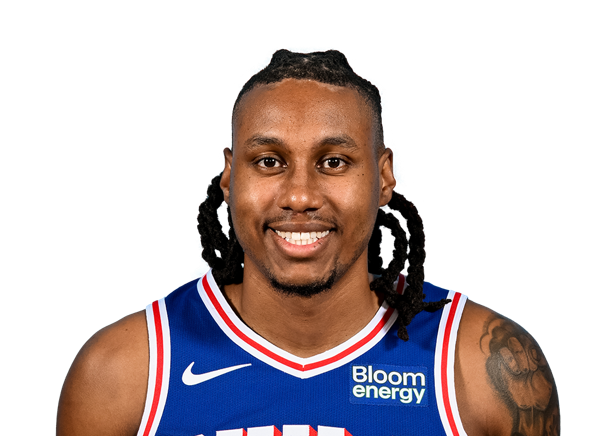 Jabari WalkerF #33
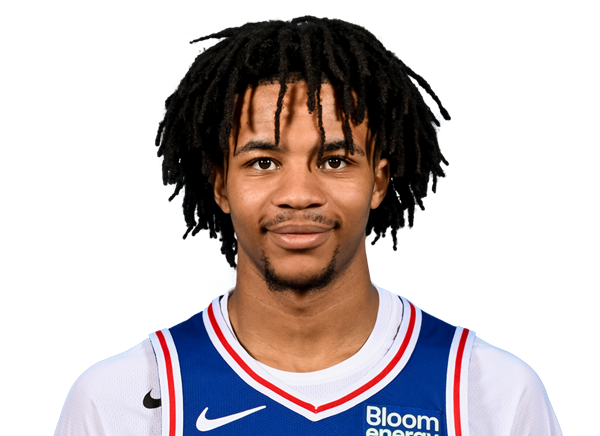 Jameer Nelson Jr.G #14
 Jaylen BrownG #7
 Joel EmbiidC #21
 Justin EdwardsF #11
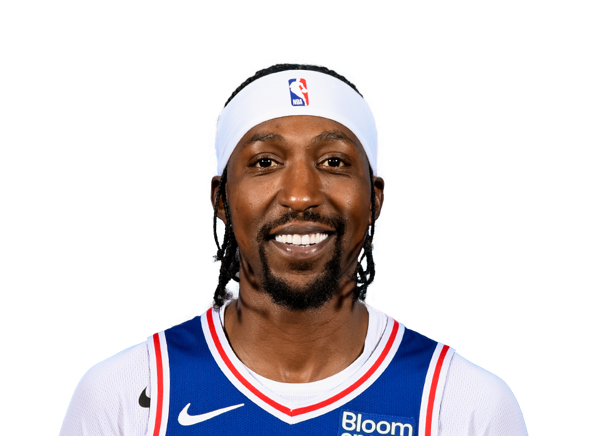 Kentavious Caldwell-PopeG #1
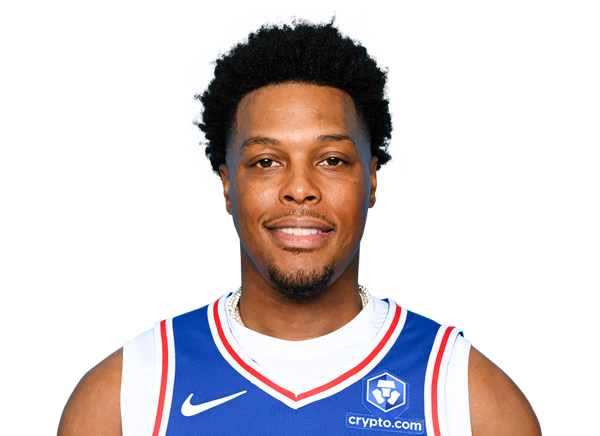 Kyle LowryG #7
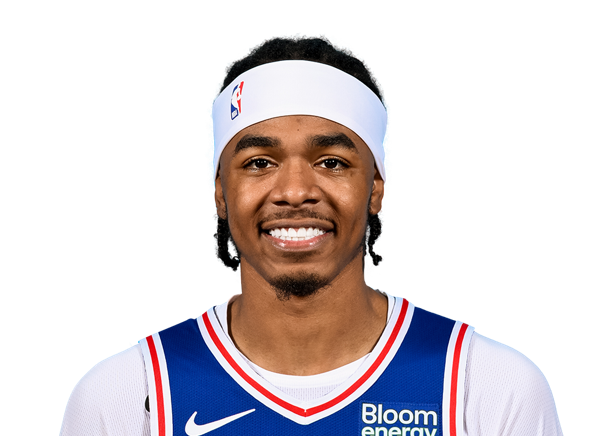 Labaron Philon Jr.G #00
 LeBron JamesF #23
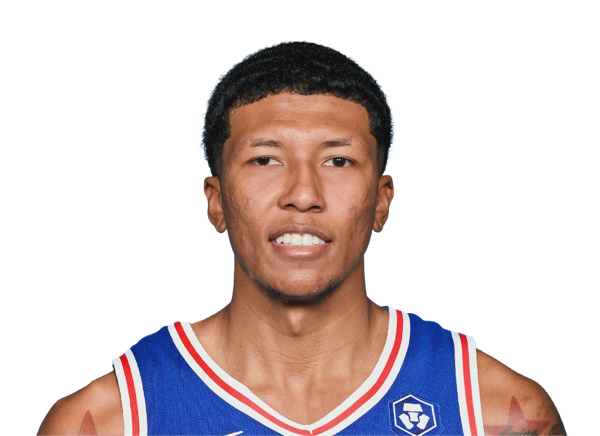 MarJon BeauchampF #16
 Rayan RupertG #12
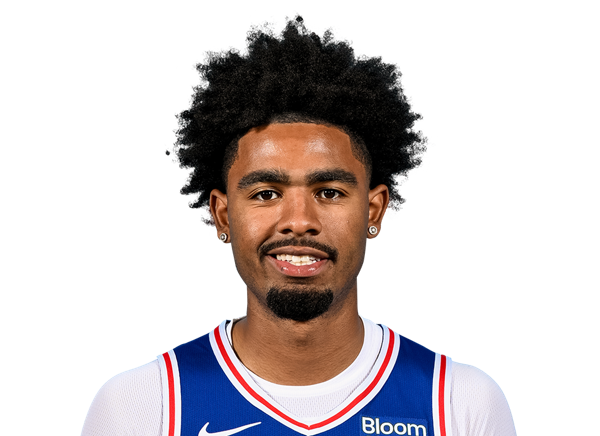 Saint ThomasF #19
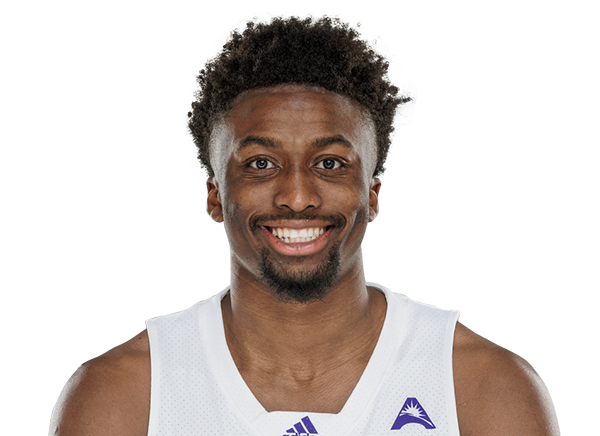 Taye FieldsG
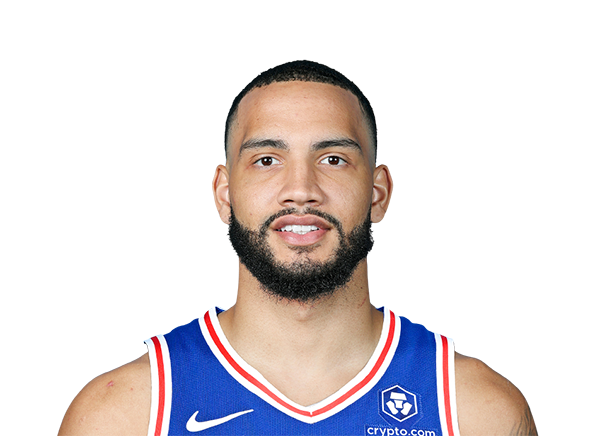 Tyrese MartinG #23
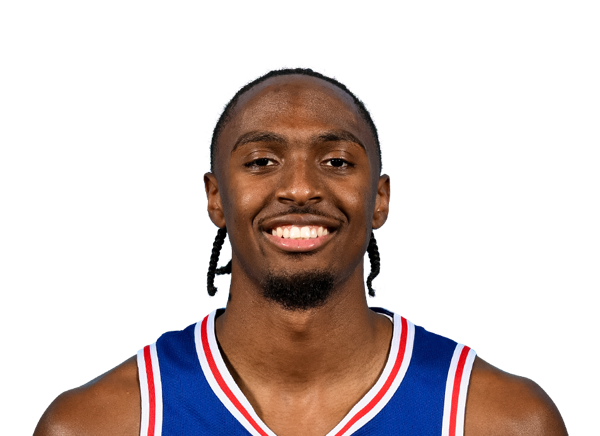 Tyrese MaxeyG
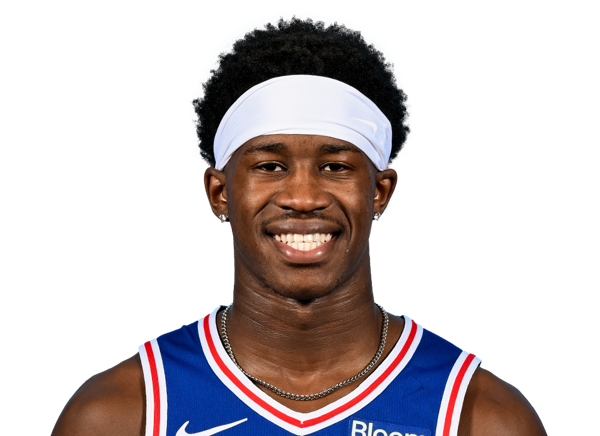 VJ EdgecombeG #77