Click a season to open this player’s full game log, splits and advanced stats for that year; click a team to open its page. A dash means no NBA games were recorded.
03 / SEASON-BY-SEASON HISTORY
Career statistics
Regular Season Averages
Season
Team
GP
GS
MIN
FG
FG%
3PT
3P%
FT
FT%
OR
DR
REB
AST
BLK
STL
PF
TO
PTS
2006-07
Memphis Grizzlies
10
0
17.5
1.4-3.8
36.8
0.3-0.8
37.5
2.5-2.8
89.3
1.2
1.9
3.1
3.2
0.1
1.4
2.0
1.2
5.6
2007-08
Memphis Grizzlies
82
9
25.5
3.1-7.2
43.2
0.4-1.7
25.7
3.0-4.2
69.8
0.5
2.5
3.0
3.6
0.3
1.1
2.3
1.5
9.6
2008-09
Memphis Grizzlies
49
21
21.9
2.3-5.6
41.2
0.3-1.4
24.6
2.6-3.3
80.1
0.3
2.0
2.3
3.6
0.2
1.0
1.8
1.6
7.6
2008-09
Houston Rockets
28
0
21.7
2.8-5.8
47.5
0.3-1.0
27.6
1.9-2.3
80.0
0.5
2.3
2.8
3.5
0.3
0.8
2.0
1.4
7.6
2008-09
2008 09 Totals
77
21
21.8
2.5-5.6
43.5
0.3-1.3
25.5
2.4-2.9
80.1
0.3
2.1
2.5
3.6
0.2
0.9
1.9
1.5
7.6
2009-10
Houston Rockets
68
0
24.3
2.7-6.8
39.7
0.5-2.0
27.2
3.2-3.8
82.7
1.3
2.3
3.6
4.5
0.1
0.9
2.5
1.7
9.1
2010-11
Houston Rockets
75
71
34.2
4.6-10.8
42.6
1.7-4.6
37.6
2.6-3.3
76.5
1.2
2.9
4.1
6.7
0.3
1.4
2.8
2.1
13.5
2011-12
Houston Rockets
47
38
32.1
4.5-10.9
40.9
1.7-4.5
37.4
3.6-4.2
86.4
0.8
3.7
4.6
6.6
0.3
1.6
2.8
2.8
14.3
2012-13
Toronto Raptors
68
52
29.7
3.7-9.2
40.1
1.5-4.1
36.2
2.8-3.5
79.5
0.8
3.9
4.7
6.4
0.4
1.4
3.2
2.3
11.6
2013-14
Toronto Raptors
79
79
36.2
5.8-13.7
42.3
2.4-6.3
38.0
4.0-4.9
81.3
1.1
3.6
4.7
7.4
0.2
1.5
3.4
2.5
17.9
2014-15
Toronto Raptors
70
70
34.5
6.1-14.9
41.2
1.9-5.6
33.8
3.6-4.5
80.8
0.8
3.9
4.7
6.8
0.2
1.6
3.0
2.5
17.8
2015-16
Toronto Raptors
77
77
37.0
6.6-15.6
42.7
2.8-7.1
38.8
5.2-6.4
81.1
0.7
4.0
4.7
6.4
0.4
2.1
2.7
2.9
21.2
2016-17
Toronto Raptors
60
60
37.4
7.1-15.3
46.4
3.2-7.8
41.2
5.0-6.1
81.9
0.8
4.0
4.8
7.0
0.3
1.5
2.8
2.9
22.4
2017-18
Toronto Raptors
78
78
32.2
5.2-12.1
42.7
3.1-7.6
39.9
2.9-3.3
85.4
0.8
4.7
5.6
6.9
0.2
1.1
2.5
2.3
16.2
2018-19
Toronto Raptors
65
65
34.0
4.7-11.4
41.1
2.4-7.0
34.7
2.5-3.0
83.0
0.6
4.2
4.8
8.7
0.5
1.4
2.6
2.8
14.2
2019-20
Toronto Raptors
58
58
36.2
5.8-13.8
41.6
2.8-8.0
35.2
5.1-5.9
85.7
0.6
4.5
5.0
7.5
0.4
1.4
3.3
3.1
19.4
2020-21
Toronto Raptors
46
46
34.8
5.7-13.0
43.6
2.8-7.2
39.6
3.0-3.5
87.5
0.8
4.6
5.4
7.3
0.3
1.0
3.1
2.7
17.2
2021-22
Miami Heat
63
63
33.9
4.4-10.0
44.0
2.3-6.1
37.7
2.3-2.8
85.1
0.5
4.0
4.5
7.5
0.3
1.1
2.8
2.7
13.4
2022-23
Miami Heat
55
44
31.2
3.6-8.8
40.4
1.9-5.6
34.5
2.1-2.5
85.9
0.8
3.3
4.1
5.1
0.4
1.0
2.6
1.9
11.2
2023-24
Miami Heat
37
35
28.0
2.8-6.5
42.6
1.7-4.4
38.5
0.9-1.1
83.3
0.7
2.8
3.5
4.0
0.4
1.1
2.5
1.4
8.2
2023-24
Philadelphia 76ers
23
20
28.4
2.6-5.9
44.4
1.6-3.9
40.4
1.2-1.4
84.8
0.4
2.4
2.8
4.6
0.3
0.9
2.3
1.4
8.0
2023-24
2023 24 Totals
60
55
28.2
2.7-6.3
43.2
1.6-4.2
39.2
1.1-1.3
84.0
0.6
2.7
3.2
4.2
0.4
1.0
2.4
1.4
8.1
2024-25
Philadelphia 76ers
35
12
18.8
1.2-3.3
35.0
0.8-2.5
33.0
0.8-0.9
81.8
0.3
1.6
1.9
2.7
0.3
0.9
1.8
0.6
3.9
2025-26
Philadelphia 76ers
14
0
8.4
0.3-1.8
16.0
0.3-1.8
16.0
0.4-0.4
83.3
0.0
0.6
0.6
0.8
0.1
0.1
0.6
0.3
1.2
Career
—
1187
898
31.0
4.4-10.5
42.3
1.9-5.1
36.7
3.1-3.8
81.5
0.8
3.4
4.2
6.0
0.3
1.3
2.7
2.2
13.8
Regular Season Totals
Season
Team
FG
FG%
3PT
3P%
FT
FT%
OR
DR
REB
AST
BLK
STL
PF
TO
PTS
2006-07
Memphis Grizzlies
14-38
36.8
3-8
37.5
25-28
89.3
12
19
31
32
1
14
20
12
56
2007-08
Memphis Grizzlies
256-592
43.2
36-140
25.7
243-348
69.8
41
209
250
296
22
92
185
127
791
2008-09
Memphis Grizzlies
112-272
41.2
17-69
24.6
129-161
80.1
13
98
111
178
8
48
89
79
370
2008-09
Houston Rockets
77-162
47.5
8-29
27.6
52-65
80.0
13
65
78
97
9
21
57
38
214
2008-09
2008 09 Totals
189-434
43.5
25-98
25.5
181-226
80.1
26
163
189
275
17
69
146
117
584
2009-10
Houston Rockets
184-464
39.7
37-136
27.2
215-260
82.7
91
156
247
305
9
60
173
116
620
2010-11
Houston Rockets
345-809
42.6
129-343
37.6
192-251
76.5
89
220
309
500
23
102
207
158
1011
2011-12
Houston Rockets
210-513
40.9
79-211
37.4
171-198
86.4
38
176
214
310
14
73
133
130
670
2012-13
Toronto Raptors
250-623
40.1
101-279
36.2
190-239
79.5
56
265
321
435
24
94
218
157
791
2013-14
Toronto Raptors
457-1080
42.3
190-500
38.0
313-385
81.3
88
281
369
586
15
121
267
194
1417
2014-15
Toronto Raptors
430-1043
41.2
132-391
33.8
252-312
80.8
54
274
328
473
13
109
212
173
1244
2015-16
Toronto Raptors
512-1198
42.7
212-547
38.8
398-491
81.1
55
310
365
494
34
158
211
225
1634
2016-17
Toronto Raptors
426-918
46.4
193-468
41.2
299-365
81.9
48
238
286
417
19
89
170
173
1344
2017-18
Toronto Raptors
403-944
42.7
238-596
39.9
223-261
85.4
66
368
434
537
19
85
192
183
1267
2018-19
Toronto Raptors
304-739
41.1
157-453
34.7
161-194
83.0
41
271
312
564
31
91
166
182
926
2019-20
Toronto Raptors
334-803
41.6
164-466
35.2
294-343
85.7
32
260
292
433
26
82
190
178
1126
2020-21
Toronto Raptors
260-596
43.6
131-331
39.6
140-160
87.5
35
212
247
338
14
45
143
126
791
2021-22
Miami Heat
276-627
44.0
144-382
37.7
148-174
85.1
33
249
282
474
17
67
177
168
844
2022-23
Miami Heat
196-485
40.4
107-310
34.5
116-135
85.9
43
182
225
281
21
57
143
103
615
2023-24
Miami Heat
103-242
42.6
62-161
38.5
35-42
83.3
25
104
129
147
15
39
94
53
303
2023-24
Philadelphia 76ers
60-135
44.4
36-89
40.4
28-33
84.8
9
56
65
106
6
20
52
32
184
2023-24
2023 24 Totals
163-377
43.2
98-250
39.2
63-75
84.0
34
160
194
253
21
59
146
85
487
2024-25
Philadelphia 76ers
41-117
35.0
29-88
33.0
27-33
81.8
11
56
67
96
11
33
62
21
138
2025-26
Philadelphia 76ers
4-25
16.0
4-25
16.0
5-6
83.3
0
9
9
11
2
2
8
4
17
Career
—
5254-12425
42.3
2209-6022
36.7
3656-4484
81.5
893
4078
4971
7110
353
1502
3169
2632
16373
Regular Season Misc Totals
Season
Team
DD2
TD3
DQ
EJECT
TECH
FLAG
AST/TO
STL/TO
SC-EFF
SH-EFF
2006-07
Memphis Grizzlies
0
0
0
0
0
0
2.7
1.2
1.474
0.41
2007-08
Memphis Grizzlies
1
0
1
0
1
0
2.3
0.7
1.336
0.46
2008-09
Memphis Grizzlies
1
0
1
0
0
2
2.3
0.6
1.360
0.44
2008-09
Houston Rockets
0
0
0
0
0
0
2.6
0.6
1.321
0.50
2008-09
2008 09 Totals
1
0
1
0
0
2
2.4
0.6
1.346
0.46
2009-10
Houston Rockets
2
0
0
0
2
0
2.6
0.5
1.336
0.44
2010-11
Houston Rockets
10
1
0
0
5
0
3.2
0.6
1.250
0.51
2011-12
Houston Rockets
4
1
0
0
4
0
2.4
0.6
1.306
0.49
2012-13
Toronto Raptors
11
1
1
1
8
0
2.8
0.6
1.270
0.48
2013-14
Toronto Raptors
18
2
5
1
11
1
3.0
0.6
1.312
0.51
2014-15
Toronto Raptors
13
2
1
0
8
1
2.7
0.6
1.193
0.48
2015-16
Toronto Raptors
12
1
1
2
11
1
2.2
0.7
1.364
0.52
2016-17
Toronto Raptors
11
1
1
1
8
1
2.4
0.5
1.464
0.57
2017-18
Toronto Raptors
23
3
2
2
10
1
2.9
0.5
1.342
0.55
2018-19
Toronto Raptors
20
2
1
0
8
1
3.1
0.5
1.253
0.52
2019-20
Toronto Raptors
15
2
0
0
14
2
2.4
0.5
1.402
0.52
2020-21
Toronto Raptors
9
2
1
3
9
2
2.7
0.4
1.327
0.55
2021-22
Miami Heat
16
2
1
1
10
0
2.8
0.4
1.346
0.56
2022-23
Miami Heat
2
1
1
0
5
0
2.7
0.6
1.268
0.51
2023-24
Miami Heat
1
0
0
0
1
0
2.8
0.7
1.252
0.55
2023-24
Philadelphia 76ers
2
0
1
0
1
0
3.3
0.6
1.363
0.58
2023-24
2023 24 Totals
3
0
1
0
2
0
3.0
0.7
1.292
0.56
2024-25
Philadelphia 76ers
0
0
0
0
1
0
4.6
1.6
1.179
0.47
2025-26
Philadelphia 76ers
0
0
0
0
0
0
2.8
0.5
0.680
0.24
Career
—
171
21
18
11
117
12
2.7
0.6
1.318
0.51
Scoring, rebounding and assist trend
04 / SHOT CHART AND ZONE SHOOTING
Shot profile
Shot-location data is not connected. Add a BALLDONTLIE GOAT-tier NBA API key in NBA Players → Settings to enable shot charts and zone shooting.
LATEST UPDATELowry signed a one-day contract to retire with the Raptors on Tuesday.
Lowry will call it a career after 20 seasons in the NBA, six All-Star nods -- all of which came with Toronto -- and an NBA championship. The No. 24 overall pick in the 2006 NBA Draft played for Memphis, Houston, Toronto, Miami and Philadelphia, finishing with career averages of 12.8 points, 5.6 assists, 4.0 rebounds and 1.2 steals in 29.4 minutes per contest. During his nine-year stint with the Raptors, Lowry averaged 17.5 points, 7.2 assists, 4.9 rebounds and 1.4 steals across 34.7 minutes per showing.




 Adem BonaC #30
 Anfernee SimonsG #5
 Ariel HukportiC #55
 Caleb LoveG #8
 Cris CarrollF
 Dean WadeF #45
 Dillon JonesF #35
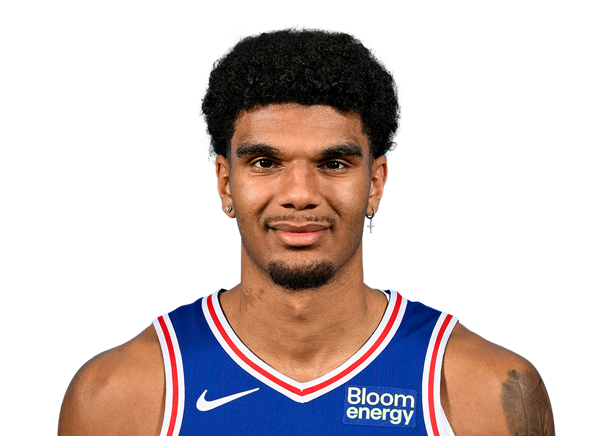 Dominick BarlowF #25
 Duke MilesG #31
 Jabari WalkerF #33
 Jameer Nelson Jr.G #14
 Jaylen BrownG #7
 Joel EmbiidC #21
 Justin EdwardsF #11
 Kentavious Caldwell-PopeG #1
 Labaron Philon Jr.G #00
 LeBron JamesF #23
 MarJon BeauchampF #16
 Rayan RupertG #12
 Saint ThomasF #19
 Tacko FallC #99
 Taye FieldsG
 Tyrese MartinG #23
 Tyrese MaxeyG
 VJ EdgecombeG #77