Click a season to open this player’s full game log, splits and advanced stats for that year; click a team to open its page. A dash means no NBA games were recorded.
03 / EVERY CATEGORY THE PROVIDER REPORTS
Full statistical breakdown
Regular season 2026-27
Defensive
Metric
Total
NBA rank
Blocks
8
Tied-82nd
Defensive Rebounds
74
Tied-21st
Steals
13
Tied-74th
Defensive Rebound Rate
0.0
—
Defensive Rebounds Per Game
6.7
Tied-16th
Blocks Per Game
0.7
Tied-72nd
Steals Per Game
1.2
51st
Defensive Rebounds Per 48
9.9
Tied-1,008th
Blocks Per 48
1.1
Tied-3,936th
Steals Per 48
1.7
Tied-3,552nd
General
Metric
Total
NBA rank
Disqualifications
0
Tied-21st
Flagrant Fouls
0
Tied-22nd
Fouls
23
Tied-176th
Player Efficiency Rating
16.46
109th
Rebound Rate
0.0
—
Ejections
0
Tied-7th
Technical Fouls
1
Tied-29th
Rebounds
79
—
Value Over Replacement Player
0.0
—
Minutes
358
1st
Minutes Per Game
32.5
—
Rating
32.5
Tied-38th
Plus-Minus
+8
Tied-1st
Rebounds Per Game
7.2
32nd
Fouls Per Game
2.1
Tied-149th
Flagrant Fouls Per Game
0.0
Tied-19th
Technical Fouls Per Game
0.1
Tied-31st
Ejections Per Game
0.0
Tied-6th
Disqualifications Per Game
0.0
Tied-20th
Assist To Turnover Ratio
2.6
—
Steal To Foul Ratio
0.6
—
Block To Foul Ratio
0.3
—
Team Rebounds Per Game
0.0
—
Rebounds
79
—
Total Technical Fouls
1
—
Assist To Turnover Ratio
0.0
—
Steal To Turnover Ratio
0.4
—
Rebounds Per 48 Minutes
10.6
—
Fouls Per 48 Minutes
3.1
Tied-8,448th
Flagrant Fouls Per 48 Minutes
0.0
Tied-1,056th
Technical Fouls Per 48 Minutes
0.1
Tied-1,392nd
Ejections Per 48 Minutes
0.0
Tied-336th
Disqualifications Per 48 Minutes
0.0
Tied-1,008th
R/40
8.8
—
Games Played
11
11th
Games Started
11
Tied-83rd
Double Double
4
Tied-18th
Triple Double
0
Tied-12th
Offensive
Metric
Total
NBA rank
Assists
76
22nd
Effective Field Goal Percentage
47.5
—
Field Goals
62/140
—
Field Goals Attempted
140
Tied-76th
Field Goals Made
62
Tied-78th
Field Goal Percentage
44.3
91st
Free Throws
33/46
—
Free Throw Percentage
71.7
194th
Free Throws Attempted
46
Tied-56th
Free Throws Made
33
Tied-64th
Offensive Rebounds
5
Tied-276th
Points
166
Tied-86th
Turnovers
29
Tied-44th
3-Point Field Goal Percentage
22.5
Tied-248th
3-Point Field Goals Attempted
40
Tied-163rd
3-Point Field Goals Made
9
Tied-219th
True Shooting Percentage
51.8
—
Total Turnovers
29
—
Assist Ratio
28.7
—
Points in the Paint
0
Tied-1st
Offensive Rebound Rate
0.0
—
Turnover Ratio
10.9
—
Brick Index
0.00
—
Usage Rate
0.0
—
Average Field Goals Made
5.6
64th
Average Field Goals Attempted
12.7
405th
Average 3-Point Field Goals Made
0.8
—
Average 3-Point Field Goals Attempted
3.6
Tied-139th
Average Free Throws Made
3.0
Tied-60th
Average Free Throws Attempted
4.2
51st
Points Per Game
15.1
73rd
Offensive Rebounds Per Game
0.5
Tied-238th
Assists Per Game
6.9
15th
Turnovers Per Game
2.6
37th
Offensive Rebound Percentage
0.1
—
Estimated Possessions
182.4
—
Estimated Possessions Per Game
16.6
—
Points Per Estimated Possession
0.9
—
Team Turnovers Per Game
0.0
—
Total Turnovers Per Game
2.6
—
3-Point Field Goal Percentage
22.5
—
2-Point Field Goals Made
53.0
141st
2-Point Field Goals Attempted
100.0
87th
2-Point Field Goals Made per Game
4.8
—
2-Point Field Goals Attempted per Game
9.1
—
2-Point Field Goal Percentage
53.0
91st
Shooting Efficiency
0.48
—
Scoring Efficiency
1.186
—
Fieldgoals Made Per 48
8.3
Tied-3,744th
Fieldgoals Attempted Per 48
18.8
Tied-3,648th
3-Point Fieldgoals Made Per 48
1.2
Tied-10,512th
3-Point Fieldgoals Attempted Per 48
5.4
Tied-7,824th
Freethrows Made Per 48
4.4
Tied-3,072nd
Freethrows Attempted Per 48
6.2
Tied-2,688th
Points Scored Per 48
22.3
Tied-4,128th
Offensive Rebounds Per 48
0.7
Tied-13,248th
Assists Per 48
10.2
1,056th
Turnovers
3.9
Tied-2,112th
P/40
18.5
—
A/40
8.5
—
04 / EFFICIENCY, SHOOTING PROFILE, PER-36
Advanced metrics
True shooting %51.9%
Effective FG %47.2%
2-point FG %52.7%
3-point attempt rate28.3%
Free throw rate33.1%
Points per shot attempt1.19
% of points from 3s15.9%
Assist-to-turnover2.65
Points per 36 min16.7
Rebounds per 36 min8.0
Assists per 36 min7.6
Steals per 36 min1.33
Blocks per 36 min0.78
Turnovers per 36 min2.88
Stocks (STL + BLK) per game1.90
Pts + Reb + Ast per game29.2
Efficiency (EFF) per game20.2
Game Score per game (Hollinger)13.4
Minutes per game32.5
Calculated by BallersCulture from the supplied 2026-27 box-score totals using standard formulas (hover a tile to see the formula). Tracking-based metrics such as BPM, VORP, on/off and RAPTOR are not available from this data source.
05 / 11 GAMES IN 2026-27
Game log: Regular season
Date
Opp
Result
MIN
FG
FG%
3PT
3P%
FT
FT%
REB
AST
BLK
STL
PF
TO
PTS
Nov 16
vs IND
W 131-124
33
5-8
62.5
0-2
0.0
5-6
83.3
7
11
1
0
3
2
15
Nov 11
vs BOS
L 123-101
29
4-12
33.3
1-6
16.7
2-2
100.0
8
5
0
0
2
1
11
Nov 9
@ CHI
W 127-121
33
8-16
50.0
2-5
40.0
4-5
80.0
5
5
0
1
1
3
22
Nov 7
@ CLE
L 119-95
32
3-12
25.0
0-4
0.0
2-2
100.0
7
3
1
2
2
6
8
Nov 5
@ DET
W 112-106
33
5-10
50.0
1-2
50.0
2-2
100.0
10
8
1
1
0
3
13
Nov 3
vs CHI
W 126-107
31
6-13
46.2
0-2
0.0
3-5
60.0
7
9
0
1
1
3
15
Oct 31
vs NY
W 98-93
34
8-15
53.3
2-6
33.3
2-3
66.7
9
8
1
1
2
2
20
Oct 29
@ IND
W 114-109
33
5-12
41.7
2-3
66.7
1-2
50.0
5
10
2
1
4
0
13
Oct 26
vs DET
L 106-93
33
8-15
53.3
0-3
0.0
2-6
33.3
2
5
0
2
1
3
18
Oct 23
vs CLE
W 114-106
33
5-14
35.7
1-4
25.0
6-7
85.7
10
5
1
3
3
5
17
Oct 21
@ NY
W 106-100
34
5-13
38.5
0-3
0.0
4-6
66.7
9
7
1
1
4
1
14
06 / 2026-27 HOME / AWAY, RESULTS, MONTHS AND OPPONENTS
Splits
split
Split
GP
MIN
FG
FG%
3PT
3P%
FT
FT%
OR
DR
REB
AST
BLK
STL
PF
TO
PTS
All Splits
11
32.5
5.6-12.7
44.3
0.8-3.6
22.5
3.0-4.2
71.7
0.5
6.7
7.2
6.9
0.7
1.2
2.1
2.6
15.1
Home
6
32.3
6.0-12.8
46.8
0.7-3.8
17.4
3.3-4.8
69.0
0.5
6.7
7.2
7.2
0.5
1.2
2.0
2.7
16.0
Road
5
32.8
5.2-12.6
41.3
1.0-3.4
29.4
2.6-3.4
76.5
0.4
6.8
7.2
6.6
1.0
1.2
2.2
2.6
14.0
vs. Division
3
32.3
5.7-13.3
42.5
1.0-5.0
20.0
2.7-3.7
72.7
1.0
7.7
8.7
6.7
0.7
0.7
2.7
1.3
15.0
vs. Conference
11
32.5
5.6-12.7
44.3
0.8-3.6
22.5
3.0-4.2
71.7
0.5
6.7
7.2
6.9
0.7
1.2
2.1
2.6
15.1
3+ Days Rest
2
33.5
5.0-10.5
47.6
0.0-2.5
0.0
4.5-6.0
75.0
0.5
7.5
8.0
9.0
1.0
0.5
3.5
1.5
14.5
Month
Split
GP
MIN
FG
FG%
3PT
3P%
FT
FT%
OR
DR
REB
AST
BLK
STL
PF
TO
PTS
October
5
33.4
6.2-13.8
44.9
1.0-3.8
26.3
3.0-4.8
62.5
0.6
6.4
7.0
7.0
1.0
1.6
2.8
2.2
16.4
November
6
31.8
5.2-11.8
43.7
0.7-3.5
19.0
3.0-3.7
81.8
0.3
7.0
7.3
6.8
0.5
0.8
1.5
3.0
14.0
Pre All-Star
11
32.5
5.6-12.7
44.3
0.8-3.6
22.5
3.0-4.2
71.7
0.5
6.7
7.2
6.9
0.7
1.2
2.1
2.6
15.1
Result
Split
GP
MIN
FG
FG%
3PT
3P%
FT
FT%
OR
DR
REB
AST
BLK
STL
PF
TO
PTS
Wins
8
33.0
5.9-12.6
46.5
1.0-3.4
29.6
3.4-4.5
75.0
0.4
7.4
7.8
7.9
0.9
1.1
2.3
2.4
16.1
Losses
3
31.3
5.0-13.0
38.5
0.3-4.3
7.7
2.0-3.3
60.0
0.7
5.0
5.7
4.3
0.3
1.3
1.7
3.3
12.3
Position
Split
GP
MIN
FG
FG%
3PT
3P%
FT
FT%
OR
DR
REB
AST
BLK
STL
PF
TO
PTS
As Starter
11
32.5
5.6-12.7
44.3
0.8-3.6
22.5
3.0-4.2
71.7
0.5
6.7
7.2
6.9
0.7
1.2
2.1
2.6
15.1
Day
Split
GP
MIN
FG
FG%
3PT
3P%
FT
FT%
OR
DR
REB
AST
BLK
STL
PF
TO
PTS
Monday
1
31.0
6.0-13.0
46.2
0.0-2.0
0.0
3.0-5.0
60.0
0.0
7.0
7.0
9.0
0.0
1.0
1.0
3.0
15.0
Tuesday
2
31.5
4.5-12.5
36.0
0.5-4.5
11.1
3.0-4.0
75.0
1.0
7.5
8.5
6.0
0.5
0.5
3.0
1.0
12.5
Wednesday
2
33.0
5.0-11.0
45.5
1.5-2.5
60.0
1.5-2.0
75.0
0.0
7.5
7.5
9.0
1.5
1.0
2.0
1.5
13.0
Thursday
1
33.0
5.0-14.0
35.7
1.0-4.0
25.0
6.0-7.0
85.7
1.0
9.0
10.0
5.0
1.0
3.0
3.0
5.0
17.0
Friday
2
33.0
5.5-13.5
40.7
1.0-5.0
20.0
2.0-2.5
80.0
1.0
7.0
8.0
5.5
1.0
1.5
2.0
4.0
14.0
Sunday
3
33.0
7.0-13.0
53.8
0.7-3.3
20.0
3.7-5.7
64.7
0.0
4.7
4.7
7.0
0.3
1.0
1.7
2.7
18.3
Opponent
Split
GP
MIN
FG
FG%
3PT
3P%
FT
FT%
OR
DR
REB
AST
BLK
STL
PF
TO
PTS
Boston Celtics
1
29.0
4.0-12.0
33.3
1.0-6.0
16.7
2.0-2.0
100.0
1.0
7.0
8.0
5.0
0.0
0.0
2.0
1.0
11.0
Chicago Bulls
2
32.0
7.0-14.5
48.3
1.0-3.5
28.6
3.5-5.0
70.0
0.0
6.0
6.0
7.0
0.0
1.0
1.0
3.0
18.5
Cleveland Cavaliers
2
32.5
4.0-13.0
30.8
0.5-4.0
12.5
4.0-4.5
88.9
1.0
7.5
8.5
4.0
1.0
2.5
2.5
5.5
12.5
Detroit Pistons
2
33.0
6.5-12.5
52.0
0.5-2.5
20.0
2.0-4.0
50.0
0.0
6.0
6.0
6.5
0.5
1.5
0.5
3.0
15.5
Indiana Pacers
2
33.0
5.0-10.0
50.0
1.0-2.5
40.0
3.0-4.0
75.0
0.0
6.0
6.0
10.5
1.5
0.5
3.5
1.0
14.0
New York Knicks
2
34.0
6.5-14.0
46.4
1.0-4.5
22.2
3.0-4.5
66.7
1.0
8.0
9.0
7.5
1.0
1.0
3.0
1.5
17.0
07 / SEASON-BY-SEASON HISTORY
Career statistics
Regular Season Averages
Season
Team
GP
GS
MIN
FG
FG%
3PT
3P%
FT
FT%
OR
DR
REB
AST
BLK
STL
PF
TO
PTS
2003-04
Cleveland Cavaliers
79
79
39.5
7.9-18.9
41.7
0.8-2.7
29.0
4.4-5.8
75.4
1.3
4.2
5.5
5.9
0.7
1.6
1.9
3.5
20.9
2004-05
Cleveland Cavaliers
80
80
42.4
9.9-21.1
47.2
1.4-3.9
35.1
6.0-8.0
75.0
1.4
6.0
7.4
7.2
0.7
2.2
1.8
3.3
27.2
2005-06
Cleveland Cavaliers
79
79
42.5
11.1-23.1
48.0
1.6-4.8
33.5
7.6-10.3
73.8
0.9
6.1
7.0
6.6
0.8
1.6
2.3
3.3
31.4
2006-07
Cleveland Cavaliers
78
78
40.9
9.9-20.8
47.6
1.3-4.0
31.9
6.3-9.0
69.8
1.1
5.7
6.7
6.0
0.7
1.6
2.2
3.2
27.3
2007-08
Cleveland Cavaliers
75
74
40.4
10.6-21.9
48.4
1.5-4.8
31.5
7.3-10.3
71.2
1.8
6.1
7.9
7.2
1.1
1.8
2.2
3.4
30.0
2008-09
Cleveland Cavaliers
81
81
37.7
9.7-19.9
48.9
1.6-4.7
34.4
7.3-9.4
78.0
1.3
6.3
7.6
7.2
1.1
1.7
1.7
3.0
28.4
2009-10
Cleveland Cavaliers
76
76
39.0
10.1-20.1
50.3
1.7-5.1
33.3
7.8-10.2
76.7
0.9
6.4
7.3
8.6
1.0
1.6
1.6
3.4
29.7
2010-11
Miami Heat
79
79
38.8
9.6-18.8
51.0
1.2-3.5
33.0
6.4-8.4
75.9
1.0
6.5
7.5
7.0
0.6
1.6
2.1
3.6
26.7
2011-12
Miami Heat
62
62
37.5
10.0-18.9
53.1
0.9-2.4
36.2
6.2-8.1
77.1
1.5
6.4
7.9
6.2
0.8
1.9
1.5
3.4
27.1
2012-13
Miami Heat
76
76
37.9
10.1-17.8
56.5
1.4-3.3
40.6
5.3-7.0
75.3
1.3
6.8
8.0
7.3
0.9
1.7
1.4
3.0
26.8
2013-14
Miami Heat
77
77
37.7
10.0-17.6
56.7
1.5-4.0
37.9
5.7-7.6
75.0
1.1
5.9
6.9
6.3
0.3
1.6
1.6
3.5
27.1
2014-15
Cleveland Cavaliers
69
69
36.1
9.0-18.5
48.8
1.7-4.9
35.4
5.4-7.7
71.0
0.7
5.3
6.0
7.4
0.7
1.6
2.0
3.9
25.3
2015-16
Cleveland Cavaliers
76
76
35.6
9.7-18.6
52.0
1.1-3.7
30.9
4.7-6.5
73.1
1.5
6.0
7.4
6.8
0.6
1.4
1.9
3.3
25.3
2016-17
Cleveland Cavaliers
74
74
37.8
9.9-18.2
54.8
1.7-4.6
36.3
4.8-7.2
67.4
1.3
7.3
8.6
8.7
0.6
1.2
1.8
4.1
26.4
2017-18
Cleveland Cavaliers
82
82
36.9
10.5-19.3
54.2
1.8-5.0
36.7
4.7-6.5
73.1
1.2
7.5
8.6
9.1
0.9
1.4
1.7
4.2
27.5
2018-19
Los Angeles Lakers
55
55
35.2
10.1-19.9
51.0
2.0-5.9
33.9
5.1-7.6
66.5
1.0
7.4
8.5
8.3
0.6
1.3
1.7
3.6
27.4
2019-20
Los Angeles Lakers
67
67
34.6
9.6-19.4
49.3
2.2-6.3
34.8
3.9-5.7
69.3
1.0
6.9
7.8
10.2
0.5
1.2
1.8
3.9
25.3
2020-21
Los Angeles Lakers
45
45
33.4
9.4-18.3
51.3
2.3-6.3
36.5
4.0-5.7
69.8
0.6
7.0
7.7
7.8
0.6
1.1
1.6
3.7
25.0
2021-22
Los Angeles Lakers
56
56
37.2
11.4-21.8
52.4
2.9-8.0
35.9
4.5-6.0
75.6
1.1
7.1
8.2
6.2
1.1
1.3
2.2
3.5
30.3
2022-23
Los Angeles Lakers
55
54
35.5
11.1-22.2
50.0
2.2-6.9
32.1
4.6-5.9
76.8
1.2
7.1
8.3
6.8
0.6
0.9
1.6
3.2
28.9
2023-24
Los Angeles Lakers
71
71
35.3
9.6-17.9
54.0
2.1-5.1
41.0
4.3-5.7
75.0
0.9
6.4
7.3
8.3
0.5
1.3
1.1
3.5
25.7
2024-25
Los Angeles Lakers
70
70
34.9
9.3-18.1
51.3
2.1-5.7
37.6
3.7-4.7
78.2
1.0
6.8
7.8
8.2
0.6
1.0
1.4
3.7
24.4
2025-26
Los Angeles Lakers
60
60
33.2
7.9-15.3
51.5
1.3-4.1
31.7
3.9-5.3
73.7
0.7
5.4
6.1
7.2
0.6
1.2
1.4
3.0
20.9
2026-27
Philadelphia 76ers
11
11
32.5
5.6-12.7
44.3
0.8-3.6
22.5
3.0-4.2
71.7
0.5
6.7
7.2
6.9
0.7
1.2
2.1
2.6
15.1
Career
—
1633
1631
37.6
9.8-19.4
50.6
1.6-4.7
34.8
5.5-7.4
73.7
1.1
6.3
7.5
7.4
0.7
1.5
1.8
3.5
26.7
Regular Season Totals
Season
Team
FG
FG%
3PT
3P%
FT
FT%
OR
DR
REB
AST
BLK
STL
PF
TO
PTS
2003-04
Cleveland Cavaliers
622-1492
41.7
63-217
29.0
347-460
75.4
99
333
432
465
58
130
149
273
1654
2004-05
Cleveland Cavaliers
795-1684
47.2
108-308
35.1
477-636
75.0
111
477
588
577
52
177
146
262
2175
2005-06
Cleveland Cavaliers
875-1823
48.0
127-379
33.5
601-814
73.8
75
481
556
521
66
123
181
260
2478
2006-07
Cleveland Cavaliers
772-1621
47.6
99-310
31.9
489-701
69.8
83
443
526
470
55
125
171
250
2132
2007-08
Cleveland Cavaliers
794-1642
48.4
113-359
31.5
549-771
71.2
133
459
592
539
81
138
165
255
2250
2008-09
Cleveland Cavaliers
789-1613
48.9
132-384
34.4
594-762
78.0
106
507
613
587
93
137
139
241
2304
2009-10
Cleveland Cavaliers
768-1528
50.3
129-387
33.3
593-773
76.7
71
483
554
651
77
125
119
261
2258
2010-11
Miami Heat
758-1485
51.0
92-279
33.0
503-663
75.9
80
510
590
554
50
124
163
284
2111
2011-12
Miami Heat
621-1169
53.1
54-149
36.2
387-502
77.1
94
398
492
387
50
115
96
213
1683
2012-13
Miami Heat
765-1354
56.5
103-254
40.6
403-535
75.3
97
513
610
551
67
129
110
226
2036
2013-14
Miami Heat
767-1353
56.7
116-306
37.9
439-585
75.0
81
452
533
488
26
121
126
270
2089
2014-15
Cleveland Cavaliers
624-1279
48.8
120-339
35.4
375-528
71.0
51
365
416
511
49
109
135
272
1743
2015-16
Cleveland Cavaliers
737-1416
52.0
87-282
30.9
359-491
73.1
111
454
565
514
49
104
143
249
1920
2016-17
Cleveland Cavaliers
736-1344
54.8
124-342
36.3
358-531
67.4
97
542
639
646
44
92
134
303
1954
2017-18
Cleveland Cavaliers
857-1580
54.2
149-406
36.7
388-531
73.1
97
612
709
747
71
116
136
347
2251
2018-19
Los Angeles Lakers
558-1095
51.0
111-327
33.9
278-418
66.5
57
408
465
454
33
72
94
197
1505
2019-20
Los Angeles Lakers
643-1303
49.3
148-425
34.8
264-381
69.3
66
459
525
684
36
78
118
261
1698
2020-21
Los Angeles Lakers
422-823
51.3
104-285
36.5
178-255
69.8
29
317
346
350
25
48
70
168
1126
2021-22
Los Angeles Lakers
640-1221
52.4
161-448
35.9
254-336
75.6
63
396
459
349
59
73
121
196
1695
2022-23
Los Angeles Lakers
609-1219
50.0
121-377
32.1
251-327
76.8
65
392
457
375
32
50
88
178
1590
2023-24
Los Angeles Lakers
685-1269
54.0
149-363
41.0
303-404
75.0
61
457
518
589
38
89
78
245
1822
2024-25
Los Angeles Lakers
651-1270
51.3
149-396
37.6
259-331
78.2
72
474
546
575
39
70
99
260
1710
2025-26
Los Angeles Lakers
473-919
51.5
77-243
31.7
233-316
73.7
43
321
364
432
35
72
81
179
1256
2026-27
Philadelphia 76ers
62-140
44.3
9-40
22.5
33-46
71.7
5
74
79
76
8
13
23
29
166
Career
—
16023-31642
50.6
2645-7605
34.8
8915-12097
73.7
1847
10327
12174
12092
1193
2430
2885
5679
43606
Regular Season Misc Totals
Season
Team
DD2
TD3
DQ
EJECT
TECH
FLAG
AST/TO
STL/TO
SC-EFF
SH-EFF
2003-04
Cleveland Cavaliers
12
0
0
0
2
0
1.7
0.5
1.109
0.44
2004-05
Cleveland Cavaliers
25
4
1
0
4
0
2.2
0.7
1.292
0.50
2005-06
Cleveland Cavaliers
21
5
0
0
0
0
2.0
0.5
1.359
0.51
2006-07
Cleveland Cavaliers
16
1
1
0
2
2
1.9
0.5
1.315
0.51
2007-08
Cleveland Cavaliers
31
7
1
0
2
0
2.1
0.5
1.370
0.52
2008-09
Cleveland Cavaliers
29
7
0
0
10
0
2.4
0.6
1.428
0.53
2009-10
Cleveland Cavaliers
31
4
0
0
4
0
2.5
0.5
1.478
0.54
2010-11
Miami Heat
31
4
0
0
7
0
2.0
0.4
1.422
0.54
2011-12
Miami Heat
23
0
0
0
3
0
1.8
0.5
1.440
0.55
2012-13
Miami Heat
36
4
0
0
6
1
2.4
0.6
1.504
0.60
2013-14
Miami Heat
12
1
1
0
5
1
1.8
0.4
1.544
0.61
2014-15
Cleveland Cavaliers
22
2
0
0
5
1
1.9
0.4
1.363
0.53
2015-16
Cleveland Cavaliers
28
3
0
0
4
0
2.1
0.4
1.356
0.55
2016-17
Cleveland Cavaliers
42
13
2
0
4
0
2.1
0.3
1.454
0.59
2017-18
Cleveland Cavaliers
52
18
0
1
5
0
2.2
0.3
1.425
0.59
2018-19
Los Angeles Lakers
32
8
0
0
0
0
2.3
0.4
1.374
0.56
2019-20
Los Angeles Lakers
46
13
0
0
2
0
2.6
0.3
1.303
0.55
2020-21
Los Angeles Lakers
18
5
0
0
2
1
2.1
0.3
1.368
0.58
2021-22
Los Angeles Lakers
21
6
0
1
1
2
1.8
0.4
1.388
0.59
2022-23
Los Angeles Lakers
18
2
0
0
1
0
2.1
0.3
1.304
0.55
2023-24
Los Angeles Lakers
27
5
0
0
4
1
2.4
0.4
1.436
0.60
2024-25
Los Angeles Lakers
32
10
0
0
1
0
2.2
0.3
1.346
0.57
2025-26
Los Angeles Lakers
17
3
0
0
1
1
2.4
0.4
1.367
0.56
2026-27
Philadelphia 76ers
4
0
0
0
1
0
2.6
0.4
1.186
0.48
Career
—
626
125
6
2
76
10
2.1
0.4
1.378
0.55
Scoring, rebounding and assist trend
08 / SHOT CHART AND ZONE SHOOTING
Shot profile
Shot-location data is not connected. Add a BALLDONTLIE GOAT-tier NBA API key in NBA Players → Settings to enable shot charts and zone shooting.
LATEST UPDATEJames (back) has been ruled out for Monday's game against the Nets.
As expected, James won't play in the second half of Philly's back-to-back set after finishing Sunday's 131-124 victory over Indiana with 15 points (5-8 FG, 0-2 3Pt, 5-6 FT), seven rebounds, 11 assists and one block across 33 minutes. The veteran superstar has yet to play in both halves of a back-to-back set this season, and that trend is unlikely to change. Dean Wade and Jabari Walker are candidates for increased roles in James' absence.




 Adem BonaC #30
 Anfernee SimonsG #5
 Ariel HukportiC #55
 Caleb LoveG #8
 Cris CarrollF
 Dean WadeF #45
 Dillon JonesF #35
 Dominick BarlowF #25
 Duke MilesG #31
 Jabari WalkerF #33
 Jameer Nelson Jr.G #14
 Jaylen BrownG #7
 Joel EmbiidC #21
 Justin EdwardsF #11
 Kentavious Caldwell-PopeG #1
 Kyle LowryG #7
 Labaron Philon Jr.G #00
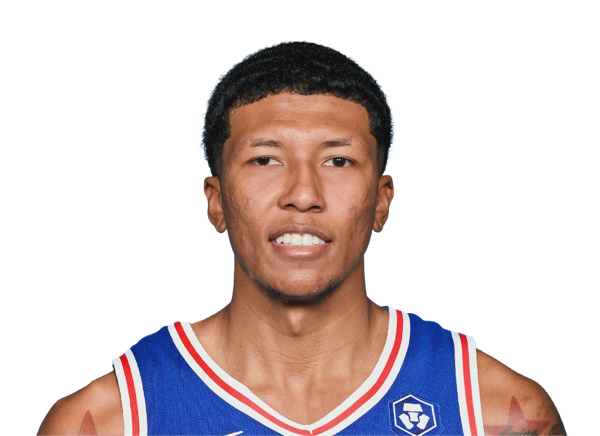 MarJon BeauchampF #16
 Rayan RupertG #12
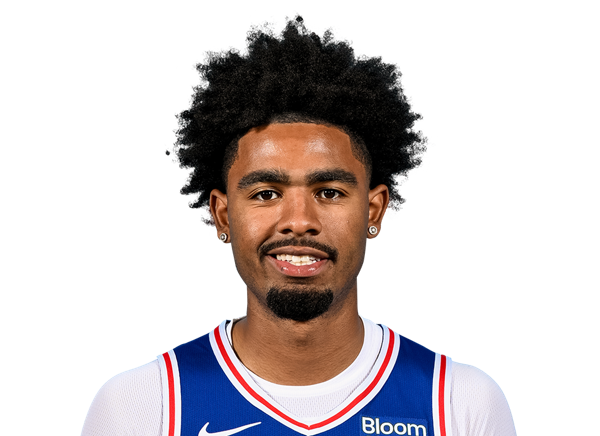 Saint ThomasF #19
 Tacko FallC #99
 Taye FieldsG
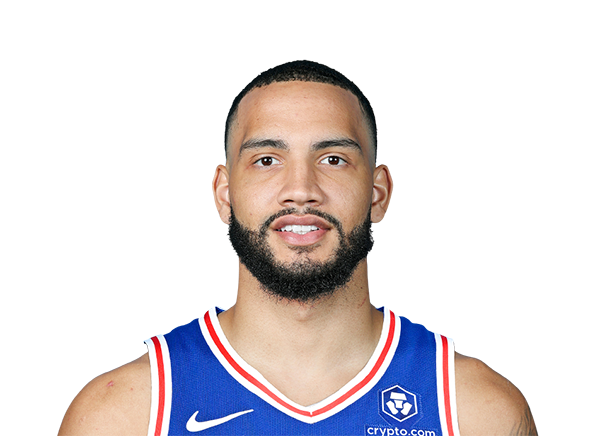 Tyrese MartinG #23
 Tyrese MaxeyG
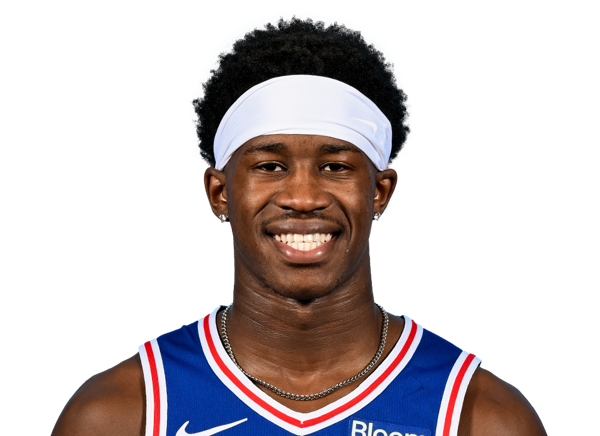 VJ EdgecombeG #77