

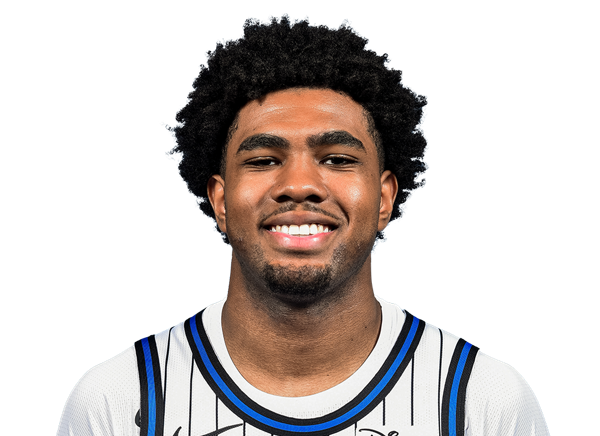
BALLERSCULTURE PLAYER PROFILE · 2026-27
Jase Richardson
Orlando Magic · G • #11 • 6' 1" 180 lbs

01 / 2026-27 PER-GAME AVERAGES
Season snapshot
PTS5.9
REB1.9
AST2.5
STL0.7
BLK0.6
TO0.8
MIN21.7
FG%32.1
3P%22.2
FT%87.5
GP11
GS7
FG2.3-7.1
3PT0.7-3.3
FT0.6-0.7
OR0.6
Per-game averages, regular season 2026-27 (Orlando Magic).
02 / EVERY SEASON SINCE 2022-23, SIDE BY SIDE
2022-23 to 2026-27
Per game
| Season | Team | GP | GS | MIN | PTS | REB | AST | STL | BLK | TO | FG% | 3P% | FT% |
|---|---|---|---|---|---|---|---|---|---|---|---|---|---|
| 2022-23 | — | — | — | — | — | — | — | — | — | — | — | — | — |
| 2023-24 | — | — | — | — | — | — | — | — | — | — | — | — | — |
| 2024-25 | — | — | — | — | — | — | — | — | — | — | — | — | — |
| 2025-26 | Orlando Magic | 54 | 0 | 10.9 | 4.4 | 1.2 | 1.1 | 0.4 | 0.0 | 0.5 | 47.3 | 35.4 | 71.7 |
| 2026-27 | Orlando Magic | 11 | 7 | 21.7 | 5.9 | 1.9 | 2.5 | 0.7 | 0.6 | 0.8 | 32.1 | 22.2 | 87.5 |
Season totals
| Season | Team | GP | GS | MIN | PTS | REB | AST | STL | BLK | TO | FG% | 3P% | FT% |
|---|---|---|---|---|---|---|---|---|---|---|---|---|---|
| 2022-23 | — | — | — | — | — | — | — | — | — | — | — | — | — |
| 2023-24 | — | — | — | — | — | — | — | — | — | — | — | — | — |
| 2024-25 | — | — | — | — | — | — | — | — | — | — | — | — | — |
| 2025-26 | Orlando Magic | — | — | — | 239 | 63 | 58 | 19 | 2 | 25 | 47.3 | 35.4 | 71.7 |
| 2026-27 | Orlando Magic | — | — | — | 65 | 21 | 27 | 8 | 7 | 9 | 32.1 | 22.2 | 87.5 |
Click a season to open this player’s full game log, splits and advanced stats for that year; click a team to open its page. A dash means no NBA games were recorded.
03 / EVERY CATEGORY THE PROVIDER REPORTS
Full statistical breakdown
Regular season 2026-27
Defensive
| Metric | Total | NBA rank |
|---|---|---|
| Blocks | 7 | Tied-96th |
| Defensive Rebounds | 14 | Tied-287th |
| Steals | 8 | Tied-169th |
| Defensive Rebound Rate | 0.0 | — |
| Defensive Rebounds Per Game | 1.3 | Tied-247th |
| Blocks Per Game | 0.6 | Tied-93rd |
| Steals Per Game | 0.7 | 155th |
| Defensive Rebounds Per 48 | 2.8 | 4,592nd |
| Blocks Per 48 | 1.4 | 1,536th |
| Steals Per 48 | 1.6 | 2,704th |
General
| Metric | Total | NBA rank |
|---|---|---|
| Disqualifications | 0 | Tied-21st |
| Flagrant Fouls | 0 | Tied-22nd |
| Fouls | 23 | Tied-176th |
| Player Efficiency Rating | 6.72 | 273rd |
| Rebound Rate | 0.0 | — |
| Ejections | 0 | Tied-7th |
| Technical Fouls | 0 | Tied-101st |
| Rebounds | 21 | — |
| Value Over Replacement Player | -14.6 | — |
| Minutes | 239 | Tied-3rd |
| Minutes Per Game | 21.7 | — |
| Rating | 11.2 | Tied-93rd |
| Plus-Minus | -28 | Tied-1st |
| Rebounds Per Game | 1.9 | Tied-248th |
| Fouls Per Game | 2.1 | Tied-149th |
| Flagrant Fouls Per Game | 0.0 | Tied-19th |
| Technical Fouls Per Game | 0.0 | Tied-82nd |
| Ejections Per Game | 0.0 | Tied-6th |
| Disqualifications Per Game | 0.0 | Tied-20th |
| Assist To Turnover Ratio | 3.0 | — |
| Steal To Foul Ratio | 0.3 | — |
| Block To Foul Ratio | 0.3 | — |
| Team Rebounds Per Game | 0.0 | — |
| Rebounds | 21 | — |
| Total Technical Fouls | 0 | — |
| Assist To Turnover Ratio | 0.0 | — |
| Steal To Turnover Ratio | 0.9 | — |
| Rebounds Per 48 Minutes | 4.2 | — |
| Fouls Per 48 Minutes | 4.6 | 2,816th |
| Flagrant Fouls Per 48 Minutes | 0.0 | 352nd |
| Technical Fouls Per 48 Minutes | 0.0 | 1,616th |
| Ejections Per 48 Minutes | 0.0 | 112th |
| Disqualifications Per 48 Minutes | 0.0 | 336th |
| R/40 | 3.5 | — |
| Games Played | 11 | 11th |
| Games Started | 7 | Tied-142nd |
| Double Double | 0 | Tied-119th |
| Triple Double | 0 | Tied-12th |
Offensive
| Metric | Total | NBA rank |
|---|---|---|
| Assists | 27 | Tied-134th |
| Effective Field Goal Percentage | 37.2 | — |
| Field Goals | 25/78 | — |
| Field Goals Attempted | 78 | Tied-181st |
| Field Goals Made | 25 | Tied-236th |
| Field Goal Percentage | 32.1 | — |
| Free Throws | 7/8 | — |
| Free Throw Percentage | 87.5 | Tied-53rd |
| Free Throws Attempted | 8 | Tied-278th |
| Free Throws Made | 7 | Tied-260th |
| Offensive Rebounds | 7 | Tied-230th |
| Points | 65 | Tied-251st |
| Turnovers | 9 | Tied-227th |
| 3-Point Field Goal Percentage | 22.2 | 251st |
| 3-Point Field Goals Attempted | 36 | Tied-188th |
| 3-Point Field Goals Made | 8 | Tied-229th |
| True Shooting Percentage | 39.9 | — |
| Total Turnovers | 9 | — |
| Assist Ratio | 23.0 | — |
| Points in the Paint | 0 | Tied-1st |
| Offensive Rebound Rate | 0.0 | — |
| Turnover Ratio | 7.7 | — |
| Brick Index | 0.00 | — |
| Usage Rate | 0.0 | — |
| Average Field Goals Made | 2.3 | — |
| Average Field Goals Attempted | 7.1 | 287th |
| Average 3-Point Field Goals Made | 0.7 | — |
| Average 3-Point Field Goals Attempted | 3.3 | Tied-162nd |
| Average Free Throws Made | 0.6 | — |
| Average Free Throws Attempted | 0.7 | 237th |
| Points Per Game | 5.9 | Tied-228th |
| Offensive Rebounds Per Game | 0.6 | Tied-204th |
| Assists Per Game | 2.5 | Tied-116th |
| Turnovers Per Game | 0.8 | 209th |
| Offensive Rebound Percentage | 0.1 | — |
| Estimated Possessions | 83.2 | — |
| Estimated Possessions Per Game | 7.6 | — |
| Points Per Estimated Possession | 0.8 | — |
| Team Turnovers Per Game | 0.0 | — |
| Total Turnovers Per Game | 0.8 | — |
| 3-Point Field Goal Percentage | 22.2 | — |
| 2-Point Field Goals Made | 17.0 | Tied-7th |
| 2-Point Field Goals Attempted | 42.0 | 7th |
| 2-Point Field Goals Made per Game | 1.5 | — |
| 2-Point Field Goals Attempted per Game | 3.8 | — |
| 2-Point Field Goal Percentage | 40.5 | Tied-1st |
| Shooting Efficiency | 0.37 | — |
| Scoring Efficiency | 0.833 | — |
| Fieldgoals Made Per 48 | 5.0 | 3,776th |
| Fieldgoals Attempted Per 48 | 15.7 | 2,896th |
| 3-Point Fieldgoals Made Per 48 | 1.6 | 3,664th |
| 3-Point Fieldgoals Attempted Per 48 | 7.2 | 3,008th |
| Freethrows Made Per 48 | 1.4 | 4,160th |
| Freethrows Attempted Per 48 | 1.6 | 4,448th |
| Points Scored Per 48 | 13.1 | 4,016th |
| Offensive Rebounds Per 48 | 1.4 | 3,680th |
| Assists Per 48 | 5.4 | 2,144th |
| Turnovers | 1.8 | 3,632nd |
| P/40 | 10.9 | — |
| A/40 | 4.5 | — |
04 / EFFICIENCY, SHOOTING PROFILE, PER-36
Advanced metrics
True shooting %39.8%
Effective FG %37.3%
2-point FG %42.1%
3-point attempt rate46.5%
Free throw rate9.9%
Points per shot attempt0.83
% of points from 3s35.6%
Assist-to-turnover3.13
Points per 36 min9.8
Rebounds per 36 min3.2
Assists per 36 min4.1
Steals per 36 min1.16
Blocks per 36 min1.00
Turnovers per 36 min1.33
Stocks (STL + BLK) per game1.30
Pts + Reb + Ast per game10.3
Efficiency (EFF) per game5.9
Game Score per game (Hollinger)3.9
Minutes per game21.7
Calculated by BallersCulture from the supplied 2026-27 box-score totals using standard formulas (hover a tile to see the formula). Tracking-based metrics such as BPM, VORP, on/off and RAPTOR are not available from this data source.
05 / 11 GAMES IN 2026-27
Game log: Regular season
| Date | Opp | Result | MIN | FG | FG% | 3PT | 3P% | FT | FT% | REB | AST | BLK | STL | PF | TO | PTS |
|---|---|---|---|---|---|---|---|---|---|---|---|---|---|---|---|---|
| Nov 12 | @ UTAH | W 123-108 | 20 | 2-8 | 25.0 | 1-6 | 16.7 | 1-1 | 100.0 | 1 | 2 | 2 | 1 | 4 | 1 | 6 |
| Nov 11 | @ SAC | W 107-100 | 15 | 2-4 | 50.0 | 0-1 | 0.0 | 2-2 | 100.0 | 1 | 1 | 0 | 1 | 3 | 0 | 6 |
| Nov 8 | @ GS | L 126-119 OT | 30 | 1-13 | 7.7 | 0-6 | 0.0 | 0-0 | 0.0 | 4 | 4 | 0 | 0 | 2 | 1 | 2 |
| Nov 6 | @ PHX | L 117-104 | 26 | 4-9 | 44.4 | 2-4 | 50.0 | 0-0 | 0.0 | 2 | 3 | 2 | 2 | 1 | 3 | 10 |
| Nov 3 | vs WSH | L 103-94 | 29 | 3-8 | 37.5 | 0-4 | 0.0 | 3-3 | 100.0 | 1 | 5 | 0 | 1 | 3 | 0 | 9 |
| Nov 2 | vs BOS | L 108-97 | 26 | 2-8 | 25.0 | 0-4 | 0.0 | 0-0 | 0.0 | 1 | 3 | 0 | 0 | 2 | 0 | 4 |
| Oct 31 | @ TOR | W 121-114 | 33 | 2-5 | 40.0 | 0-1 | 0.0 | 0-0 | 0.0 | 6 | 2 | 1 | 2 | 0 | 1 | 4 |
| Oct 29 | @ TOR | L 129-99 | 14 | 4-8 | 50.0 | 2-3 | 66.7 | 0-0 | 0.0 | 1 | 1 | 0 | 0 | 5 | 0 | 10 |
| Oct 26 | @ NY | W 111-102 | 17 | 2-7 | 28.6 | 2-5 | 40.0 | 0-0 | 0.0 | 1 | 0 | 0 | 0 | 1 | 1 | 6 |
| Oct 24 | vs MIN | L 115-93 | 14 | 2-5 | 40.0 | 1-1 | 100.0 | 1-2 | 50.0 | 1 | 3 | 0 | 0 | 0 | 0 | 6 |
| Oct 22 | vs ATL | L 132-125 | 14 | 1-3 | 33.3 | 0-1 | 0.0 | 0-0 | 0.0 | 2 | 3 | 2 | 1 | 2 | 2 | 2 |
06 / 2026-27 HOME / AWAY, RESULTS, MONTHS AND OPPONENTS
Splits
split
| Split | GP | MIN | FG | FG% | 3PT | 3P% | FT | FT% | OR | DR | REB | AST | BLK | STL | PF | TO | PTS |
|---|---|---|---|---|---|---|---|---|---|---|---|---|---|---|---|---|---|
| All Splits | 11 | 21.7 | 2.3-7.1 | 32.1 | 0.7-3.3 | 22.2 | 0.6-0.7 | 87.5 | 0.6 | 1.3 | 1.9 | 2.5 | 0.6 | 0.7 | 2.1 | 0.8 | 5.9 |
| Home | 4 | 21.0 | 2.0-6.0 | 33.3 | 0.3-2.5 | 10.0 | 1.0-1.3 | 80.0 | 0.0 | 1.3 | 1.3 | 3.5 | 0.5 | 0.5 | 1.8 | 0.5 | 5.3 |
| Road | 7 | 22.1 | 2.4-7.7 | 31.5 | 1.0-3.7 | 26.9 | 0.4-0.4 | 100.0 | 1.0 | 1.3 | 2.3 | 1.9 | 0.7 | 0.9 | 2.3 | 1.0 | 6.3 |
| vs. Division | 2 | 21.5 | 2.0-5.5 | 36.4 | 0.0-2.5 | 0.0 | 1.5-1.5 | 100.0 | 0.0 | 1.5 | 1.5 | 4.0 | 1.0 | 1.0 | 2.5 | 1.0 | 5.5 |
| vs. Conference | 6 | 22.3 | 2.3-6.5 | 35.9 | 0.7-3.0 | 22.2 | 0.5-0.5 | 100.0 | 0.5 | 1.5 | 2.0 | 2.3 | 0.5 | 0.7 | 2.2 | 0.7 | 5.8 |
| 3+ Days Rest | 1 | 14.0 | 1.0-3.0 | 33.3 | 0.0-1.0 | 0.0 | 0.0-0.0 | 0.0 | 0.0 | 2.0 | 2.0 | 3.0 | 2.0 | 1.0 | 2.0 | 2.0 | 2.0 |
Month
| Split | GP | MIN | FG | FG% | 3PT | 3P% | FT | FT% | OR | DR | REB | AST | BLK | STL | PF | TO | PTS |
|---|---|---|---|---|---|---|---|---|---|---|---|---|---|---|---|---|---|
| October | 5 | 18.6 | 2.2-5.6 | 39.3 | 1.0-2.2 | 45.5 | 0.2-0.4 | 50.0 | 0.6 | 1.6 | 2.2 | 1.8 | 0.6 | 0.6 | 1.6 | 0.8 | 5.6 |
| November | 6 | 24.3 | 2.3-8.3 | 28.0 | 0.5-4.2 | 12.0 | 1.0-1.0 | 100.0 | 0.7 | 1.0 | 1.7 | 3.0 | 0.7 | 0.8 | 2.5 | 0.8 | 6.2 |
| Pre All-Star | 11 | 21.7 | 2.3-7.1 | 32.1 | 0.7-3.3 | 22.2 | 0.6-0.7 | 87.5 | 0.6 | 1.3 | 1.9 | 2.5 | 0.6 | 0.7 | 2.1 | 0.8 | 5.9 |
Result
| Split | GP | MIN | FG | FG% | 3PT | 3P% | FT | FT% | OR | DR | REB | AST | BLK | STL | PF | TO | PTS |
|---|---|---|---|---|---|---|---|---|---|---|---|---|---|---|---|---|---|
| Wins | 4 | 21.3 | 2.0-6.0 | 33.3 | 0.8-3.3 | 23.1 | 0.8-0.8 | 100.0 | 0.8 | 1.5 | 2.3 | 1.3 | 0.8 | 1.0 | 2.0 | 0.8 | 5.5 |
| Losses | 7 | 22.0 | 2.4-7.7 | 31.5 | 0.7-3.3 | 21.7 | 0.6-0.7 | 80.0 | 0.6 | 1.1 | 1.7 | 3.1 | 0.6 | 0.6 | 2.1 | 0.9 | 6.1 |
Position
| Split | GP | MIN | FG | FG% | 3PT | 3P% | FT | FT% | OR | DR | REB | AST | BLK | STL | PF | TO | PTS |
|---|---|---|---|---|---|---|---|---|---|---|---|---|---|---|---|---|---|
| As Starter | 7 | 25.1 | 2.6-8.3 | 31.0 | 0.9-3.9 | 22.2 | 0.4-0.4 | 100.0 | 1.0 | 1.3 | 2.3 | 2.6 | 0.4 | 0.7 | 2.0 | 0.9 | 6.4 |
Day
| Split | GP | MIN | FG | FG% | 3PT | 3P% | FT | FT% | OR | DR | REB | AST | BLK | STL | PF | TO | PTS |
|---|---|---|---|---|---|---|---|---|---|---|---|---|---|---|---|---|---|
| Monday | 1 | 29.0 | 3.0-8.0 | 37.5 | 0.0-4.0 | 0.0 | 3.0-3.0 | 100.0 | 0.0 | 1.0 | 1.0 | 5.0 | 0.0 | 1.0 | 3.0 | 0.0 | 9.0 |
| Tuesday | 1 | 15.0 | 2.0-4.0 | 50.0 | 0.0-1.0 | 0.0 | 2.0-2.0 | 100.0 | 0.0 | 1.0 | 1.0 | 1.0 | 0.0 | 1.0 | 3.0 | 0.0 | 6.0 |
| Wednesday | 3 | 16.3 | 2.3-6.3 | 36.8 | 1.0-3.3 | 30.0 | 0.3-0.3 | 100.0 | 0.0 | 1.3 | 1.3 | 2.0 | 1.3 | 0.7 | 3.7 | 1.0 | 6.0 |
| Thursday | 1 | 26.0 | 4.0-9.0 | 44.4 | 2.0-4.0 | 50.0 | 0.0-0.0 | 0.0 | 1.0 | 1.0 | 2.0 | 3.0 | 2.0 | 2.0 | 1.0 | 3.0 | 10.0 |
| Friday | 2 | 23.5 | 2.0-5.0 | 40.0 | 0.5-1.0 | 50.0 | 0.5-1.0 | 50.0 | 1.5 | 2.0 | 3.5 | 2.5 | 0.5 | 1.0 | 0.0 | 0.5 | 5.0 |
| Saturday | 1 | 30.0 | 1.0-13.0 | 7.7 | 0.0-6.0 | 0.0 | 0.0-0.0 | 0.0 | 3.0 | 1.0 | 4.0 | 4.0 | 0.0 | 0.0 | 2.0 | 1.0 | 2.0 |
| Sunday | 2 | 22.0 | 2.0-7.5 | 26.7 | 1.0-4.5 | 22.2 | 0.0-0.0 | 0.0 | 0.0 | 1.0 | 1.0 | 1.5 | 0.0 | 0.0 | 1.5 | 0.5 | 5.0 |
Opponent
| Split | GP | MIN | FG | FG% | 3PT | 3P% | FT | FT% | OR | DR | REB | AST | BLK | STL | PF | TO | PTS |
|---|---|---|---|---|---|---|---|---|---|---|---|---|---|---|---|---|---|
| Atlanta Hawks | 1 | 14.0 | 1.0-3.0 | 33.3 | 0.0-1.0 | 0.0 | 0.0-0.0 | 0.0 | 0.0 | 2.0 | 2.0 | 3.0 | 2.0 | 1.0 | 2.0 | 2.0 | 2.0 |
| Boston Celtics | 1 | 26.0 | 2.0-8.0 | 25.0 | 0.0-4.0 | 0.0 | 0.0-0.0 | 0.0 | 0.0 | 1.0 | 1.0 | 3.0 | 0.0 | 0.0 | 2.0 | 0.0 | 4.0 |
| Golden State Warriors | 1 | 30.0 | 1.0-13.0 | 7.7 | 0.0-6.0 | 0.0 | 0.0-0.0 | 0.0 | 3.0 | 1.0 | 4.0 | 4.0 | 0.0 | 0.0 | 2.0 | 1.0 | 2.0 |
| Minnesota Timberwolves | 1 | 14.0 | 2.0-5.0 | 40.0 | 1.0-1.0 | 100.0 | 1.0-2.0 | 50.0 | 0.0 | 1.0 | 1.0 | 3.0 | 0.0 | 0.0 | 0.0 | 0.0 | 6.0 |
| New York Knicks | 1 | 17.0 | 2.0-7.0 | 28.6 | 2.0-5.0 | 40.0 | 0.0-0.0 | 0.0 | 0.0 | 1.0 | 1.0 | 0.0 | 0.0 | 0.0 | 1.0 | 1.0 | 6.0 |
| Phoenix Suns | 1 | 26.0 | 4.0-9.0 | 44.4 | 2.0-4.0 | 50.0 | 0.0-0.0 | 0.0 | 1.0 | 1.0 | 2.0 | 3.0 | 2.0 | 2.0 | 1.0 | 3.0 | 10.0 |
| Sacramento Kings | 1 | 15.0 | 2.0-4.0 | 50.0 | 0.0-1.0 | 0.0 | 2.0-2.0 | 100.0 | 0.0 | 1.0 | 1.0 | 1.0 | 0.0 | 1.0 | 3.0 | 0.0 | 6.0 |
| Toronto Raptors | 2 | 23.5 | 3.0-6.5 | 46.2 | 1.0-2.0 | 50.0 | 0.0-0.0 | 0.0 | 1.5 | 2.0 | 3.5 | 1.5 | 0.5 | 1.0 | 2.5 | 0.5 | 7.0 |
| Utah Jazz | 1 | 20.0 | 2.0-8.0 | 25.0 | 1.0-6.0 | 16.7 | 1.0-1.0 | 100.0 | 0.0 | 1.0 | 1.0 | 2.0 | 2.0 | 1.0 | 4.0 | 1.0 | 6.0 |
| Washington Wizards | 1 | 29.0 | 3.0-8.0 | 37.5 | 0.0-4.0 | 0.0 | 3.0-3.0 | 100.0 | 0.0 | 1.0 | 1.0 | 5.0 | 0.0 | 1.0 | 3.0 | 0.0 | 9.0 |
07 / SEASON-BY-SEASON HISTORY
Career statistics
Regular Season Averages
| Season | Team | GP | GS | MIN | FG | FG% | 3PT | 3P% | FT | FT% | OR | DR | REB | AST | BLK | STL | PF | TO | PTS |
|---|---|---|---|---|---|---|---|---|---|---|---|---|---|---|---|---|---|---|---|
| 2025-26 | Orlando Magic | 54 | 0 | 10.9 | 1.6-3.5 | 47.3 | 0.5-1.5 | 35.4 | 0.6-0.9 | 71.7 | 0.4 | 0.8 | 1.2 | 1.1 | 0.0 | 0.4 | 1.0 | 0.5 | 4.4 |
| 2026-27 | Orlando Magic | 11 | 7 | 21.7 | 2.3-7.1 | 32.1 | 0.7-3.3 | 22.2 | 0.6-0.7 | 87.5 | 0.6 | 1.3 | 1.9 | 2.5 | 0.6 | 0.7 | 2.1 | 0.8 | 5.9 |
| Career | — | 65 | 7 | 12.7 | 1.8-4.1 | 42.9 | 0.6-1.8 | 31.3 | 0.6-0.8 | 74.1 | 0.4 | 0.9 | 1.3 | 1.3 | 0.1 | 0.4 | 1.2 | 0.5 | 4.7 |
Regular Season Totals
| Season | Team | FG | FG% | 3PT | 3P% | FT | FT% | OR | DR | REB | AST | BLK | STL | PF | TO | PTS |
|---|---|---|---|---|---|---|---|---|---|---|---|---|---|---|---|---|
| 2025-26 | Orlando Magic | 89-188 | 47.3 | 28-79 | 35.4 | 33-46 | 71.7 | 21 | 42 | 63 | 58 | 2 | 19 | 53 | 25 | 239 |
| 2026-27 | Orlando Magic | 25-78 | 32.1 | 8-36 | 22.2 | 7-8 | 87.5 | 7 | 14 | 21 | 27 | 7 | 8 | 23 | 9 | 65 |
| Career | — | 114-266 | 42.9 | 36-115 | 31.3 | 40-54 | 74.1 | 28 | 56 | 84 | 85 | 9 | 27 | 76 | 34 | 304 |
Regular Season Misc Totals
| Season | Team | DD2 | TD3 | DQ | EJECT | TECH | FLAG | AST/TO | STL/TO | SC-EFF | SH-EFF |
|---|---|---|---|---|---|---|---|---|---|---|---|
| 2025-26 | Orlando Magic | 0 | 0 | 0 | 0 | 0 | 0 | 2.3 | 0.8 | 1.271 | 0.55 |
| 2026-27 | Orlando Magic | 0 | 0 | 0 | 0 | 0 | 0 | 3.0 | 0.9 | 0.833 | 0.37 |
| Career | — | 0 | 0 | 0 | 0 | 0 | 0 | 2.5 | 0.8 | 1.143 | 0.50 |
Scoring, rebounding and assist trend
08 / SHOT CHART AND ZONE SHOOTING
Shot profile
Shot-location data is not connected. Add a BALLDONTLIE GOAT-tier NBA API key in NBA Players → Settings to enable shot charts and zone shooting.
09 / RECORD, TEAM STATS AND TEAMMATES
Team
Overall5-7
Home1-4
Road4-3
DIV0-2
CONF3-4
Last Ten Games5-5
Team records for 2026-27 (regular season).
Team statistics 2026-27
Defensive
| Metric | Total | Per game | NBA rank |
|---|---|---|---|
| Blocks | 49 | 4.083 | 15th |
| Defensive Rebounds | 383 | 31.917 | 12th |
| Steals | 89 | 7.417 | 15th |
| Points Conceded Off Turnovers | 0 | 18 | — |
| Defensive Rebound Rate | 0.0 | — | — |
| Defensive Rebounds Per Game | 31.9 | — | — |
| Blocks Per Game | 4.1 | — | — |
| Steals Per Game | 7.4 | — | — |
| Defensive Rebounds Per 48 | 0.0 | — | — |
| Blocks Per 48 | 0.0 | — | — |
| Steals Per 48 | 0.0 | — | — |
General
| Metric | Total | Per game | NBA rank |
|---|---|---|---|
| Disqualifications | 4 | — | Tied-2nd |
| Flagrant Fouls | 2 | 0.167 | Tied-2nd |
| Fouls | 274 | 22.833 | Tied-11th |
| Rebound Rate | 50.8 | — | 7th |
| Ejections | 0 | — | — |
| Technical Fouls | 18 | 0.75 | 6th |
| Rebounds | 515 | 42.917 | — |
| Minutes | 0 | — | — |
| Minutes Per Game | 0.0 | — | — |
| Fantasy Rating | 0.0 | — | — |
| Rating | 197.5 | — | — |
| Plus-Minus | -1 | -1 | Tied-1st |
| Game Day of Year | 0 | — | — |
| Rebounds Per Game | 42.9 | — | — |
| Fouls Per Game | 22.8 | — | — |
| Flagrant Fouls Per Game | 0.2 | — | — |
| Technical Fouls Per Game | 1.5 | — | — |
| Ejections Per Game | 0.0 | — | — |
| Disqualifications Per Game | 0.3 | — | — |
| Assist To Turnover Ratio | 1.6 | 1.625 | — |
| Steal To Foul Ratio | 0.3 | 0.325 | — |
| Block To Foul Ratio | 0.2 | 0.179 | — |
| Team Rebounds Per Game | 0.0 | — | — |
| Rebounds | 515 | 42.917 | — |
| Total Technical Fouls | 18 | 0.75 | — |
| Assist To Turnover Ratio | 34.7 | — | — |
| Team Rebounds | 0 | — | — |
| Steal To Turnover Ratio | 0.5 | 0.464 | — |
| Rebounds Per 48 Minutes | 0.0 | — | — |
| Fouls Per 48 Minutes | 0.0 | — | — |
| Flagrant Fouls Per 48 Minutes | 0.0 | — | — |
| Technical Fouls Per 48 Minutes | 0.0 | — | — |
| Ejections Per 48 Minutes | 0.0 | — | — |
| Disqualifications Per 48 Minutes | 0.0 | — | — |
| Games Played | 12 | — | Tied-12th |
| Games Started | 0 | — | — |
| Double Double | 0 | — | — |
| Triple Double | 0 | — | — |
Offensive
| Metric | Total | Per game | NBA rank |
|---|---|---|---|
| Assists | 312 | 26 | 13th |
| Effective Field Goal Percentage | 52.8 | — | 7th |
| Field Goals | 461/1030 | 0.448 | — |
| Field Goals Attempted | 1030 | 85.833 | 14th |
| Field Goals Made | 461 | 38.417 | 13th |
| Field Goal Percentage | 44.8 | 0.448 | 10th |
| Free Throws | 212/271 | 0.782 | — |
| Free Throw Percentage | 78.2 | 0.782 | 6th |
| Free Throws Attempted | 271 | 22.583 | 14th |
| Free Throws Made | 212 | 17.667 | 14th |
| Offensive Rebounds | 132 | 11 | 15th |
| Points | 1300 | 108.333 | 14th |
| Turnovers | 192 | 16 | 8th |
| 3-Point Field Goal Percentage | 33.7 | 0.337 | 10th |
| 3-Point Field Goals Attempted | 493 | 41.083 | 9th |
| 3-Point Field Goals Made | 166 | 13.833 | Tied-10th |
| True Shooting Percentage | 56.6 | — | 8th |
| Team Turnovers | 9 | — | Tied-7th |
| Total Turnovers | 201 | 16 | — |
| Assist Ratio | 18.8 | — | 10th |
| Points in the Paint | 538 | 44 | 11th |
| Offensive Rebound Rate | 26.0 | — | 10th |
| Turnover Ratio | 14.9 | — | 3rd |
| Fast Break Points | 142 | — | — |
| Possessions | 1218 | — | 15th |
| Pace Factor | 100.7 | — | 7th |
| Average Field Goals Made | 38.4 | — | — |
| Average Field Goals Attempted | 85.8 | — | — |
| Average 3-Point Field Goals Made | 13.8 | — | — |
| Average 3-Point Field Goals Attempted | 41.1 | — | — |
| Average Free Throws Made | 17.7 | — | — |
| Average Free Throws Attempted | 22.6 | — | — |
| Points Per Game | 108.3 | — | — |
| Offensive Rebounds Per Game | 11.0 | — | — |
| Assists Per Game | 26.0 | — | — |
| Turnovers Per Game | 16.0 | — | — |
| Offensive Rebound Percentage | 0.2 | 0.232 | — |
| Estimated Possessions | 1207.4 | 99.866 | — |
| Estimated Possessions Per Game | 100.6 | — | — |
| Points Per Estimated Possession | 1.1 | 1.085 | — |
| Team Turnovers Per Game | 0.8 | — | — |
| Total Turnovers Per Game | 16.8 | — | — |
| 3-Point Field Goal Percentage | 33.7 | 0.337 | Tied-1st |
| 2-Point Field Goals Made | 295.0 | 24.584 | 23rd |
| 2-Point Field Goals Attempted | 537.0 | 44.75 | 5th |
| 2-Point Field Goals Made per Game | 24.6 | — | — |
| 2-Point Field Goals Attempted per Game | 44.8 | — | — |
| 2-Point Field Goal Percentage | 54.9 | 0.549 | 4th |
| Shooting Efficiency | 0.53 | 0.528 | — |
| Scoring Efficiency | 1.262 | 1.262 | — |
| Fieldgoals Made Per 48 | 0.0 | — | — |
| Fieldgoals Attempted Per 48 | 0.0 | — | — |
| 3-Point Fieldgoals Made Per 48 | 0.0 | — | — |
| 3-Point Fieldgoals Attempted Per 48 | 0.0 | — | — |
| Freethrows Made Per 48 | 0.0 | — | — |
| Freethrows Attempted Per 48 | 0.0 | — | — |
| Points Scored Per 48 | 0.0 | — | — |
| Offensive Rebounds Per 48 | 0.0 | — | — |
| Assists Per 48 | 0.0 | — | — |
| Turnovers | 0.0 | — | — |
Teammates
 Alex MoralesG #30
 Anthony BlackG
 Colin CastletonC #14
 Desmond BaneG #3
 Franz WagnerF #22
 Goga BitadzeC #35
 Izaiyah NelsonF #25
 Jalen SuggsG #4
 Jamal CainF #8
 Jarron CumberlandG #34
 JD DavisonG #20
 Jevon CarterG #2
 Jonathan IsaacF #1
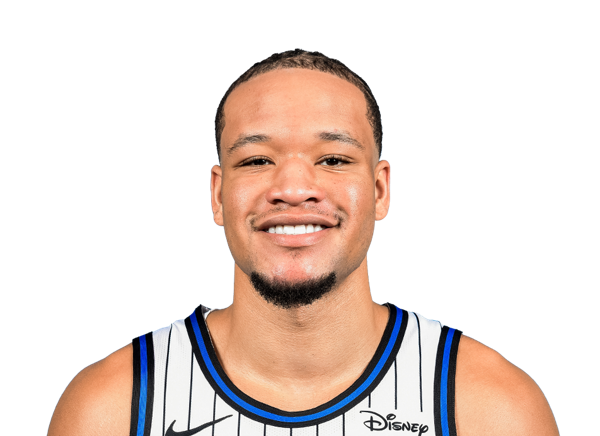 Kevin Knox IIF #24
 Malaki BranhamF #12
 Mike SharavjamtsG
 Nikola VucevicC #9
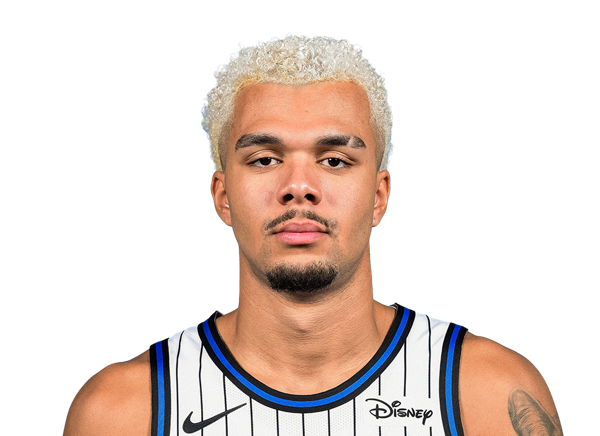 Noah PendaF #93
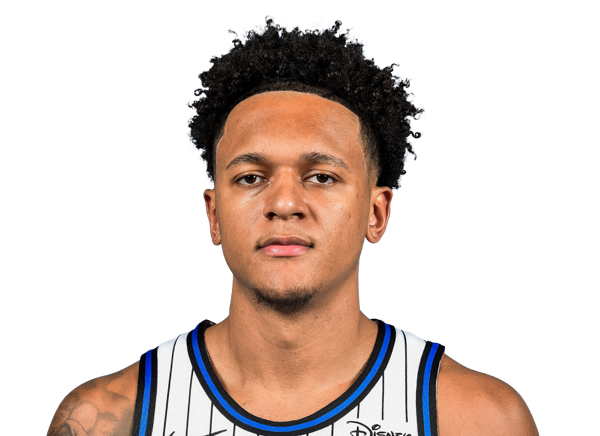 Paolo BancheroF #5
 Tristan da SilvaF #23
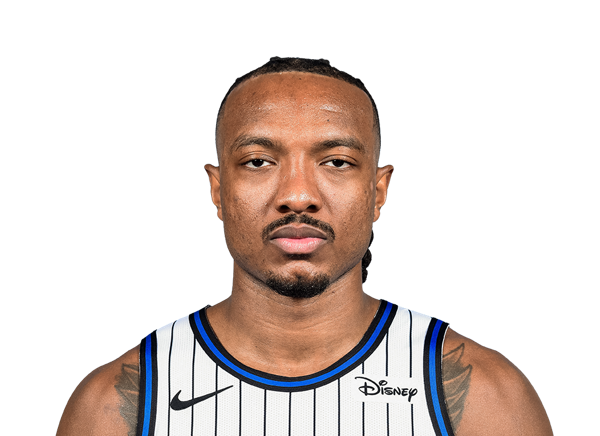 Wendell Carter Jr.C #34
10 / SALARY BY SEASON
Contract
| Season | Salary |
|---|---|
| 2025-26 | $2.98M |
| 2026-27 | $3.13M |
Total listed: $6.12M · source: espn.
11 / LATEST REPORT
Injury status
No current injury report entry for this player.
12 / SIGNINGS, TRADES AND ROSTER MOVES
Transactions
No recorded transactions for this player.
13 / LATEST COVERAGE
Player news
LATEST UPDATERichardson will come off the bench in Tuesday's game against the Kings.
Jamal Cain will replace Richardson in the first unit for Tuesday's game. As a reserve this season, Richardson is averaging 4.0 points and 3.0 assists in 14.3 minutes per game.
2 November 2026Boston Celtics vs. Orlando Magic: Game Highlights↗
26 October 2026Orlando Magic vs. New York Knicks: Game Highlights↗
1 October 2026Fantasy basketball: Players to know and position battles to watch during NBA preseason↗
16 July 2026Richardson scores 25 as Magic hold off 76ers' rally↗
16 July 2026Orlando Magic vs. Philadelphia 76ers: Game Highlights↗
16 July 2026Jase Richardson gets up for the beautiful slam dunk↗
12 July 2026Miami Heat vs. Orlando Magic: Game Highlights↗
10 July 20262026 NBA summer league: Players to watch on all 30 teams↗
14 / BIO, DRAFT AND CONTACT DETAILS
Biography & profile
TeamOrlando Magic
PositionGuard
Jersey11
Height6' 1"
Weight180 lbs
Age21
Date of birthOct 16, 2005
BirthplaceDenver, CO, USA
CollegeMichigan State
Experience2 yrs
StatusActive