Click a season to open this player’s full game log, splits and advanced stats for that year; click a team to open its page. A dash means no NBA games were recorded.
03 / EVERY CATEGORY THE PROVIDER REPORTS
Full statistical breakdown
Regular season 2026-27
Defensive
Metric
Total
NBA rank
Blocks
10
Tied-52nd
Defensive Rebounds
79
17th
Steals
12
Tied-89th
Defensive Rebound Rate
0.0
—
Defensive Rebounds Per Game
6.6
18th
Blocks Per Game
0.8
Tied-55th
Steals Per Game
1.0
81st
Defensive Rebounds Per 48
9.7
Tied-816th
Blocks Per 48
1.2
2,496th
Steals Per 48
1.5
4,272nd
General
Metric
Total
NBA rank
Disqualifications
1
Tied-4th
Flagrant Fouls
0
Tied-22nd
Fouls
42
Tied-15th
Player Efficiency Rating
16.37
113th
Rebound Rate
0.0
—
Ejections
0
Tied-7th
Technical Fouls
2
Tied-12th
Rebounds
112
—
Value Over Replacement Player
33.8
—
Minutes
392
Tied-1st
Minutes Per Game
32.7
—
Rating
28.1
Tied-42nd
Plus-Minus
-24
Tied-1st
Rebounds Per Game
9.3
14th
Fouls Per Game
3.5
Tied-8th
Flagrant Fouls Per Game
0.0
Tied-19th
Technical Fouls Per Game
0.2
Tied-19th
Ejections Per Game
0.0
Tied-6th
Disqualifications Per Game
0.1
Tied-9th
Assist To Turnover Ratio
0.6
—
Steal To Foul Ratio
0.3
—
Block To Foul Ratio
0.2
—
Team Rebounds Per Game
0.0
—
Rebounds
112
—
Total Technical Fouls
2
—
Assist To Turnover Ratio
0.0
—
Steal To Turnover Ratio
0.6
—
Rebounds Per 48 Minutes
13.7
—
Fouls Per 48 Minutes
5.1
720th
Flagrant Fouls Per 48 Minutes
0.0
1,056th
Technical Fouls Per 48 Minutes
0.2
576th
Ejections Per 48 Minutes
0.0
336th
Disqualifications Per 48 Minutes
0.1
192nd
R/40
11.4
—
Games Played
12
12th
Games Started
12
Tied-52nd
Double Double
2
Tied-39th
Triple Double
0
Tied-12th
Offensive
Metric
Total
NBA rank
Assists
13
Tied-253rd
Effective Field Goal Percentage
66.7
—
Field Goals
58/96
—
Field Goals Attempted
96
Tied-151st
Field Goals Made
58
Tied-90th
Field Goal Percentage
60.4
5th
Free Throws
34/45
—
Free Throw Percentage
75.6
165th
Free Throws Attempted
45
Tied-58th
Free Throws Made
34
Tied-61st
Offensive Rebounds
33
Tied-21st
Points
162
92nd
Turnovers
21
Tied-95th
3-Point Field Goal Percentage
40.0
Tied-76th
3-Point Field Goals Attempted
30
Tied-213th
3-Point Field Goals Made
12
Tied-181st
True Shooting Percentage
69.9
—
Total Turnovers
21
—
Assist Ratio
8.7
—
Points in the Paint
0
Tied-1st
Offensive Rebound Rate
0.0
—
Turnover Ratio
14.0
—
Brick Index
0.00
—
Usage Rate
0.0
—
Average Field Goals Made
4.8
90th
Average Field Goals Attempted
8.0
Tied-311th
Average 3-Point Field Goals Made
1.0
Tied-172nd
Average 3-Point Field Goals Attempted
2.5
Tied-196th
Average Free Throws Made
2.8
67th
Average Free Throws Attempted
3.8
Tied-58th
Points Per Game
13.5
Tied-90th
Offensive Rebounds Per Game
2.8
16th
Assists Per Game
1.1
Tied-226th
Turnovers Per Game
1.8
92nd
Offensive Rebound Percentage
0.9
—
Estimated Possessions
102.0
—
Estimated Possessions Per Game
8.5
—
Points Per Estimated Possession
1.6
—
Team Turnovers Per Game
0.0
—
Total Turnovers Per Game
1.8
—
3-Point Field Goal Percentage
40.0
—
2-Point Field Goals Made
46.0
91st
2-Point Field Goals Attempted
66.0
62nd
2-Point Field Goals Made per Game
3.8
—
2-Point Field Goals Attempted per Game
5.5
—
2-Point Field Goal Percentage
69.7
5th
Shooting Efficiency
0.67
—
Scoring Efficiency
1.688
—
Fieldgoals Made Per 48
7.1
4,320th
Fieldgoals Attempted Per 48
11.8
7,248th
3-Point Fieldgoals Made Per 48
1.5
8,688th
3-Point Fieldgoals Attempted Per 48
3.7
10,224th
Freethrows Made Per 48
4.2
2,928th
Freethrows Attempted Per 48
5.5
2,784th
Points Scored Per 48
19.8
Tied-4,416th
Offensive Rebounds Per 48
4.0
1,008th
Assists Per 48
1.6
12,144th
Turnovers
2.6
4,560th
P/40
16.5
—
A/40
1.3
—
04 / EFFICIENCY, SHOOTING PROFILE, PER-36
Advanced metrics
True shooting %69.8%
Effective FG %66.3%
2-point FG %69.1%
3-point attempt rate31.3%
Free throw rate47.5%
Points per shot attempt1.69
% of points from 3s22.2%
Assist-to-turnover0.61
Points per 36 min14.9
Rebounds per 36 min10.2
Assists per 36 min1.2
Steals per 36 min1.10
Blocks per 36 min0.88
Turnovers per 36 min1.98
Stocks (STL + BLK) per game1.80
Pts + Reb + Ast per game23.9
Efficiency (EFF) per game19.7
Game Score per game (Hollinger)12.5
Minutes per game32.7
Calculated by BallersCulture from the supplied 2026-27 box-score totals using standard formulas (hover a tile to see the formula). Tracking-based metrics such as BPM, VORP, on/off and RAPTOR are not available from this data source.
05 / 12 GAMES IN 2026-27
Game log: Regular season
Date
Opp
Result
MIN
FG
FG%
3PT
3P%
FT
FT%
REB
AST
BLK
STL
PF
TO
PTS
Nov 14
vs MIL
W 107-99
30
5-9
55.6
1-4
25.0
1-1
100.0
8
0
1
1
3
2
12
Nov 12
@ UTAH
W 123-108
28
3-5
60.0
0-1
0.0
3-3
100.0
7
3
0
0
5
2
9
Nov 11
@ SAC
W 107-100
33
4-9
44.4
0-2
0.0
0-0
0.0
11
1
3
1
4
0
8
Nov 8
@ GS
L 126-119 OT
40
6-12
50.0
3-3
100.0
4-9
44.4
11
0
2
0
6
2
19
Nov 6
@ PHX
L 117-104
34
10-12
83.3
2-2
100.0
5-6
83.3
13
2
1
1
3
3
27
Nov 3
vs WSH
L 103-94
34
2-3
66.7
0-0
0.0
2-2
100.0
9
0
0
1
2
1
6
Nov 2
vs BOS
L 108-97
35
2-6
33.3
1-5
20.0
2-4
50.0
10
0
0
2
3
3
7
Oct 31
@ TOR
W 121-114
39
6-11
54.5
1-3
33.3
7-8
87.5
7
1
0
2
2
2
20
Oct 29
@ TOR
L 129-99
26
1-4
25.0
0-2
0.0
1-2
50.0
10
3
0
1
2
2
3
Oct 26
@ NY
W 111-102
33
3-6
50.0
0-1
0.0
3-4
75.0
10
2
1
1
4
2
9
Oct 24
vs MIN
L 115-93
29
8-9
88.9
3-4
75.0
1-1
100.0
9
1
2
0
4
2
20
Oct 22
vs ATL
L 132-125
31
8-10
80.0
1-3
33.3
5-5
100.0
7
0
0
2
4
0
22
06 / 2026-27 HOME / AWAY, RESULTS, MONTHS AND OPPONENTS
Splits
split
Split
GP
MIN
FG
FG%
3PT
3P%
FT
FT%
OR
DR
REB
AST
BLK
STL
PF
TO
PTS
All Splits
12
32.7
4.8-8.0
60.4
1.0-2.5
40.0
2.8-3.8
75.6
2.8
6.6
9.3
1.1
0.8
1.0
3.5
1.8
13.5
Home
5
31.8
5.0-7.4
67.6
1.2-3.2
37.5
2.2-2.6
84.6
2.2
6.4
8.6
0.2
0.6
1.2
3.2
1.6
13.4
Road
7
33.3
4.7-8.4
55.9
0.9-2.0
42.9
3.3-4.6
71.9
3.1
6.7
9.9
1.7
1.0
0.9
3.7
1.9
13.6
vs. Division
2
32.5
5.0-6.5
76.9
0.5-1.5
33.3
3.5-3.5
100.0
2.0
6.0
8.0
0.0
0.0
1.5
3.0
0.5
14.0
vs. Conference
7
32.7
3.9-7.0
55.1
0.6-2.6
22.2
3.0-3.7
80.8
2.3
6.4
8.7
0.9
0.3
1.4
2.9
1.7
11.3
3+ Days Rest
1
31.0
8.0-10.0
80.0
1.0-3.0
33.3
5.0-5.0
100.0
2.0
5.0
7.0
0.0
0.0
2.0
4.0
0.0
22.0
Month
Split
GP
MIN
FG
FG%
3PT
3P%
FT
FT%
OR
DR
REB
AST
BLK
STL
PF
TO
PTS
October
5
31.6
5.2-8.0
65.0
1.0-2.6
38.5
3.4-4.0
85.0
2.2
6.4
8.6
1.4
0.6
1.2
3.2
1.6
14.8
November
7
33.4
4.6-8.0
57.1
1.0-2.4
41.2
2.4-3.6
68.0
3.1
6.7
9.9
0.9
1.0
0.9
3.7
1.9
12.6
Pre All-Star
12
32.7
4.8-8.0
60.4
1.0-2.5
40.0
2.8-3.8
75.6
2.8
6.6
9.3
1.1
0.8
1.0
3.5
1.8
13.5
Result
Split
GP
MIN
FG
FG%
3PT
3P%
FT
FT%
OR
DR
REB
AST
BLK
STL
PF
TO
PTS
Wins
5
32.6
4.2-8.0
52.5
0.4-2.2
18.2
2.8-3.2
87.5
2.2
6.4
8.6
1.4
1.0
1.0
3.6
1.6
11.6
Losses
7
32.7
5.3-8.0
66.1
1.4-2.7
52.6
2.9-4.1
69.0
3.1
6.7
9.9
0.9
0.7
1.0
3.4
1.9
14.9
Position
Split
GP
MIN
FG
FG%
3PT
3P%
FT
FT%
OR
DR
REB
AST
BLK
STL
PF
TO
PTS
As Starter
12
32.7
4.8-8.0
60.4
1.0-2.5
40.0
2.8-3.8
75.6
2.8
6.6
9.3
1.1
0.8
1.0
3.5
1.8
13.5
Day
Split
GP
MIN
FG
FG%
3PT
3P%
FT
FT%
OR
DR
REB
AST
BLK
STL
PF
TO
PTS
Monday
1
34.0
2.0-3.0
66.7
0.0-0.0
0.0
2.0-2.0
100.0
2.0
7.0
9.0
0.0
0.0
1.0
2.0
1.0
6.0
Tuesday
1
33.0
4.0-9.0
44.4
0.0-2.0
0.0
0.0-0.0
0.0
3.0
8.0
11.0
1.0
3.0
1.0
4.0
0.0
8.0
Wednesday
3
28.3
4.0-6.3
63.2
0.3-2.0
16.7
3.0-3.3
90.0
2.7
5.3
8.0
2.0
0.0
1.0
3.7
1.3
11.3
Thursday
1
34.0
10.0-12.0
83.3
2.0-2.0
100.0
5.0-6.0
83.3
4.0
9.0
13.0
2.0
1.0
1.0
3.0
3.0
27.0
Friday
3
32.7
6.3-9.7
65.5
1.7-3.7
45.5
3.0-3.3
90.0
2.3
5.7
8.0
0.7
1.0
1.0
3.0
2.0
17.3
Saturday
1
40.0
6.0-12.0
50.0
3.0-3.0
100.0
4.0-9.0
44.4
6.0
5.0
11.0
0.0
2.0
0.0
6.0
2.0
19.0
Sunday
2
34.0
2.5-6.0
41.7
0.5-3.0
16.7
2.5-4.0
62.5
1.5
8.5
10.0
1.0
0.5
1.5
3.5
2.5
8.0
Opponent
Split
GP
MIN
FG
FG%
3PT
3P%
FT
FT%
OR
DR
REB
AST
BLK
STL
PF
TO
PTS
Atlanta Hawks
1
31.0
8.0-10.0
80.0
1.0-3.0
33.3
5.0-5.0
100.0
2.0
5.0
7.0
0.0
0.0
2.0
4.0
0.0
22.0
Boston Celtics
1
35.0
2.0-6.0
33.3
1.0-5.0
20.0
2.0-4.0
50.0
2.0
8.0
10.0
0.0
0.0
2.0
3.0
3.0
7.0
Golden State Warriors
1
40.0
6.0-12.0
50.0
3.0-3.0
100.0
4.0-9.0
44.4
6.0
5.0
11.0
0.0
2.0
0.0
6.0
2.0
19.0
Milwaukee Bucks
1
30.0
5.0-9.0
55.6
1.0-4.0
25.0
1.0-1.0
100.0
3.0
5.0
8.0
0.0
1.0
1.0
3.0
2.0
12.0
Minnesota Timberwolves
1
29.0
8.0-9.0
88.9
3.0-4.0
75.0
1.0-1.0
100.0
2.0
7.0
9.0
1.0
2.0
0.0
4.0
2.0
20.0
New York Knicks
1
33.0
3.0-6.0
50.0
0.0-1.0
0.0
3.0-4.0
75.0
1.0
9.0
10.0
2.0
1.0
1.0
4.0
2.0
9.0
Phoenix Suns
1
34.0
10.0-12.0
83.3
2.0-2.0
100.0
5.0-6.0
83.3
4.0
9.0
13.0
2.0
1.0
1.0
3.0
3.0
27.0
Sacramento Kings
1
33.0
4.0-9.0
44.4
0.0-2.0
0.0
0.0-0.0
0.0
3.0
8.0
11.0
1.0
3.0
1.0
4.0
0.0
8.0
Toronto Raptors
2
33.0
3.5-7.5
46.7
0.5-2.5
20.0
4.0-5.0
80.0
3.0
5.5
8.5
2.0
0.0
1.5
2.0
2.0
11.5
Utah Jazz
1
28.0
3.0-5.0
60.0
0.0-1.0
0.0
3.0-3.0
100.0
2.0
5.0
7.0
3.0
0.0
0.0
5.0
2.0
9.0
Washington Wizards
1
34.0
2.0-3.0
66.7
0.0-0.0
0.0
2.0-2.0
100.0
2.0
7.0
9.0
0.0
0.0
1.0
2.0
1.0
6.0
07 / SEASON-BY-SEASON HISTORY
Career statistics
Regular Season Averages
Season
Team
GP
GS
MIN
FG
FG%
3PT
3P%
FT
FT%
OR
DR
REB
AST
BLK
STL
PF
TO
PTS
2018-19
Chicago Bulls
44
44
25.2
4.1-8.4
48.5
0.1-0.7
18.8
2.0-2.5
79.5
2.0
5.0
7.0
1.8
1.3
0.6
3.5
1.5
10.3
2019-20
Chicago Bulls
43
43
29.2
4.3-8.0
53.4
0.1-0.7
20.7
2.6-3.5
73.7
3.2
6.2
9.4
1.2
0.8
0.8
3.8
1.7
11.3
2020-21
Chicago Bulls
32
25
24.8
4.0-7.9
51.2
0.3-0.7
36.4
2.6-3.5
73.9
2.2
5.6
7.8
2.2
0.8
0.6
3.0
1.5
10.9
2020-21
Orlando Magic
22
19
26.5
4.6-9.3
49.3
0.3-1.3
24.1
2.2-3.1
72.1
2.8
6.0
8.8
1.6
0.8
0.8
2.3
1.3
11.7
2020-21
2020 21 Totals
54
44
25.5
4.3-8.5
50.3
0.3-0.9
29.4
2.4-3.3
73.2
2.4
5.8
8.2
1.9
0.8
0.6
2.7
1.4
11.2
2021-22
Orlando Magic
62
61
29.9
5.8-11.0
52.5
1.1-3.5
32.7
2.3-3.3
69.1
2.2
8.2
10.5
2.8
0.7
0.6
2.7
1.9
15.0
2022-23
Orlando Magic
57
54
29.6
5.6-10.8
52.5
1.4-3.9
35.6
2.5-3.4
73.8
2.1
6.6
8.7
2.3
0.6
0.5
2.8
1.9
15.2
2023-24
Orlando Magic
55
48
25.6
4.1-7.7
52.5
1.2-3.1
37.4
1.7-2.4
69.4
2.0
4.9
6.9
1.7
0.5
0.6
2.2
1.2
11.0
2024-25
Orlando Magic
68
51
25.9
3.3-7.2
46.0
0.5-2.3
23.4
1.9-2.6
73.7
2.2
5.0
7.2
2.0
0.6
0.8
2.9
1.1
9.1
2025-26
Orlando Magic
78
78
29.3
4.2-8.2
51.2
0.9-2.9
31.9
2.5-3.2
79.2
2.1
5.3
7.4
2.0
0.6
0.8
3.4
1.3
11.8
2026-27
Orlando Magic
12
12
32.7
4.8-8.0
60.4
1.0-2.5
40.0
2.8-3.8
75.6
2.8
6.6
9.3
1.1
0.8
1.0
3.5
1.8
13.5
Career
—
473
435
27.8
4.5-8.7
51.2
0.8-2.4
31.9
2.3-3.1
74.1
2.3
5.9
8.2
2.0
0.7
0.7
3.0
1.5
11.9
Regular Season Totals
Season
Team
FG
FG%
3PT
3P%
FT
FT%
OR
DR
REB
AST
BLK
STL
PF
TO
PTS
2018-19
Chicago Bulls
180-371
48.5
6-32
18.8
89-112
79.5
87
220
307
78
58
26
152
65
455
2019-20
Chicago Bulls
183-343
53.4
6-29
20.7
112-152
73.7
139
266
405
51
36
33
162
72
484
2020-21
Chicago Bulls
129-252
51.2
8-22
36.4
82-111
73.9
70
180
250
69
24
18
96
49
348
2020-21
Orlando Magic
101-205
49.3
7-29
24.1
49-68
72.1
62
131
193
35
18
17
50
29
258
2020-21
2020 21 Totals
230-457
50.3
15-51
29.4
131-179
73.2
132
311
443
104
42
35
146
78
606
2021-22
Orlando Magic
359-684
52.5
70-214
32.7
143-207
69.1
139
509
648
171
43
36
169
117
931
2022-23
Orlando Magic
322-613
52.5
80-225
35.6
144-195
73.8
120
377
497
132
33
30
159
106
868
2023-24
Orlando Magic
223-425
52.5
64-171
37.4
93-134
69.4
112
269
381
95
28
35
121
68
603
2024-25
Orlando Magic
226-491
46.0
37-158
23.4
129-175
73.7
151
341
492
134
41
52
199
77
618
2025-26
Orlando Magic
326-637
51.2
72-226
31.9
198-250
79.2
162
415
577
154
49
60
267
100
922
2026-27
Orlando Magic
58-96
60.4
12-30
40.0
34-45
75.6
33
79
112
13
10
12
42
21
162
Career
—
2107-4117
51.2
362-1136
31.9
1073-1449
74.1
1075
2787
3862
932
340
319
1417
704
5649
Regular Season Misc Totals
Season
Team
DD2
TD3
DQ
EJECT
TECH
FLAG
AST/TO
STL/TO
SC-EFF
SH-EFF
2018-19
Chicago Bulls
7
0
4
0
3
0
1.2
0.4
1.226
0.49
2019-20
Chicago Bulls
17
0
5
0
2
2
0.7
0.5
1.411
0.54
2020-21
Chicago Bulls
7
0
0
0
2
1
1.4
0.4
1.381
0.53
2020-21
Orlando Magic
6
0
0
0
1
0
1.2
0.6
1.259
0.51
2020-21
2020 21 Totals
13
0
0
0
3
1
1.3
0.4
1.326
0.52
2021-22
Orlando Magic
33
0
3
1
7
0
1.5
0.3
1.361
0.58
2022-23
Orlando Magic
21
0
4
0
4
0
1.2
0.3
1.416
0.59
2023-24
Orlando Magic
9
0
0
0
4
1
1.4
0.5
1.419
0.60
2024-25
Orlando Magic
10
0
0
1
8
0
1.7
0.7
1.259
0.50
2025-26
Orlando Magic
12
0
2
0
5
0
1.5
0.6
1.447
0.57
2026-27
Orlando Magic
2
0
1
0
2
0
0.6
0.6
1.688
0.67
Career
—
124
0
19
2
38
4
1.3
0.5
1.372
0.56
Scoring, rebounding and assist trend
08 / SHOT CHART AND ZONE SHOOTING
Shot profile
Shot-location data is not connected. Add a BALLDONTLIE GOAT-tier NBA API key in NBA Players → Settings to enable shot charts and zone shooting.
LATEST UPDATECarter ended with eight points (4-9 FG, 0-2 3Pt), 11 rebounds, one assist, three blocks and one steal in 33 minutes during Tuesday's 107-100 win over the Kings.
Carter didn't do much on offense, but he did the dirty work in the middle, controlling the boards and protecting the rim. He's been a steady frontcourt presence with Paolo Banchero (ankle) sidelined, and Carter's interior play helps the Magic win even when it doesn't show in the scoring column.




 Alex MoralesG #30
 Anthony BlackG
 Colin CastletonC #14
 Desmond BaneG #3
 Franz WagnerF #22
 Goga BitadzeC #35
 Izaiyah NelsonF #25
 Jalen SuggsG #4
 Jamal CainF #8
 Jarron CumberlandG #34
 Jase RichardsonG #11
 JD DavisonG #20
 Jevon CarterG #2
 Jonathan IsaacF #1
 Kevin Knox IIF #24
 Malaki BranhamF #12
 Mike SharavjamtsG
 Nikola VucevicC #9
 Noah PendaF #93
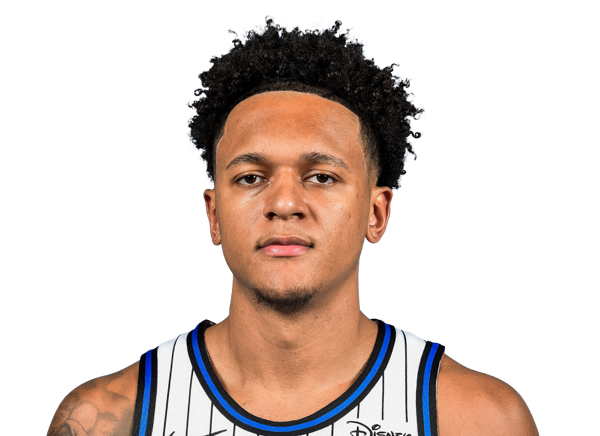 Paolo BancheroF #5
 Tristan da SilvaF #23