Click a season to open this player’s full game log, splits and advanced stats for that year; click a team to open its page. A dash means no NBA games were recorded.
03 / EVERY CATEGORY THE PROVIDER REPORTS
Full statistical breakdown
Regular season 2026-27
Defensive
Metric
Total
NBA rank
Blocks
0
Tied-370th
Defensive Rebounds
12
Tied-312th
Steals
2
Tied-316th
Defensive Rebound Rate
0.0
—
Defensive Rebounds Per Game
6.0
—
Blocks Per Game
0.0
—
Steals Per Game
1.0
—
Defensive Rebounds Per 48
8.5
2,496th
Blocks Per 48
0.0
2,960th
Steals Per 48
1.4
2,528th
General
Metric
Total
NBA rank
Disqualifications
0
Tied-21st
Flagrant Fouls
0
Tied-22nd
Fouls
5
Tied-365th
Player Efficiency Rating
25.73
—
Rebound Rate
0.0
—
Ejections
0
Tied-7th
Technical Fouls
0
Tied-101st
Rebounds
13
—
Value Over Replacement Player
0.0
—
Minutes
68
Tied-6th
Minutes Per Game
34.0
—
Rating
45.0
Tied-868th
Plus-Minus
-20
Tied-1st
Rebounds Per Game
6.5
—
Fouls Per Game
2.5
—
Flagrant Fouls Per Game
0.0
—
Technical Fouls Per Game
0.0
—
Ejections Per Game
0.0
—
Disqualifications Per Game
0.0
—
Assist To Turnover Ratio
1.9
—
Steal To Foul Ratio
0.4
—
Block To Foul Ratio
0.0
—
Team Rebounds Per Game
0.0
—
Rebounds
13
—
Total Technical Fouls
0
—
Assist To Turnover Ratio
0.0
—
Steal To Turnover Ratio
0.3
—
Rebounds Per 48 Minutes
9.2
—
Fouls Per 48 Minutes
3.5
2,920th
Flagrant Fouls Per 48 Minutes
0.0
176th
Technical Fouls Per 48 Minutes
0.0
808th
Ejections Per 48 Minutes
0.0
56th
Disqualifications Per 48 Minutes
0.0
168th
R/40
7.6
—
Games Played
2
2nd
Games Started
2
Tied-195th
Double Double
1
Tied-65th
Triple Double
0
Tied-12th
Offensive
Metric
Total
NBA rank
Assists
15
Tied-229th
Effective Field Goal Percentage
76.1
—
Field Goals
16/23
—
Field Goals Attempted
23
Tied-331st
Field Goals Made
16
Tied-294th
Field Goal Percentage
69.6
—
Free Throws
14/20
—
Free Throw Percentage
70.0
—
Free Throws Attempted
20
Tied-172nd
Free Throws Made
14
Tied-178th
Offensive Rebounds
1
Tied-386th
Points
49
Tied-290th
Turnovers
8
Tied-241st
3-Point Field Goal Percentage
50.0
—
3-Point Field Goals Attempted
6
Tied-332nd
3-Point Field Goals Made
3
Tied-293rd
True Shooting Percentage
77.0
—
Total Turnovers
8
—
Assist Ratio
27.4
—
Points in the Paint
0
Tied-1st
Offensive Rebound Rate
0.0
—
Turnover Ratio
14.6
—
Brick Index
0.00
—
Usage Rate
0.0
—
Average Field Goals Made
8.0
—
Average Field Goals Attempted
11.5
—
Average 3-Point Field Goals Made
1.5
—
Average 3-Point Field Goals Attempted
3.0
—
Average Free Throws Made
7.0
—
Average Free Throws Attempted
10.0
—
Points Per Game
24.5
—
Offensive Rebounds Per Game
0.5
—
Assists Per Game
7.5
—
Turnovers Per Game
4.0
—
Offensive Rebound Percentage
0.1
—
Estimated Possessions
38.0
—
Estimated Possessions Per Game
19.0
—
Points Per Estimated Possession
1.3
—
Team Turnovers Per Game
0.0
—
Total Turnovers Per Game
4.0
—
3-Point Field Goal Percentage
50.0
—
2-Point Field Goals Made
13.0
Tied-1st
2-Point Field Goals Attempted
17.0
1st
2-Point Field Goals Made per Game
6.5
—
2-Point Field Goals Attempted per Game
8.5
—
2-Point Field Goal Percentage
76.5
Tied-1st
Shooting Efficiency
0.76
—
Scoring Efficiency
2.130
—
Fieldgoals Made Per 48
11.3
2,352nd
Fieldgoals Attempted Per 48
16.2
2,648th
3-Point Fieldgoals Made Per 48
2.1
2,344th
3-Point Fieldgoals Attempted Per 48
4.2
2,656th
Freethrows Made Per 48
9.9
1,424th
Freethrows Attempted Per 48
14.1
1,376th
Points Scored Per 48
34.6
2,320th
Offensive Rebounds Per 48
0.7
3,088th
Assists Per 48
10.6
1,832nd
Turnovers
5.6
1,928th
P/40
28.8
—
A/40
8.8
—
04 / EFFICIENCY, SHOOTING PROFILE, PER-36
Advanced metrics
True shooting %77.0%
Effective FG %76.1%
2-point FG %76.5%
3-point attempt rate26.1%
Free throw rate87.0%
Points per shot attempt2.13
% of points from 3s18.4%
Assist-to-turnover1.88
Points per 36 min25.9
Rebounds per 36 min6.9
Assists per 36 min7.9
Steals per 36 min1.06
Blocks per 36 min0.00
Turnovers per 36 min4.24
Stocks (STL + BLK) per game1.00
Pts + Reb + Ast per game38.5
Efficiency (EFF) per game29.0
Game Score per game (Hollinger)21.9
Minutes per game34.0
Calculated by BallersCulture from the supplied 2026-27 box-score totals using standard formulas (hover a tile to see the formula). Tracking-based metrics such as BPM, VORP, on/off and RAPTOR are not available from this data source.
05 / 2 GAMES IN 2026-27
Game log: Regular season
Date
Opp
Result
MIN
FG
FG%
3PT
3P%
FT
FT%
REB
AST
BLK
STL
PF
TO
PTS
Oct 24
vs MIN
L 115-93
26
6-11
54.5
0-2
0.0
2-4
50.0
6
5
0
1
3
2
14
Oct 22
vs ATL
L 132-125
41
10-12
83.3
3-4
75.0
12-16
75.0
7
10
0
1
2
6
35
06 / 2026-27 HOME / AWAY, RESULTS, MONTHS AND OPPONENTS
Splits
split
Split
GP
MIN
FG
FG%
3PT
3P%
FT
FT%
OR
DR
REB
AST
BLK
STL
PF
TO
PTS
All Splits
2
34.0
8.0-11.5
69.6
1.5-3.0
50.0
7.0-10.0
70.0
0.5
6.0
6.5
7.5
0.0
1.0
2.5
4.0
24.5
Home
2
34.0
8.0-11.5
69.6
1.5-3.0
50.0
7.0-10.0
70.0
0.5
6.0
6.5
7.5
0.0
1.0
2.5
4.0
24.5
vs. Division
1
41.0
10.0-12.0
83.3
3.0-4.0
75.0
12.0-16.0
75.0
1.0
6.0
7.0
10.0
0.0
1.0
2.0
6.0
35.0
vs. Conference
1
41.0
10.0-12.0
83.3
3.0-4.0
75.0
12.0-16.0
75.0
1.0
6.0
7.0
10.0
0.0
1.0
2.0
6.0
35.0
3+ Days Rest
1
41.0
10.0-12.0
83.3
3.0-4.0
75.0
12.0-16.0
75.0
1.0
6.0
7.0
10.0
0.0
1.0
2.0
6.0
35.0
Month
Split
GP
MIN
FG
FG%
3PT
3P%
FT
FT%
OR
DR
REB
AST
BLK
STL
PF
TO
PTS
October
2
34.0
8.0-11.5
69.6
1.5-3.0
50.0
7.0-10.0
70.0
0.5
6.0
6.5
7.5
0.0
1.0
2.5
4.0
24.5
Pre All-Star
2
34.0
8.0-11.5
69.6
1.5-3.0
50.0
7.0-10.0
70.0
0.5
6.0
6.5
7.5
0.0
1.0
2.5
4.0
24.5
Result
Split
GP
MIN
FG
FG%
3PT
3P%
FT
FT%
OR
DR
REB
AST
BLK
STL
PF
TO
PTS
Losses
2
34.0
8.0-11.5
69.6
1.5-3.0
50.0
7.0-10.0
70.0
0.5
6.0
6.5
7.5
0.0
1.0
2.5
4.0
24.5
Position
Split
GP
MIN
FG
FG%
3PT
3P%
FT
FT%
OR
DR
REB
AST
BLK
STL
PF
TO
PTS
As Starter
2
34.0
8.0-11.5
69.6
1.5-3.0
50.0
7.0-10.0
70.0
0.5
6.0
6.5
7.5
0.0
1.0
2.5
4.0
24.5
Day
Split
GP
MIN
FG
FG%
3PT
3P%
FT
FT%
OR
DR
REB
AST
BLK
STL
PF
TO
PTS
Wednesday
1
41.0
10.0-12.0
83.3
3.0-4.0
75.0
12.0-16.0
75.0
1.0
6.0
7.0
10.0
0.0
1.0
2.0
6.0
35.0
Friday
1
26.0
6.0-11.0
54.5
0.0-2.0
0.0
2.0-4.0
50.0
0.0
6.0
6.0
5.0
0.0
1.0
3.0
2.0
14.0
Opponent
Split
GP
MIN
FG
FG%
3PT
3P%
FT
FT%
OR
DR
REB
AST
BLK
STL
PF
TO
PTS
Atlanta Hawks
1
41.0
10.0-12.0
83.3
3.0-4.0
75.0
12.0-16.0
75.0
1.0
6.0
7.0
10.0
0.0
1.0
2.0
6.0
35.0
Minnesota Timberwolves
1
26.0
6.0-11.0
54.5
0.0-2.0
0.0
2.0-4.0
50.0
0.0
6.0
6.0
5.0
0.0
1.0
3.0
2.0
14.0
07 / SEASON-BY-SEASON HISTORY
Career statistics
Regular Season Averages
Season
Team
GP
GS
MIN
FG
FG%
3PT
3P%
FT
FT%
OR
DR
REB
AST
BLK
STL
PF
TO
PTS
2022-23
Orlando Magic
72
72
33.8
6.7-15.6
42.7
1.2-4.0
29.8
5.5-7.4
73.8
1.2
5.7
6.9
3.7
0.5
0.8
2.2
2.8
20.0
2023-24
Orlando Magic
80
80
35.0
8.0-17.6
45.5
1.5-4.4
33.9
5.1-7.0
72.5
1.0
5.9
6.9
5.4
0.6
0.9
1.9
3.1
22.6
2024-25
Orlando Magic
46
46
34.4
9.0-19.8
45.2
1.9-5.9
32.0
6.1-8.4
72.7
1.1
6.4
7.5
4.8
0.6
0.8
2.1
3.0
25.9
2025-26
Orlando Magic
72
72
34.8
7.3-16.0
45.9
1.2-3.8
30.5
6.3-8.2
77.5
1.2
7.2
8.4
5.2
0.6
0.7
2.0
3.1
22.2
2026-27
Orlando Magic
2
2
34.0
8.0-11.5
69.6
1.5-3.0
50.0
7.0-10.0
70.0
0.5
6.0
6.5
7.5
0.0
1.0
2.5
4.0
24.5
Career
—
272
272
34.5
7.6-17.0
45.0
1.4-4.4
31.8
5.7-7.7
74.2
1.1
6.3
7.4
4.8
0.6
0.8
2.1
3.0
22.4
Regular Season Totals
Season
Team
FG
FG%
3PT
3P%
FT
FT%
OR
DR
REB
AST
BLK
STL
PF
TO
PTS
2022-23
Orlando Magic
479-1122
42.7
85-285
29.8
394-534
73.8
84
413
497
269
39
60
160
200
1437
2023-24
Orlando Magic
640-1407
45.5
119-351
33.9
405-559
72.5
82
472
554
431
47
71
153
247
1804
2024-25
Orlando Magic
412-911
45.2
87-272
32.0
280-385
72.7
51
294
345
219
28
36
97
136
1191
2025-26
Orlando Magic
529-1152
45.9
84-275
30.5
457-590
77.5
85
519
604
373
40
51
144
222
1599
2026-27
Orlando Magic
16-23
69.6
3-6
50.0
14-20
70.0
1
12
13
15
0
2
5
8
49
Career
—
2076-4615
45.0
378-1189
31.8
1550-2088
74.2
303
1710
2013
1307
154
220
559
813
6080
Regular Season Misc Totals
Season
Team
DD2
TD3
DQ
EJECT
TECH
FLAG
AST/TO
STL/TO
SC-EFF
SH-EFF
2022-23
Orlando Magic
14
0
1
0
3
1
1.3
0.3
1.281
0.46
2023-24
Orlando Magic
16
2
0
0
5
1
1.7
0.3
1.282
0.50
2024-25
Orlando Magic
11
0
0
0
3
0
1.6
0.3
1.307
0.50
2025-26
Orlando Magic
26
3
0
0
4
0
1.7
0.2
1.388
0.50
2026-27
Orlando Magic
1
0
0
0
0
0
1.9
0.3
2.130
0.76
Career
—
68
5
1
0
15
2
1.6
0.3
1.317
0.49
Scoring, rebounding and assist trend
08 / SHOT CHART AND ZONE SHOOTING
Shot profile
Shot-location data is not connected. Add a BALLDONTLIE GOAT-tier NBA API key in NBA Players → Settings to enable shot charts and zone shooting.
LATEST UPDATEBanchero is expected to be sidelined for the next four-to-six weeks due to a right high-ankle sprain, Shams Charania of ESPN reports.
Banchero left during Friday's loss against the Timberwolves due to an ankle injury, and follow-up tests have confirmed a high-ankle sprain for the fifth-year forward. With an extended absence expected, the Magic will have to rely more heavily on Franz Wagner and Desmond Bane offensively, and Tristan da Silva figures to be the top candidate to enter the Magic's starting lineup for as long as Banchero is sidelined.



 Alex MoralesG #30
 Anthony BlackG
 Colin CastletonC #14
 Desmond BaneG #3
 Franz WagnerF #22
 Goga BitadzeC #35
 Izaiyah NelsonF #25
 Jalen SuggsG #4
 Jamal CainF #8
 Jarron CumberlandG #34
 Jase RichardsonG #11
 JD DavisonG #20
 Jevon CarterG #2
 Jonathan IsaacF #1
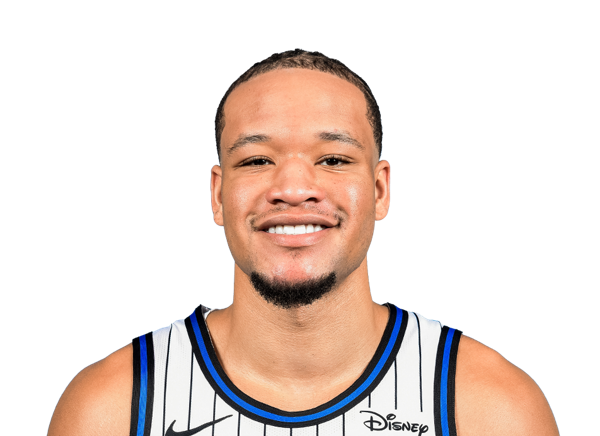 Kevin Knox IIF #24
 Malaki BranhamF #12
 Mike SharavjamtsG
 Nikola VucevicC #9
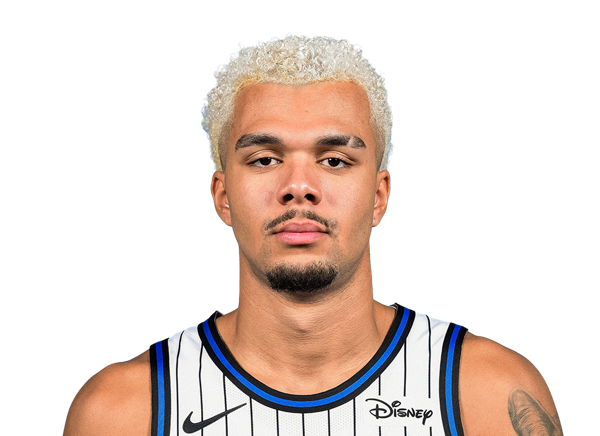 Noah PendaF #93
 Tristan da SilvaF #23
 Wendell Carter Jr.C #34