Click a season to open this player’s full game log, splits and advanced stats for that year; click a team to open its page. A dash means no NBA games were recorded.
03 / EVERY CATEGORY THE PROVIDER REPORTS
Full statistical breakdown
Regular season 2026-27
Defensive
Metric
Total
NBA rank
Blocks
5
Tied-135th
Defensive Rebounds
24
Tied-216th
Steals
0
Tied-402nd
Defensive Rebound Rate
0.0
—
Defensive Rebounds Per Game
2.0
Tied-207th
Blocks Per Game
0.4
Tied-132nd
Steals Per Game
0.0
283rd
Defensive Rebounds Per 48
9.6
2,073rd
Blocks Per 48
2.0
1,296th
Steals Per 48
0.0
3,859th
General
Metric
Total
NBA rank
Disqualifications
0
Tied-21st
Flagrant Fouls
0
Tied-22nd
Fouls
7
Tied-340th
Player Efficiency Rating
10.79
231st
Rebound Rate
0.0
—
Ejections
0
Tied-7th
Technical Fouls
0
Tied-101st
Rebounds
34
—
Value Over Replacement Player
0.3
—
Minutes
120
Tied-5th
Minutes Per Game
10.0
—
Rating
7.1
Tied-133rd
Plus-Minus
-63
Tied-1st
Rebounds Per Game
2.8
Tied-207th
Fouls Per Game
0.6
281st
Flagrant Fouls Per Game
0.0
Tied-19th
Technical Fouls Per Game
0.0
Tied-82nd
Ejections Per Game
0.0
Tied-6th
Disqualifications Per Game
0.0
Tied-20th
Assist To Turnover Ratio
3.3
—
Steal To Foul Ratio
0.0
—
Block To Foul Ratio
0.7
—
Team Rebounds Per Game
0.0
—
Rebounds
34
—
Total Technical Fouls
0
—
Assist To Turnover Ratio
0.0
—
Steal To Turnover Ratio
0.0
—
Rebounds Per 48 Minutes
13.6
—
Fouls Per 48 Minutes
2.8
3,264th
Flagrant Fouls Per 48 Minutes
0.0
211th
Technical Fouls Per 48 Minutes
0.0
969th
Ejections Per 48 Minutes
0.0
67th
Disqualifications Per 48 Minutes
0.0
201st
R/40
11.3
—
Games Played
12
12th
Games Started
0
Tied-257th
Double Double
0
Tied-119th
Triple Double
0
Tied-12th
Offensive
Metric
Total
NBA rank
Assists
13
Tied-253rd
Effective Field Goal Percentage
41.7
—
Field Goals
13/36
—
Field Goals Attempted
36
Tied-299th
Field Goals Made
13
Tied-313th
Field Goal Percentage
36.1
—
Free Throws
2/3
—
Free Throw Percentage
66.7
Tied-218th
Free Throws Attempted
3
Tied-358th
Free Throws Made
2
Tied-355th
Offensive Rebounds
10
Tied-164th
Points
32
Tied-321st
Turnovers
4
Tied-308th
3-Point Field Goal Percentage
20.0
Tied-253rd
3-Point Field Goals Attempted
20
Tied-256th
3-Point Field Goals Made
4
Tied-282nd
True Shooting Percentage
42.9
—
Total Turnovers
4
—
Assist Ratio
23.9
—
Points in the Paint
0
Tied-1st
Offensive Rebound Rate
0.0
—
Turnover Ratio
7.4
—
Brick Index
0.00
—
Usage Rate
0.0
—
Average Field Goals Made
1.1
—
Average Field Goals Attempted
3.0
121st
Average 3-Point Field Goals Made
0.3
—
Average 3-Point Field Goals Attempted
1.7
234th
Average Free Throws Made
0.2
—
Average Free Throws Attempted
0.3
276th
Points Per Game
2.7
280th
Offensive Rebounds Per Game
0.8
Tied-153rd
Assists Per Game
1.1
Tied-226th
Turnovers Per Game
0.3
267th
Offensive Rebound Percentage
0.4
—
Estimated Possessions
31.2
—
Estimated Possessions Per Game
2.6
—
Points Per Estimated Possession
1.0
—
Team Turnovers Per Game
0.0
—
Total Turnovers Per Game
0.3
—
3-Point Field Goal Percentage
20.0
—
2-Point Field Goals Made
9.0
Tied-31st
2-Point Field Goals Attempted
16.0
Tied-43rd
2-Point Field Goals Made per Game
0.8
—
2-Point Field Goals Attempted per Game
1.3
—
2-Point Field Goal Percentage
56.3
—
Shooting Efficiency
0.42
—
Scoring Efficiency
0.889
—
Fieldgoals Made Per 48
5.2
3,004th
Fieldgoals Attempted Per 48
14.4
2,870th
3-Point Fieldgoals Made Per 48
1.6
2,707th
3-Point Fieldgoals Attempted Per 48
8.0
2,457th
Freethrows Made Per 48
0.8
3,408th
Freethrows Attempted Per 48
1.2
3,436th
Points Scored Per 48
12.8
3,081st
Offensive Rebounds Per 48
4.0
1,574th
Assists Per 48
5.2
2,428th
Turnovers
1.6
2,956th
P/40
10.7
—
A/40
4.3
—
04 / EFFICIENCY, SHOOTING PROFILE, PER-36
Advanced metrics
True shooting %43.1%
Effective FG %41.7%
2-point FG %61.5%
3-point attempt rate56.7%
Free throw rate10.0%
Points per shot attempt0.90
% of points from 3s33.3%
Assist-to-turnover3.67
Points per 36 min9.7
Rebounds per 36 min10.1
Assists per 36 min4.0
Steals per 36 min0.00
Blocks per 36 min1.44
Turnovers per 36 min1.08
Stocks (STL + BLK) per game0.40
Pts + Reb + Ast per game6.6
Efficiency (EFF) per game4.7
Game Score per game (Hollinger)2.7
Minutes per game10.0
Calculated by BallersCulture from the supplied 2026-27 box-score totals using standard formulas (hover a tile to see the formula). Tracking-based metrics such as BPM, VORP, on/off and RAPTOR are not available from this data source.
05 / 12 GAMES IN 2026-27
Game log: Regular season
Date
Opp
Result
MIN
FG
FG%
3PT
3P%
FT
FT%
REB
AST
BLK
STL
PF
TO
PTS
Nov 14
vs MIL
W 107-99
11
1-4
25.0
0-3
0.0
0-0
0.0
3
0
0
0
1
0
2
Nov 12
@ UTAH
W 123-108
14
1-3
33.3
0-1
0.0
1-1
100.0
5
1
0
0
0
0
3
Nov 11
@ SAC
W 107-100
18
2-5
40.0
1-3
33.3
0-0
0.0
4
1
0
0
0
1
5
Nov 8
@ GS
L 126-119 OT
6
0-2
0.0
0-1
0.0
0-0
0.0
1
2
0
0
1
0
0
Nov 6
@ PHX
L 117-104
4
0-1
0.0
0-1
0.0
0-0
0.0
0
0
0
0
0
0
0
Nov 3
vs WSH
L 103-94
14
3-6
50.0
1-3
33.3
0-0
0.0
6
1
1
0
0
0
7
Nov 2
vs BOS
L 108-97
7
1-2
50.0
0-0
0.0
0-0
0.0
4
2
1
0
1
1
2
Oct 31
@ TOR
W 121-114
6
1-1
100.0
1-1
100.0
0-0
0.0
1
0
0
0
0
0
3
Oct 29
@ TOR
L 129-99
16
2-5
40.0
0-2
0.0
1-2
50.0
4
2
1
0
1
1
5
Oct 26
@ NY
W 111-102
15
2-6
33.3
1-4
25.0
0-0
0.0
3
3
2
0
1
1
5
Oct 24
vs MIN
L 115-93
4
0-1
0.0
0-1
0.0
0-0
0.0
2
0
0
0
0
0
0
Oct 22
vs ATL
L 132-125
5
0-0
0.0
0-0
0.0
0-0
0.0
1
1
0
0
2
0
0
06 / 2026-27 HOME / AWAY, RESULTS, MONTHS AND OPPONENTS
Splits
split
Split
GP
MIN
FG
FG%
3PT
3P%
FT
FT%
OR
DR
REB
AST
BLK
STL
PF
TO
PTS
All Splits
12
10.0
1.1-3.0
36.1
0.3-1.7
20.0
0.2-0.3
66.7
0.8
2.0
2.8
1.1
0.4
0.0
0.6
0.3
2.7
Home
5
8.2
1.0-2.6
38.5
0.2-1.4
14.3
0.0-0.0
0.0
0.6
2.6
3.2
0.8
0.4
0.0
0.8
0.2
2.2
Road
7
11.3
1.1-3.3
34.8
0.4-1.9
23.1
0.3-0.4
66.7
1.0
1.6
2.6
1.3
0.4
0.0
0.4
0.4
3.0
vs. Division
2
9.5
1.5-3.0
50.0
0.5-1.5
33.3
0.0-0.0
0.0
0.5
3.0
3.5
1.0
0.5
0.0
1.0
0.0
3.5
vs. Conference
7
10.6
1.4-3.4
41.7
0.4-1.9
23.1
0.1-0.3
50.0
0.7
2.4
3.1
1.3
0.7
0.0
0.9
0.4
3.4
3+ Days Rest
1
5.0
0.0-0.0
0.0
0.0-0.0
0.0
0.0-0.0
0.0
0.0
1.0
1.0
1.0
0.0
0.0
2.0
0.0
0.0
Month
Split
GP
MIN
FG
FG%
3PT
3P%
FT
FT%
OR
DR
REB
AST
BLK
STL
PF
TO
PTS
October
5
9.2
1.0-2.6
38.5
0.4-1.6
25.0
0.2-0.4
50.0
0.4
1.8
2.2
1.2
0.6
0.0
0.8
0.4
2.6
November
7
10.6
1.1-3.3
34.8
0.3-1.7
16.7
0.1-0.1
100.0
1.1
2.1
3.3
1.0
0.3
0.0
0.4
0.3
2.7
Pre All-Star
12
10.0
1.1-3.0
36.1
0.3-1.7
20.0
0.2-0.3
66.7
0.8
2.0
2.8
1.1
0.4
0.0
0.6
0.3
2.7
Result
Split
GP
MIN
FG
FG%
3PT
3P%
FT
FT%
OR
DR
REB
AST
BLK
STL
PF
TO
PTS
Wins
5
12.8
1.4-3.8
36.8
0.6-2.4
25.0
0.2-0.2
100.0
1.0
2.2
3.2
1.0
0.4
0.0
0.4
0.4
3.6
Losses
7
8.0
0.9-2.4
35.3
0.1-1.1
12.5
0.1-0.3
50.0
0.7
1.9
2.6
1.1
0.4
0.0
0.7
0.3
2.0
Day
Split
GP
MIN
FG
FG%
3PT
3P%
FT
FT%
OR
DR
REB
AST
BLK
STL
PF
TO
PTS
Monday
1
14.0
3.0-6.0
50.0
1.0-3.0
33.3
0.0-0.0
0.0
1.0
5.0
6.0
1.0
1.0
0.0
0.0
0.0
7.0
Tuesday
1
18.0
2.0-5.0
40.0
1.0-3.0
33.3
0.0-0.0
0.0
2.0
2.0
4.0
1.0
0.0
0.0
0.0
1.0
5.0
Wednesday
3
11.7
1.0-2.7
37.5
0.0-1.0
0.0
0.7-1.0
66.7
1.0
2.3
3.3
1.3
0.3
0.0
1.0
0.3
2.7
Thursday
1
4.0
0.0-1.0
0.0
0.0-1.0
0.0
0.0-0.0
0.0
0.0
0.0
0.0
0.0
0.0
0.0
0.0
0.0
0.0
Friday
3
6.7
0.7-2.0
33.3
0.3-1.7
20.0
0.0-0.0
0.0
0.0
2.0
2.0
0.0
0.0
0.0
0.3
0.0
1.7
Saturday
1
6.0
0.0-2.0
0.0
0.0-1.0
0.0
0.0-0.0
0.0
1.0
0.0
1.0
2.0
0.0
0.0
1.0
0.0
0.0
Sunday
2
11.5
1.5-4.0
37.5
0.5-2.0
25.0
0.0-0.0
0.0
1.5
2.0
3.5
2.5
1.5
0.0
1.0
1.0
3.5
Opponent
Split
GP
MIN
FG
FG%
3PT
3P%
FT
FT%
OR
DR
REB
AST
BLK
STL
PF
TO
PTS
Atlanta Hawks
1
5.0
0.0-0.0
0.0
0.0-0.0
0.0
0.0-0.0
0.0
0.0
1.0
1.0
1.0
0.0
0.0
2.0
0.0
0.0
Boston Celtics
1
7.0
1.0-2.0
50.0
0.0-0.0
0.0
0.0-0.0
0.0
2.0
2.0
4.0
2.0
1.0
0.0
1.0
1.0
2.0
Golden State Warriors
1
6.0
0.0-2.0
0.0
0.0-1.0
0.0
0.0-0.0
0.0
1.0
0.0
1.0
2.0
0.0
0.0
1.0
0.0
0.0
Milwaukee Bucks
1
11.0
1.0-4.0
25.0
0.0-3.0
0.0
0.0-0.0
0.0
0.0
3.0
3.0
0.0
0.0
0.0
1.0
0.0
2.0
Minnesota Timberwolves
1
4.0
0.0-1.0
0.0
0.0-1.0
0.0
0.0-0.0
0.0
0.0
2.0
2.0
0.0
0.0
0.0
0.0
0.0
0.0
New York Knicks
1
15.0
2.0-6.0
33.3
1.0-4.0
25.0
0.0-0.0
0.0
1.0
2.0
3.0
3.0
2.0
0.0
1.0
1.0
5.0
Phoenix Suns
1
4.0
0.0-1.0
0.0
0.0-1.0
0.0
0.0-0.0
0.0
0.0
0.0
0.0
0.0
0.0
0.0
0.0
0.0
0.0
Sacramento Kings
1
18.0
2.0-5.0
40.0
1.0-3.0
33.3
0.0-0.0
0.0
2.0
2.0
4.0
1.0
0.0
0.0
0.0
1.0
5.0
Toronto Raptors
2
11.0
1.5-3.0
50.0
0.5-1.5
33.3
0.5-1.0
50.0
0.5
2.0
2.5
1.0
0.5
0.0
0.5
0.5
4.0
Utah Jazz
1
14.0
1.0-3.0
33.3
0.0-1.0
0.0
1.0-1.0
100.0
2.0
3.0
5.0
1.0
0.0
0.0
0.0
0.0
3.0
Washington Wizards
1
14.0
3.0-6.0
50.0
1.0-3.0
33.3
0.0-0.0
0.0
1.0
5.0
6.0
1.0
1.0
0.0
0.0
0.0
7.0
07 / SEASON-BY-SEASON HISTORY
Career statistics
Regular Season Averages
Season
Team
GP
GS
MIN
FG
FG%
3PT
3P%
FT
FT%
OR
DR
REB
AST
BLK
STL
PF
TO
PTS
2011-12
Philadelphia 76ers
51
15
15.9
2.6-5.7
45.0
0.1-0.2
37.5
0.4-0.7
52.9
1.7
3.1
4.8
0.6
0.7
0.4
2.2
0.6
5.5
2012-13
Orlando Magic
77
77
33.2
6.0-11.5
51.9
0.0-0.0
0.0
1.1-1.6
68.3
3.5
8.4
11.9
1.9
1.0
0.8
2.8
1.8
13.1
2013-14
Orlando Magic
57
57
31.8
6.2-12.2
50.7
0.0-0.0
0.0
1.8-2.4
76.6
3.2
7.7
11.0
1.8
0.8
1.1
3.0
2.0
14.2
2014-15
Orlando Magic
74
74
34.2
8.5-16.3
52.3
0.0-0.1
33.3
2.2-2.9
75.2
3.2
7.7
10.9
2.0
0.7
0.7
3.0
2.0
19.3
2015-16
Orlando Magic
65
60
31.3
8.2-16.1
51.0
0.0-0.1
22.2
1.7-2.3
75.3
2.7
6.2
8.9
2.8
1.1
0.8
2.7
1.9
18.2
2016-17
Orlando Magic
75
55
28.8
6.4-13.7
46.8
0.3-1.0
30.7
1.4-2.1
66.9
2.3
8.0
10.4
2.8
1.0
1.0
2.4
1.6
14.6
2017-18
Orlando Magic
57
57
29.5
7.0-14.7
47.5
1.1-3.6
31.4
1.4-1.6
81.9
1.8
7.4
9.2
3.4
1.1
1.0
2.5
1.9
16.5
2018-19
Orlando Magic
80
80
31.4
8.8-16.9
51.8
1.1-2.9
36.4
2.2-2.8
78.9
2.8
9.2
12.0
3.8
1.1
1.0
2.0
2.0
20.8
2019-20
Orlando Magic
62
62
32.2
8.0-16.7
47.7
1.6-4.7
33.9
2.1-2.7
78.4
2.3
8.6
10.9
3.6
0.8
0.9
2.2
1.4
19.6
2020-21
Orlando Magic
44
44
34.1
9.9-20.6
48.0
2.7-6.5
40.6
2.1-2.5
82.7
2.0
9.8
11.8
3.8
0.6
1.0
1.8
1.9
24.5
2020-21
Chicago Bulls
26
26
32.6
8.8-18.8
47.1
2.3-5.8
38.8
1.5-1.8
87.0
2.3
9.3
11.5
3.9
0.8
0.9
2.2
1.7
21.5
2020-21
2020 21 Totals
70
70
33.5
9.5-19.9
47.7
2.5-6.3
40.0
1.9-2.2
84.0
2.1
9.6
11.7
3.8
0.7
0.9
2.0
1.8
23.4
2021-22
Chicago Bulls
73
73
33.1
7.5-15.8
47.3
1.4-4.5
31.4
1.3-1.7
76.0
1.9
9.1
11.0
3.2
1.0
1.0
2.5
1.9
17.6
2022-23
Chicago Bulls
82
82
33.5
7.3-14.0
52.0
1.5-4.2
34.9
1.6-1.9
83.5
1.9
9.1
11.0
3.2
0.7
0.7
2.2
1.7
17.6
2023-24
Chicago Bulls
76
74
34.3
7.7-15.9
48.4
1.2-4.1
29.4
1.4-1.7
82.2
2.8
7.8
10.5
3.3
0.8
0.7
2.5
1.6
18.0
2024-25
Chicago Bulls
73
72
31.2
7.5-14.2
53.0
1.8-4.4
40.2
1.6-2.0
80.5
2.4
7.6
10.1
3.5
0.7
0.8
2.2
1.6
18.5
2025-26
Chicago Bulls
48
48
30.8
6.9-13.8
50.5
1.7-4.5
37.6
1.3-1.5
83.8
2.1
6.9
9.0
3.8
0.6
0.7
2.0
1.4
16.9
2025-26
Boston Celtics
16
1
21.1
3.8-8.7
43.9
1.1-3.3
34.0
0.9-1.2
78.9
1.6
5.1
6.6
2.0
0.6
0.4
1.9
1.0
9.7
2025-26
2025 26 Totals
64
49
28.4
6.2-12.5
49.3
1.6-4.2
36.9
1.2-1.5
82.8
2.0
6.4
8.4
3.3
0.6
0.6
2.0
1.3
15.1
2026-27
Orlando Magic
12
0
10.0
1.1-3.0
36.1
0.3-1.7
20.0
0.2-0.3
66.7
0.8
2.0
2.8
1.1
0.4
0.0
0.6
0.3
2.7
Career
—
1048
957
31.0
7.2-14.5
49.7
1.0-2.7
34.9
1.6-2.0
77.3
2.5
7.8
10.2
2.9
0.8
0.8
2.4
1.7
16.9
Regular Season Totals
Season
Team
FG
FG%
3PT
3P%
FT
FT%
OR
DR
REB
AST
BLK
STL
PF
TO
PTS
2011-12
Philadelphia 76ers
131-291
45.0
3-8
37.5
18-34
52.9
88
158
246
31
34
20
111
33
283
2012-13
Orlando Magic
461-889
51.9
0-3
0.0
86-126
68.3
273
644
917
143
79
61
218
141
1008
2013-14
Orlando Magic
353-696
50.7
0-0
0.0
105-137
76.6
185
441
626
104
47
60
169
112
811
2014-15
Orlando Magic
631-1206
52.3
2-6
33.3
164-218
75.2
238
572
810
147
54
54
220
148
1428
2015-16
Orlando Magic
533-1046
51.0
2-9
22.2
113-150
75.3
174
402
576
179
70
53
173
123
1181
2016-17
Orlando Magic
483-1031
46.8
23-75
30.7
107-160
66.9
176
603
779
208
74
76
180
117
1096
2017-18
Orlando Magic
399-840
47.5
64-204
31.4
77-94
81.9
101
422
523
191
62
56
144
109
939
2018-19
Orlando Magic
701-1354
51.8
84-231
36.4
179-227
78.9
224
736
960
307
89
81
157
159
1665
2019-20
Orlando Magic
493-1033
47.7
98-289
33.9
131-167
78.4
140
533
673
222
47
54
135
88
1215
2020-21
Orlando Magic
436-908
48.0
117-288
40.6
91-110
82.7
87
430
517
167
28
42
79
83
1080
2020-21
Chicago Bulls
230-488
47.1
59-152
38.8
40-46
87.0
59
241
300
102
20
23
58
43
559
2020-21
2020 21 Totals
666-1396
47.7
176-440
40.0
131-156
84.0
146
671
817
269
48
65
137
126
1639
2021-22
Chicago Bulls
546-1154
47.3
104-331
31.4
92-121
76.0
142
662
804
236
71
70
181
136
1288
2022-23
Chicago Bulls
597-1148
52.0
121-347
34.9
132-158
83.5
159
744
903
265
57
60
179
139
1447
2023-24
Chicago Bulls
586-1211
48.4
92-313
29.4
106-129
82.2
210
591
801
254
60
50
190
120
1370
2024-25
Chicago Bulls
550-1038
53.0
129-321
40.2
120-149
80.5
178
557
735
256
52
61
163
119
1349
2025-26
Chicago Bulls
333-660
50.5
82-218
37.6
62-74
83.8
100
331
431
181
31
32
97
69
810
2025-26
Boston Celtics
61-139
43.9
18-53
34.0
15-19
78.9
25
81
106
32
10
7
30
16
155
2025-26
2025 26 Totals
394-799
49.3
100-271
36.9
77-93
82.8
125
412
537
213
41
39
127
85
965
2026-27
Orlando Magic
13-36
36.1
4-20
20.0
2-3
66.7
10
24
34
13
5
0
7
4
32
Career
—
7537-15168
49.7
1002-2868
34.9
1640-2122
77.3
2569
8172
10741
3038
890
860
2491
1759
17716
Regular Season Misc Totals
Season
Team
DD2
TD3
DQ
EJECT
TECH
FLAG
AST/TO
STL/TO
SC-EFF
SH-EFF
2011-12
Philadelphia 76ers
2
0
0
0
0
0
0.9
0.6
0.973
0.46
2012-13
Orlando Magic
46
0
4
0
1
0
1.0
0.4
1.134
0.52
2013-14
Orlando Magic
36
0
4
1
4
1
0.9
0.5
1.165
0.51
2014-15
Orlando Magic
45
0
3
0
3
0
1.0
0.4
1.184
0.52
2015-16
Orlando Magic
29
0
2
0
3
1
1.5
0.4
1.129
0.51
2016-17
Orlando Magic
38
0
0
0
4
0
1.8
0.6
1.063
0.48
2017-18
Orlando Magic
29
1
0
0
3
0
1.8
0.5
1.118
0.51
2018-19
Orlando Magic
60
1
1
0
4
0
1.9
0.5
1.230
0.55
2019-20
Orlando Magic
41
0
1
0
4
0
2.5
0.6
1.176
0.52
2020-21
Orlando Magic
30
1
0
0
5
0
2.0
0.5
1.189
0.54
2020-21
Chicago Bulls
18
1
0
0
4
0
2.4
0.5
1.145
0.53
2020-21
2020 21 Totals
48
2
0
0
9
0
2.1
0.5
1.174
0.54
2021-22
Chicago Bulls
44
0
2
0
10
1
1.7
0.5
1.116
0.52
2022-23
Chicago Bulls
51
1
0
1
8
0
1.9
0.4
1.260
0.57
2023-24
Chicago Bulls
45
0
1
1
5
1
2.1
0.4
1.131
0.52
2024-25
Chicago Bulls
45
1
0
0
7
2
2.2
0.5
1.300
0.59
2025-26
Chicago Bulls
19
0
0
0
2
0
2.6
0.5
1.227
0.57
2025-26
Boston Celtics
4
0
0
0
0
0
2.0
0.4
1.115
0.50
2025-26
2025 26 Totals
23
0
0
0
2
0
2.5
0.5
1.208
0.56
2026-27
Orlando Magic
0
0
0
0
0
0
3.3
0.0
0.889
0.42
Career
—
582
6
18
3
67
6
1.7
0.5
1.168
0.53
Scoring, rebounding and assist trend
08 / SHOT CHART AND ZONE SHOOTING
Shot profile
Shot-location data is not connected. Add a BALLDONTLIE GOAT-tier NBA API key in NBA Players → Settings to enable shot charts and zone shooting.
LATEST UPDATEVucevic contributed zero points (0-1 FG, 0-1 3Pt) in four minutes during Thursday's 117-104 loss to the Suns.
Vucevic hit rock bottom Thursday, failing to record a single stat in four minutes of playing time. At this point, it appears as though Vucevic won't be fantasy-relevant this season. Through eight games, he has averaged just 2.8 points and 2.6 rebounds in 8.9 minutes per game.




 Alex MoralesG #30
 Anthony BlackG
 Colin CastletonC #14
 Desmond BaneG #3
 Franz WagnerF #22
 Goga BitadzeC #35
 Izaiyah NelsonF #25
 Jalen SuggsG #4
 Jamal CainF #8
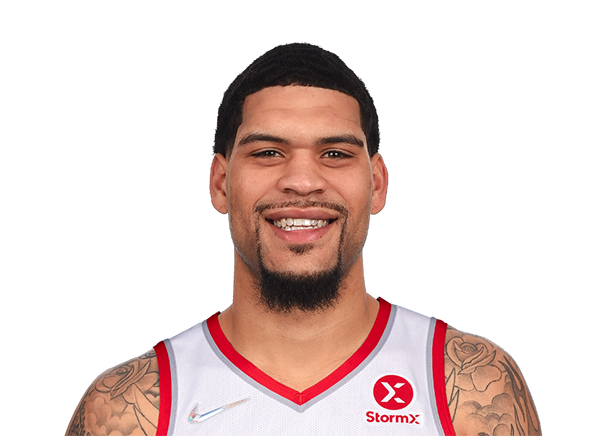 Jarron CumberlandG #34
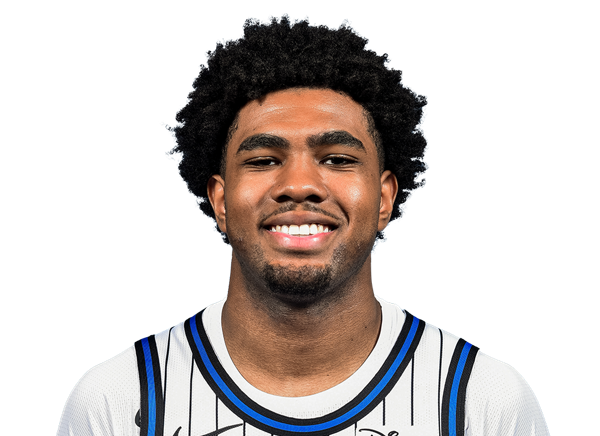 Jase RichardsonG #11
 JD DavisonG #20
 Jevon CarterG #2
 Jonathan IsaacF #1
 Kevin Knox IIF #24
 Malaki BranhamF #12
 Mike SharavjamtsG
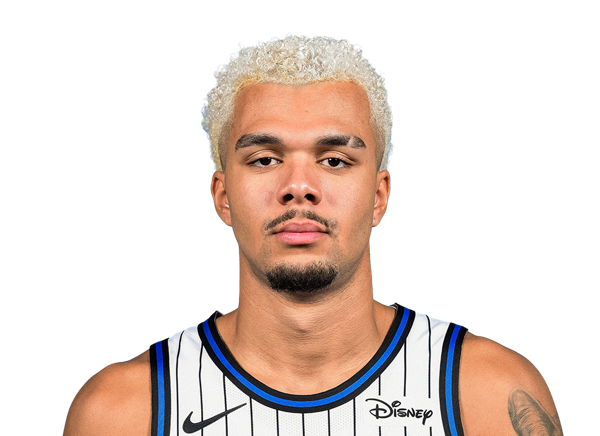 Noah PendaF #93
 Paolo BancheroF #5
 Tristan da SilvaF #23
 Wendell Carter Jr.C #34