

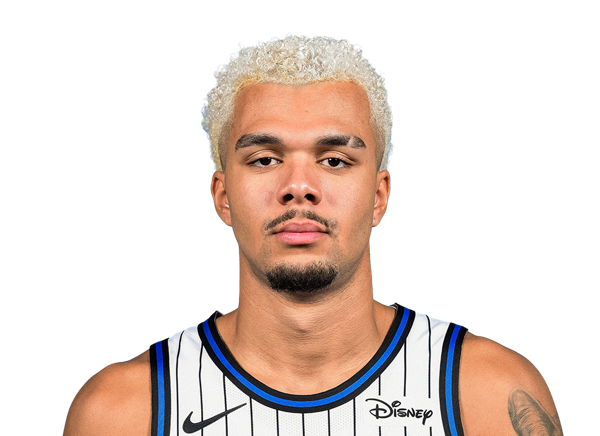
BALLERSCULTURE PLAYER PROFILE · 2026-27
Noah Penda
Orlando Magic · F • #93 • 6' 7" 215 lbs

01 / 2026-27 PER-GAME AVERAGES
Season snapshot
No regular-season 2026-27 statistics are recorded for this player. Career history is shown further down.
02 / EVERY SEASON SINCE 2022-23, SIDE BY SIDE
2022-23 to 2026-27
Per game
| Season | Team | GP | GS | MIN | PTS | REB | AST | STL | BLK | TO | FG% | 3P% | FT% |
|---|---|---|---|---|---|---|---|---|---|---|---|---|---|
| 2022-23 | — | — | — | — | — | — | — | — | — | — | — | — | — |
| 2023-24 | — | — | — | — | — | — | — | — | — | — | — | — | — |
| 2024-25 | — | — | — | — | — | — | — | — | — | — | — | — | — |
| 2025-26 | Orlando Magic | 59 | 2 | 12.8 | 3.8 | 3.2 | 1.2 | 0.5 | 0.3 | 0.7 | 40.4 | 32.3 | 68.8 |
| 2026-27 | — | — | — | — | — | — | — | — | — | — | — | — | — |
Season totals
| Season | Team | GP | GS | MIN | PTS | REB | AST | STL | BLK | TO | FG% | 3P% | FT% |
|---|---|---|---|---|---|---|---|---|---|---|---|---|---|
| 2022-23 | — | — | — | — | — | — | — | — | — | — | — | — | — |
| 2023-24 | — | — | — | — | — | — | — | — | — | — | — | — | — |
| 2024-25 | — | — | — | — | — | — | — | — | — | — | — | — | — |
| 2025-26 | Orlando Magic | — | — | — | 227 | 187 | 70 | 30 | 18 | 42 | 40.4 | 32.3 | 68.8 |
| 2026-27 | — | — | — | — | — | — | — | — | — | — | — | — | — |
Click a season to open this player’s full game log, splits and advanced stats for that year; click a team to open its page. A dash means no NBA games were recorded.
03 / SEASON-BY-SEASON HISTORY
Career statistics
Regular Season Averages
| Season | Team | GP | GS | MIN | FG | FG% | 3PT | 3P% | FT | FT% | OR | DR | REB | AST | BLK | STL | PF | TO | PTS |
|---|---|---|---|---|---|---|---|---|---|---|---|---|---|---|---|---|---|---|---|
| 2025-26 | Orlando Magic | 59 | 2 | 12.8 | 1.4-3.4 | 40.4 | 0.5-1.6 | 32.3 | 0.6-0.8 | 68.8 | 1.1 | 2.0 | 3.2 | 1.2 | 0.3 | 0.5 | 1.2 | 0.7 | 3.8 |
| Career | — | 59 | 2 | 12.8 | 1.4-3.4 | 40.4 | 0.5-1.6 | 32.3 | 0.6-0.8 | 68.8 | 1.1 | 2.0 | 3.2 | 1.2 | 0.3 | 0.5 | 1.2 | 0.7 | 3.8 |
Regular Season Totals
| Season | Team | FG | FG% | 3PT | 3P% | FT | FT% | OR | DR | REB | AST | BLK | STL | PF | TO | PTS |
|---|---|---|---|---|---|---|---|---|---|---|---|---|---|---|---|---|
| 2025-26 | Orlando Magic | 82-203 | 40.4 | 30-93 | 32.3 | 33-48 | 68.8 | 67 | 120 | 187 | 70 | 18 | 30 | 70 | 42 | 227 |
| Career | — | 82-203 | 40.4 | 30-93 | 32.3 | 33-48 | 68.8 | 67 | 120 | 187 | 70 | 18 | 30 | 70 | 42 | 227 |
Regular Season Misc Totals
| Season | Team | DD2 | TD3 | DQ | EJECT | TECH | FLAG | AST/TO | STL/TO | SC-EFF | SH-EFF |
|---|---|---|---|---|---|---|---|---|---|---|---|
| 2025-26 | Orlando Magic | 2 | 0 | 0 | 0 | 1 | 0 | 1.7 | 0.7 | 1.118 | 0.48 |
| Career | — | 2 | 0 | 0 | 0 | 1 | 0 | 1.7 | 0.7 | 1.118 | 0.48 |
04 / SHOT CHART AND ZONE SHOOTING
Shot profile
Shot-location data is not connected. Add a BALLDONTLIE GOAT-tier NBA API key in NBA Players → Settings to enable shot charts and zone shooting.
05 / RECORD, TEAM STATS AND TEAMMATES
Team
Overall5-7
Home1-4
Road4-3
DIV0-2
CONF3-4
Last Ten Games5-5
Team records for 2026-27 (regular season).
Team statistics 2026-27
Defensive
| Metric | Total | Per game | NBA rank |
|---|---|---|---|
| Blocks | 49 | 4.083 | 15th |
| Defensive Rebounds | 383 | 31.917 | 12th |
| Steals | 89 | 7.417 | 15th |
| Points Conceded Off Turnovers | 0 | 18 | — |
| Defensive Rebound Rate | 0.0 | — | — |
| Defensive Rebounds Per Game | 31.9 | — | — |
| Blocks Per Game | 4.1 | — | — |
| Steals Per Game | 7.4 | — | — |
| Defensive Rebounds Per 48 | 0.0 | — | — |
| Blocks Per 48 | 0.0 | — | — |
| Steals Per 48 | 0.0 | — | — |
General
| Metric | Total | Per game | NBA rank |
|---|---|---|---|
| Disqualifications | 4 | — | Tied-2nd |
| Flagrant Fouls | 2 | 0.167 | Tied-2nd |
| Fouls | 274 | 22.833 | Tied-11th |
| Rebound Rate | 50.8 | — | 7th |
| Ejections | 0 | — | — |
| Technical Fouls | 18 | 0.75 | 6th |
| Rebounds | 515 | 42.917 | — |
| Minutes | 0 | — | — |
| Minutes Per Game | 0.0 | — | — |
| Fantasy Rating | 0.0 | — | — |
| Rating | 197.5 | — | — |
| Plus-Minus | -1 | -1 | Tied-1st |
| Game Day of Year | 0 | — | — |
| Rebounds Per Game | 42.9 | — | — |
| Fouls Per Game | 22.8 | — | — |
| Flagrant Fouls Per Game | 0.2 | — | — |
| Technical Fouls Per Game | 1.5 | — | — |
| Ejections Per Game | 0.0 | — | — |
| Disqualifications Per Game | 0.3 | — | — |
| Assist To Turnover Ratio | 1.6 | 1.625 | — |
| Steal To Foul Ratio | 0.3 | 0.325 | — |
| Block To Foul Ratio | 0.2 | 0.179 | — |
| Team Rebounds Per Game | 0.0 | — | — |
| Rebounds | 515 | 42.917 | — |
| Total Technical Fouls | 18 | 0.75 | — |
| Assist To Turnover Ratio | 34.7 | — | — |
| Team Rebounds | 0 | — | — |
| Steal To Turnover Ratio | 0.5 | 0.464 | — |
| Rebounds Per 48 Minutes | 0.0 | — | — |
| Fouls Per 48 Minutes | 0.0 | — | — |
| Flagrant Fouls Per 48 Minutes | 0.0 | — | — |
| Technical Fouls Per 48 Minutes | 0.0 | — | — |
| Ejections Per 48 Minutes | 0.0 | — | — |
| Disqualifications Per 48 Minutes | 0.0 | — | — |
| Games Played | 12 | — | Tied-12th |
| Games Started | 0 | — | — |
| Double Double | 0 | — | — |
| Triple Double | 0 | — | — |
Offensive
| Metric | Total | Per game | NBA rank |
|---|---|---|---|
| Assists | 312 | 26 | 13th |
| Effective Field Goal Percentage | 52.8 | — | 7th |
| Field Goals | 461/1030 | 0.448 | — |
| Field Goals Attempted | 1030 | 85.833 | 14th |
| Field Goals Made | 461 | 38.417 | 13th |
| Field Goal Percentage | 44.8 | 0.448 | 10th |
| Free Throws | 212/271 | 0.782 | — |
| Free Throw Percentage | 78.2 | 0.782 | 6th |
| Free Throws Attempted | 271 | 22.583 | 14th |
| Free Throws Made | 212 | 17.667 | 14th |
| Offensive Rebounds | 132 | 11 | 15th |
| Points | 1300 | 108.333 | 14th |
| Turnovers | 192 | 16 | 8th |
| 3-Point Field Goal Percentage | 33.7 | 0.337 | 10th |
| 3-Point Field Goals Attempted | 493 | 41.083 | 9th |
| 3-Point Field Goals Made | 166 | 13.833 | Tied-10th |
| True Shooting Percentage | 56.6 | — | 8th |
| Team Turnovers | 9 | — | Tied-7th |
| Total Turnovers | 201 | 16 | — |
| Assist Ratio | 18.8 | — | 10th |
| Points in the Paint | 538 | 44 | 11th |
| Offensive Rebound Rate | 26.0 | — | 10th |
| Turnover Ratio | 14.9 | — | 3rd |
| Fast Break Points | 142 | — | — |
| Possessions | 1218 | — | 15th |
| Pace Factor | 100.7 | — | 7th |
| Average Field Goals Made | 38.4 | — | — |
| Average Field Goals Attempted | 85.8 | — | — |
| Average 3-Point Field Goals Made | 13.8 | — | — |
| Average 3-Point Field Goals Attempted | 41.1 | — | — |
| Average Free Throws Made | 17.7 | — | — |
| Average Free Throws Attempted | 22.6 | — | — |
| Points Per Game | 108.3 | — | — |
| Offensive Rebounds Per Game | 11.0 | — | — |
| Assists Per Game | 26.0 | — | — |
| Turnovers Per Game | 16.0 | — | — |
| Offensive Rebound Percentage | 0.2 | 0.232 | — |
| Estimated Possessions | 1207.4 | 99.866 | — |
| Estimated Possessions Per Game | 100.6 | — | — |
| Points Per Estimated Possession | 1.1 | 1.085 | — |
| Team Turnovers Per Game | 0.8 | — | — |
| Total Turnovers Per Game | 16.8 | — | — |
| 3-Point Field Goal Percentage | 33.7 | 0.337 | Tied-1st |
| 2-Point Field Goals Made | 295.0 | 24.584 | 23rd |
| 2-Point Field Goals Attempted | 537.0 | 44.75 | 5th |
| 2-Point Field Goals Made per Game | 24.6 | — | — |
| 2-Point Field Goals Attempted per Game | 44.8 | — | — |
| 2-Point Field Goal Percentage | 54.9 | 0.549 | 4th |
| Shooting Efficiency | 0.53 | 0.528 | — |
| Scoring Efficiency | 1.262 | 1.262 | — |
| Fieldgoals Made Per 48 | 0.0 | — | — |
| Fieldgoals Attempted Per 48 | 0.0 | — | — |
| 3-Point Fieldgoals Made Per 48 | 0.0 | — | — |
| 3-Point Fieldgoals Attempted Per 48 | 0.0 | — | — |
| Freethrows Made Per 48 | 0.0 | — | — |
| Freethrows Attempted Per 48 | 0.0 | — | — |
| Points Scored Per 48 | 0.0 | — | — |
| Offensive Rebounds Per 48 | 0.0 | — | — |
| Assists Per 48 | 0.0 | — | — |
| Turnovers | 0.0 | — | — |
Teammates
 Alex MoralesG #30
 Anthony BlackG
 Colin CastletonC #14
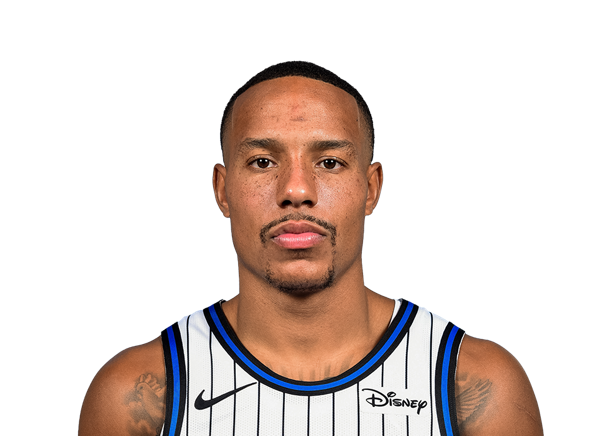 Desmond BaneG #3
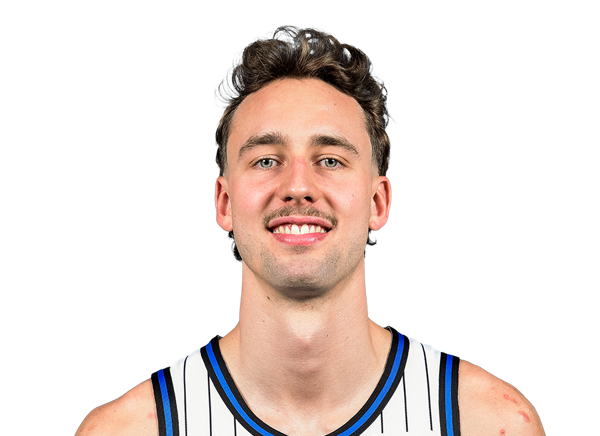 Franz WagnerF #22
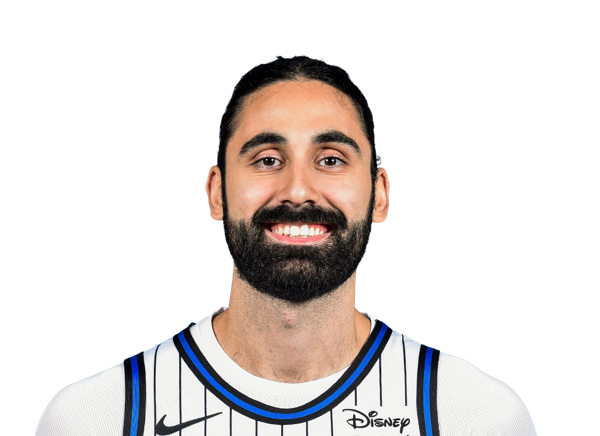 Goga BitadzeC #35
 Izaiyah NelsonF #25
 Jalen SuggsG #4
 Jamal CainF #8
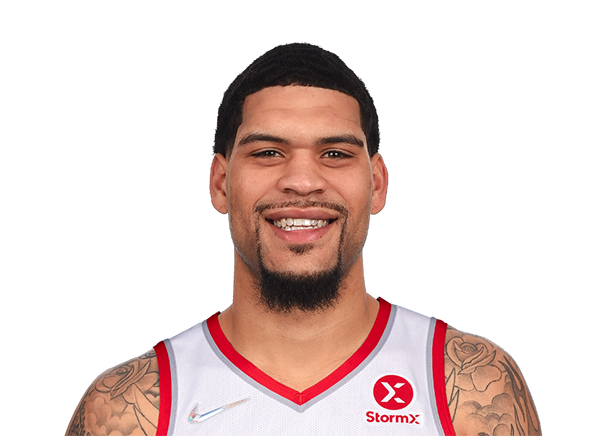 Jarron CumberlandG #34
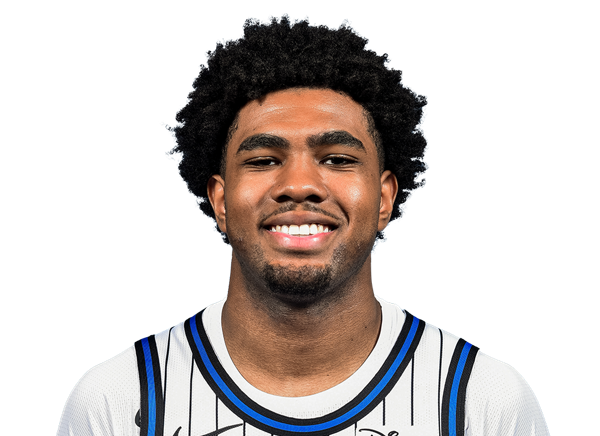 Jase RichardsonG #11
 JD DavisonG #20
 Jevon CarterG #2
 Jonathan IsaacF #1
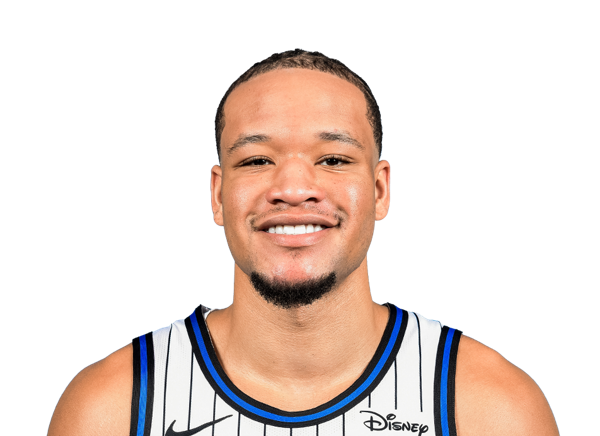 Kevin Knox IIF #24
 Malaki BranhamF #12
 Mike SharavjamtsG
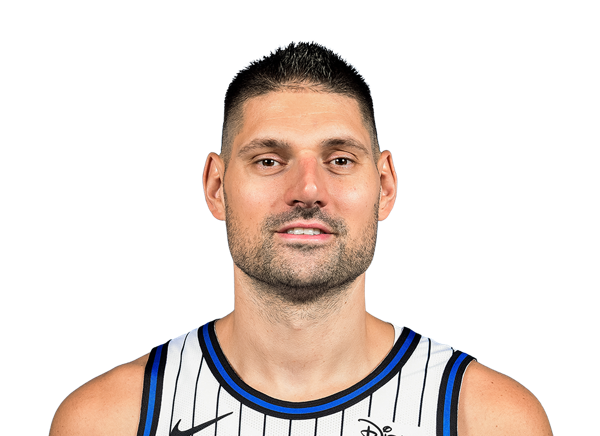 Nikola VucevicC #9
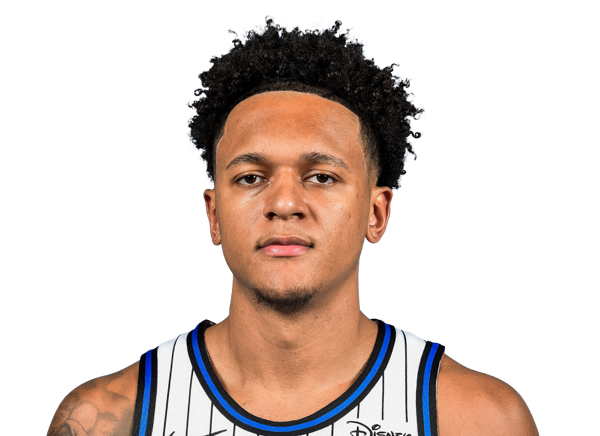 Paolo BancheroF #5
 Tristan da SilvaF #23
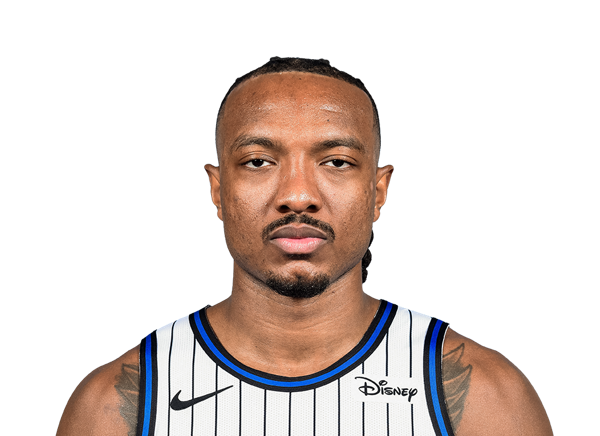 Wendell Carter Jr.C #34
06 / SALARY BY SEASON
Contract
| Season | Salary |
|---|---|
| 2025-26 | $1.27M |
| 2026-27 | $2.15M |
Total listed: $3.42M · source: espn.
07 / LATEST REPORT
Injury status
No current injury report entry for this player.
08 / SIGNINGS, TRADES AND ROSTER MOVES
Transactions
No recorded transactions for this player.
09 / LATEST COVERAGE
Player news
LATEST UPDATEPenda (hamstring) is making progress but remains without a timetable to return to game action, Jason Beede of the Orlando Sentinel reports.
Penda suffered a partially torn hamstring in the preseason and can still be considered week-to-week moving forward. With the second-year forward and Paolo Banchero (ankle) both sidelined, Tristan da Silva and Jamal Cain should continue seeing increased minutes.
14 October 2026Magic jam waved off after player ... dunks on his own face?↗
16 July 2026Richardson scores 25 as Magic hold off 76ers' rally↗
16 July 2026Noah Penda elevates for slam dunk↗
12 July 2026Noah Penda shows off the range on triple↗
10 July 2026Charlotte Hornets vs. Orlando Magic: Game Highlights↗
10 July 2026Noah Penda elevates for the big-time block↗
17 November 202676ers star LeBron James ruled out vs. Nets due to lower back management↗
17 November 2026Fantasy basketball adds and NBA bets: All eyes on Tyrese Maxey on Monday↗
10 / BIO, DRAFT AND CONTACT DETAILS
Biography & profile
TeamOrlando Magic
PositionForward
Jersey93
Height6' 7"
Weight215 lbs
Age21
Date of birthJan 7, 2005
BirthplaceParis, France
Experience2 yrs
StatusActive
Injury reportOut