Click a season to open this player’s full game log, splits and advanced stats for that year; click a team to open its page. A dash means no NBA games were recorded.
03 / EVERY CATEGORY THE PROVIDER REPORTS
Full statistical breakdown
Regular season 2026-27
Defensive
Metric
Total
NBA rank
Blocks
1
Tied-289th
Defensive Rebounds
6
Tied-358th
Steals
6
Tied-217th
Defensive Rebound Rate
0.0
—
Defensive Rebounds Per Game
0.8
—
Blocks Per Game
0.1
—
Steals Per Game
0.8
—
Defensive Rebounds Per 48
2.4
3,436th
Blocks Per 48
0.4
2,774th
Steals Per 48
2.4
2,083rd
General
Metric
Total
NBA rank
Disqualifications
0
Tied-21st
Flagrant Fouls
0
Tied-22nd
Fouls
8
Tied-326th
Player Efficiency Rating
9.10
—
Rebound Rate
0.0
—
Ejections
0
Tied-7th
Technical Fouls
0
Tied-101st
Rebounds
8
—
Value Over Replacement Player
0.0
—
Minutes
120
Tied-5th
Minutes Per Game
15.0
—
Rating
8.3
Tied-251st
Plus-Minus
-28
Tied-1st
Rebounds Per Game
1.0
—
Fouls Per Game
1.0
—
Flagrant Fouls Per Game
0.0
—
Technical Fouls Per Game
0.0
—
Ejections Per Game
0.0
—
Disqualifications Per Game
0.0
—
Assist To Turnover Ratio
7.0
—
Steal To Foul Ratio
0.8
—
Block To Foul Ratio
0.1
—
Team Rebounds Per Game
0.0
—
Rebounds
8
—
Total Technical Fouls
0
—
Assist To Turnover Ratio
0.0
—
Steal To Turnover Ratio
3.0
—
Rebounds Per 48 Minutes
3.2
—
Fouls Per 48 Minutes
3.2
3,129th
Flagrant Fouls Per 48 Minutes
0.0
211th
Technical Fouls Per 48 Minutes
0.0
969th
Ejections Per 48 Minutes
0.0
67th
Disqualifications Per 48 Minutes
0.0
201st
R/40
2.7
—
Games Played
8
8th
Games Started
0
Tied-257th
Double Double
0
Tied-119th
Triple Double
0
Tied-12th
Offensive
Metric
Total
NBA rank
Assists
14
Tied-238th
Effective Field Goal Percentage
45.0
—
Field Goals
13/40
—
Field Goals Attempted
40
292nd
Field Goals Made
13
Tied-313th
Field Goal Percentage
32.5
—
Free Throws
0/0
—
Free Throw Percentage
0.0
—
Free Throws Attempted
0
Tied-418th
Free Throws Made
0
Tied-413th
Offensive Rebounds
2
Tied-358th
Points
36
Tied-311th
Turnovers
2
Tied-365th
3-Point Field Goal Percentage
30.3
—
3-Point Field Goals Attempted
33
Tied-202nd
3-Point Field Goals Made
10
Tied-205th
True Shooting Percentage
45.0
—
Total Turnovers
2
—
Assist Ratio
25.0
—
Points in the Paint
0
Tied-1st
Offensive Rebound Rate
0.0
—
Turnover Ratio
3.6
—
Brick Index
0.00
—
Usage Rate
0.0
—
Average Field Goals Made
1.6
—
Average Field Goals Attempted
5.0
—
Average 3-Point Field Goals Made
1.3
—
Average 3-Point Field Goals Attempted
4.1
—
Average Free Throws Made
0.0
—
Average Free Throws Attempted
0.0
—
Points Per Game
4.5
—
Offensive Rebounds Per Game
0.3
—
Assists Per Game
1.8
—
Turnovers Per Game
0.3
—
Offensive Rebound Percentage
0.1
—
Estimated Possessions
40.0
—
Estimated Possessions Per Game
5.0
—
Points Per Estimated Possession
0.9
—
Team Turnovers Per Game
0.0
—
Total Turnovers Per Game
0.3
—
3-Point Field Goal Percentage
30.3
—
2-Point Field Goals Made
3.0
Tied-108th
2-Point Field Goals Attempted
7.0
494th
2-Point Field Goals Made per Game
0.4
—
2-Point Field Goals Attempted per Game
0.9
—
2-Point Field Goal Percentage
42.9
—
Shooting Efficiency
0.45
—
Scoring Efficiency
0.900
—
Fieldgoals Made Per 48
5.2
3,004th
Fieldgoals Attempted Per 48
16.0
Tied-2,803rd
3-Point Fieldgoals Made Per 48
4.0
1,968th
3-Point Fieldgoals Attempted Per 48
13.2
1,939th
Freethrows Made Per 48
0.0
3,964th
Freethrows Attempted Per 48
0.0
4,012th
Points Scored Per 48
14.4
2,985th
Offensive Rebounds Per 48
0.8
3,436th
Assists Per 48
5.6
2,284th
Turnovers
0.8
3,504th
P/40
12.0
—
A/40
4.7
—
04 / EFFICIENCY, SHOOTING PROFILE, PER-36
Advanced metrics
True shooting %45.0%
Effective FG %45.0%
2-point FG %33.3%
3-point attempt rate82.0%
Free throw rate0.0%
Points per shot attempt0.90
% of points from 3s86.7%
Assist-to-turnover6.00
Points per 36 min10.8
Rebounds per 36 min2.4
Assists per 36 min4.3
Steals per 36 min1.92
Blocks per 36 min0.24
Turnovers per 36 min0.72
Stocks (STL + BLK) per game0.90
Pts + Reb + Ast per game7.3
Efficiency (EFF) per game4.5
Game Score per game (Hollinger)3.5
Minutes per game15.0
Calculated by BallersCulture from the supplied 2026-27 box-score totals using standard formulas (hover a tile to see the formula). Tracking-based metrics such as BPM, VORP, on/off and RAPTOR are not available from this data source.
05 / 8 GAMES IN 2026-27
Game log: Regular season
Date
Opp
Result
MIN
FG
FG%
3PT
3P%
FT
FT%
REB
AST
BLK
STL
PF
TO
PTS
Nov 14
vs MIL
W 107-99
17
2-5
40.0
1-4
25.0
0-0
0.0
2
2
1
1
1
0
5
Nov 12
@ UTAH
W 123-108
28
4-12
33.3
3-10
30.0
0-0
0.0
3
4
0
2
4
0
11
Nov 11
@ SAC
W 107-100
4
0-1
0.0
0-1
0.0
0-0
0.0
0
0
0
0
1
1
0
Nov 8
@ GS
L 126-119 OT
15
3-7
42.9
3-7
42.9
0-0
0.0
1
0
0
1
0
0
9
Nov 6
@ PHX
L 117-104
3
0-0
0.0
0-0
0.0
0-0
0.0
0
0
0
0
0
0
0
Nov 3
vs WSH
L 103-94
18
2-7
28.6
1-4
25.0
0-0
0.0
1
4
0
0
0
0
5
Oct 29
@ TOR
L 129-99
22
2-6
33.3
2-6
33.3
0-0
0.0
0
3
0
0
2
1
6
Oct 24
vs MIN
L 115-93
13
0-2
0.0
0-1
0.0
0-0
0.0
1
1
0
2
0
0
0
06 / 2026-27 HOME / AWAY, RESULTS, MONTHS AND OPPONENTS
Splits
split
Split
GP
MIN
FG
FG%
3PT
3P%
FT
FT%
OR
DR
REB
AST
BLK
STL
PF
TO
PTS
All Splits
8
15.0
1.6-5.0
32.5
1.3-4.1
30.3
0.0-0.0
0.0
0.3
0.8
1.0
1.8
0.1
0.8
1.0
0.3
4.5
Home
3
16.0
1.3-4.7
28.6
0.7-3.0
22.2
0.0-0.0
0.0
0.0
1.3
1.3
2.3
0.3
1.0
0.3
0.0
3.3
Road
5
14.2
1.8-5.2
34.6
1.6-4.8
33.3
0.0-0.0
0.0
0.4
0.4
0.8
1.4
0.0
0.6
1.4
0.4
5.2
vs. Division
1
18.0
2.0-7.0
28.6
1.0-4.0
25.0
0.0-0.0
0.0
0.0
1.0
1.0
4.0
0.0
0.0
0.0
0.0
5.0
vs. Conference
3
19.0
2.0-6.0
33.3
1.3-4.7
28.6
0.0-0.0
0.0
0.0
1.0
1.0
3.0
0.3
0.3
1.0
0.3
5.3
3+ Days Rest
3
17.7
1.3-5.0
26.7
1.0-3.7
27.3
0.0-0.0
0.0
0.0
0.7
0.7
2.7
0.0
0.7
0.7
0.3
3.7
Month
Split
GP
MIN
FG
FG%
3PT
3P%
FT
FT%
OR
DR
REB
AST
BLK
STL
PF
TO
PTS
October
2
17.5
1.0-4.0
25.0
1.0-3.5
28.6
0.0-0.0
0.0
0.0
0.5
0.5
2.0
0.0
1.0
1.0
0.5
3.0
November
6
14.0
1.8-5.3
34.4
1.3-4.3
30.8
0.0-0.0
0.0
0.3
0.8
1.2
1.7
0.2
0.7
1.0
0.2
5.0
Pre All-Star
8
15.0
1.6-5.0
32.5
1.3-4.1
30.3
0.0-0.0
0.0
0.3
0.8
1.0
1.8
0.1
0.8
1.0
0.3
4.5
Result
Split
GP
MIN
FG
FG%
3PT
3P%
FT
FT%
OR
DR
REB
AST
BLK
STL
PF
TO
PTS
Wins
3
16.3
2.0-6.0
33.3
1.3-5.0
26.7
0.0-0.0
0.0
0.3
1.3
1.7
2.0
0.3
1.0
2.0
0.3
5.3
Losses
5
14.2
1.4-4.4
31.8
1.2-3.6
33.3
0.0-0.0
0.0
0.2
0.4
0.6
1.6
0.0
0.6
0.4
0.2
4.0
Day
Split
GP
MIN
FG
FG%
3PT
3P%
FT
FT%
OR
DR
REB
AST
BLK
STL
PF
TO
PTS
Monday
1
18.0
2.0-7.0
28.6
1.0-4.0
25.0
0.0-0.0
0.0
0.0
1.0
1.0
4.0
0.0
0.0
0.0
0.0
5.0
Tuesday
1
4.0
0.0-1.0
0.0
0.0-1.0
0.0
0.0-0.0
0.0
0.0
0.0
0.0
0.0
0.0
0.0
1.0
1.0
0.0
Wednesday
2
24.5
3.0-9.0
33.3
2.5-8.0
31.3
0.0-0.0
0.0
0.5
1.0
1.5
3.5
0.0
1.0
3.0
0.5
8.5
Thursday
1
3.0
0.0-0.0
0.0
0.0-0.0
0.0
0.0-0.0
0.0
0.0
0.0
0.0
0.0
0.0
0.0
0.0
0.0
0.0
Friday
2
15.5
1.0-3.5
28.6
0.5-2.5
20.0
0.0-0.0
0.0
0.0
1.5
1.5
1.5
0.5
1.5
0.5
0.0
2.5
Saturday
1
15.0
3.0-7.0
42.9
3.0-7.0
42.9
0.0-0.0
0.0
1.0
0.0
1.0
0.0
0.0
1.0
0.0
0.0
9.0
Opponent
Split
GP
MIN
FG
FG%
3PT
3P%
FT
FT%
OR
DR
REB
AST
BLK
STL
PF
TO
PTS
Golden State Warriors
1
15.0
3.0-7.0
42.9
3.0-7.0
42.9
0.0-0.0
0.0
1.0
0.0
1.0
0.0
0.0
1.0
0.0
0.0
9.0
Milwaukee Bucks
1
17.0
2.0-5.0
40.0
1.0-4.0
25.0
0.0-0.0
0.0
0.0
2.0
2.0
2.0
1.0
1.0
1.0
0.0
5.0
Minnesota Timberwolves
1
13.0
0.0-2.0
0.0
0.0-1.0
0.0
0.0-0.0
0.0
0.0
1.0
1.0
1.0
0.0
2.0
0.0
0.0
0.0
Phoenix Suns
1
3.0
0.0-0.0
0.0
0.0-0.0
0.0
0.0-0.0
0.0
0.0
0.0
0.0
0.0
0.0
0.0
0.0
0.0
0.0
Sacramento Kings
1
4.0
0.0-1.0
0.0
0.0-1.0
0.0
0.0-0.0
0.0
0.0
0.0
0.0
0.0
0.0
0.0
1.0
1.0
0.0
Toronto Raptors
1
22.0
2.0-6.0
33.3
2.0-6.0
33.3
0.0-0.0
0.0
0.0
0.0
0.0
3.0
0.0
0.0
2.0
1.0
6.0
Utah Jazz
1
28.0
4.0-12.0
33.3
3.0-10.0
30.0
0.0-0.0
0.0
1.0
2.0
3.0
4.0
0.0
2.0
4.0
0.0
11.0
Washington Wizards
1
18.0
2.0-7.0
28.6
1.0-4.0
25.0
0.0-0.0
0.0
0.0
1.0
1.0
4.0
0.0
0.0
0.0
0.0
5.0
07 / SEASON-BY-SEASON HISTORY
Career statistics
Regular Season Averages
Season
Team
GP
GS
MIN
FG
FG%
3PT
3P%
FT
FT%
OR
DR
REB
AST
BLK
STL
PF
TO
PTS
2018-19
Memphis Grizzlies
39
3
14.8
1.4-4.7
30.3
0.9-2.6
33.3
0.7-0.8
81.3
0.4
1.3
1.7
1.8
0.3
0.7
1.4
0.8
4.4
2019-20
Phoenix Suns
58
2
16.3
1.7-4.2
41.6
1.1-2.5
42.5
0.4-0.5
85.2
0.5
1.5
2.0
1.4
0.3
0.8
1.5
0.6
4.9
2020-21
Phoenix Suns
60
1
12.0
1.6-3.7
42.2
0.9-2.5
37.1
0.1-0.1
57.1
0.3
1.3
1.5
1.2
0.2
0.5
0.9
0.3
4.1
2021-22
Brooklyn Nets
46
1
12.0
1.3-3.8
33.3
0.9-2.8
33.1
0.2-0.2
70.0
0.2
1.3
1.5
1.0
0.2
0.3
1.0
0.6
3.6
2021-22
Milwaukee Bucks
20
2
17.7
2.0-4.0
50.6
1.2-2.2
55.8
0.4-0.4
100.0
0.3
1.9
2.2
2.5
0.2
0.5
1.1
0.4
5.6
2021-22
2021 22 Totals
66
3
13.7
1.5-3.8
38.7
1.0-2.6
38.8
0.2-0.3
83.3
0.2
1.5
1.7
1.5
0.2
0.4
1.0
0.5
4.2
2022-23
Boston Celtics
1
0
0.0
0.0-0.0
0.0
0.0-0.0
0.0
2.0-2.0
100.0
0.0
0.0
0.0
0.0
0.0
0.0
0.0
0.0
2.0
2022-23
Milwaukee Bucks
81
39
22.4
3.0-7.0
42.3
1.8-4.2
42.1
0.4-0.5
81.6
0.4
2.1
2.5
2.4
0.4
0.8
2.0
1.0
8.0
2022-23
2022 23 Totals
81
39
22.4
3.0-7.0
42.3
1.8-4.2
42.1
0.4-0.5
81.6
0.4
2.1
2.5
2.4
0.4
0.8
2.0
1.0
8.0
2023-24
Chicago Bulls
72
0
13.9
1.9-5.1
37.8
1.1-3.3
32.9
0.1-0.1
57.1
0.2
0.7
0.8
1.3
0.2
0.5
1.0
0.5
5.0
2024-25
Chicago Bulls
36
1
8.9
1.5-4.1
37.7
1.0-2.9
33.3
0.2-0.3
80.0
0.1
1.0
1.1
1.1
0.1
0.4
0.4
0.3
4.3
2025-26
Chicago Bulls
23
0
11.0
1.8-4.5
39.8
1.4-3.4
41.0
0.4-0.4
100.0
0.2
0.9
1.1
0.8
0.1
0.6
0.8
0.5
5.4
2025-26
Orlando Magic
30
1
20.4
2.7-6.8
40.2
1.5-4.6
33.6
0.2-0.3
55.6
0.3
1.8
2.1
2.3
0.3
0.9
1.3
0.8
7.2
2025-26
2025 26 Totals
53
1
16.4
2.3-5.8
40.1
1.5-4.1
36.3
0.3-0.4
78.9
0.3
1.4
1.7
1.6
0.2
0.8
1.1
0.7
6.4
2026-27
Orlando Magic
8
0
15.0
1.6-5.0
32.5
1.3-4.1
30.3
0.0-0.0
0.0
0.3
0.8
1.0
1.8
0.1
0.8
1.0
0.3
4.5
Career
—
474
50
15.3
1.9-4.9
39.4
1.2-3.1
37.5
0.3-0.3
80.0
0.3
1.4
1.7
1.6
0.2
0.6
1.2
0.6
5.3
Regular Season Totals
Season
Team
FG
FG%
3PT
3P%
FT
FT%
OR
DR
REB
AST
BLK
STL
PF
TO
PTS
2018-19
Memphis Grizzlies
56-185
30.3
34-102
33.3
26-32
81.3
14
52
66
69
11
26
55
33
172
2019-20
Phoenix Suns
101-243
41.6
62-146
42.5
23-27
85.2
30
88
118
84
17
47
86
32
287
2020-21
Phoenix Suns
94-223
42.2
56-151
37.1
4-7
57.1
16
76
92
71
9
29
56
16
248
2021-22
Brooklyn Nets
58-174
33.3
42-127
33.1
7-10
70.0
9
58
67
46
10
14
45
26
165
2021-22
Milwaukee Bucks
40-79
50.6
24-43
55.8
8-8
100.0
5
38
43
50
4
10
22
8
112
2021-22
2021 22 Totals
98-253
38.7
66-170
38.8
15-18
83.3
14
96
110
96
14
24
67
34
277
2022-23
Boston Celtics
0-0
0.0
0-0
0.0
2-2
100.0
0
0
0
0
0
0
0
0
2
2022-23
Milwaukee Bucks
239-565
42.3
142-337
42.1
31-38
81.6
35
167
202
197
29
66
158
78
651
2022-23
2022 23 Totals
239-565
42.3
142-337
42.1
31-38
81.6
35
167
202
197
29
66
158
78
651
2023-24
Chicago Bulls
138-365
37.8
77-234
32.9
4-7
57.1
11
49
60
94
16
37
71
36
357
2024-25
Chicago Bulls
55-146
37.7
35-105
33.3
8-10
80.0
4
35
39
40
3
13
15
11
153
2025-26
Chicago Bulls
41-103
39.8
32-78
41.0
10-10
100.0
5
21
26
19
2
13
19
11
124
2025-26
Orlando Magic
82-204
40.2
46-137
33.6
5-9
55.6
9
54
63
68
8
27
38
25
215
2025-26
2025 26 Totals
123-307
40.1
78-215
36.3
15-19
78.9
14
75
89
87
10
40
57
36
339
2026-27
Orlando Magic
13-40
32.5
10-33
30.3
0-0
0.0
2
6
8
14
1
6
8
2
36
Career
—
917-2327
39.4
560-1493
37.5
128-160
80.0
140
644
784
752
110
288
573
278
2522
Regular Season Misc Totals
Season
Team
DD2
TD3
DQ
EJECT
TECH
FLAG
AST/TO
STL/TO
SC-EFF
SH-EFF
2018-19
Memphis Grizzlies
0
0
0
0
0
0
2.1
0.8
0.930
0.39
2019-20
Phoenix Suns
0
0
0
0
2
1
2.6
1.5
1.181
0.54
2020-21
Phoenix Suns
1
0
0
0
1
0
4.4
1.8
1.112
0.55
2021-22
Brooklyn Nets
0
0
0
0
0
0
1.8
0.5
0.948
0.45
2021-22
Milwaukee Bucks
0
0
0
0
0
0
6.3
1.3
1.418
0.66
2021-22
2021 22 Totals
0
0
0
0
0
0
2.8
0.7
1.095
0.52
2022-23
Milwaukee Bucks
1
0
1
0
2
0
2.5
0.8
1.152
0.55
2023-24
Chicago Bulls
1
0
0
0
1
0
2.6
1.0
0.978
0.48
2024-25
Chicago Bulls
0
0
0
0
0
0
3.6
1.2
1.048
0.50
2025-26
Chicago Bulls
0
0
0
0
0
0
1.7
1.2
1.204
0.55
2025-26
Orlando Magic
0
0
0
0
0
0
2.7
1.1
1.054
0.51
2025-26
2025 26 Totals
0
0
0
0
0
0
2.4
1.1
1.104
0.53
2026-27
Orlando Magic
0
0
0
0
0
0
7.0
3.0
0.900
0.45
Career
—
3
0
1
0
6
1
2.7
1.0
1.084
0.51
Scoring, rebounding and assist trend
08 / SHOT CHART AND ZONE SHOOTING
Shot profile
Shot-location data is not connected. Add a BALLDONTLIE GOAT-tier NBA API key in NBA Players → Settings to enable shot charts and zone shooting.
LATEST UPDATECarter ended Wednesday's 123-108 win over Utah with 11 points (4-12 FG, 3-10 3Pt), three rebounds, four assists and two steals across 28 minutes.
It was a season-best outing by Carter, who tallied season highs in points, boards and swipes while matching his most dimes of the year. The veteran point guard could be pushing the struggling Jase Richardson for reserve minutes and is worth monitoring in deeper fantasy leagues.




 Alex MoralesG #30
 Anthony BlackG
 Colin CastletonC #14
 Desmond BaneG #3
 Franz WagnerF #22
 Goga BitadzeC #35
 Izaiyah NelsonF #25
 Jalen SuggsG #4
 Jamal CainF #8
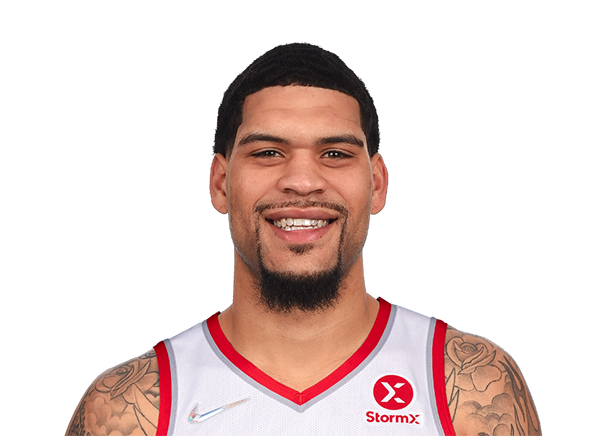 Jarron CumberlandG #34
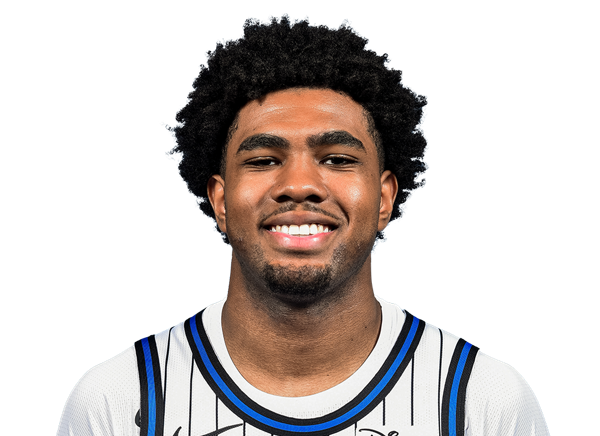 Jase RichardsonG #11
 JD DavisonG #20
 Jonathan IsaacF #1
 Kevin Knox IIF #24
 Malaki BranhamF #12
 Mike SharavjamtsG
 Nikola VucevicC #9
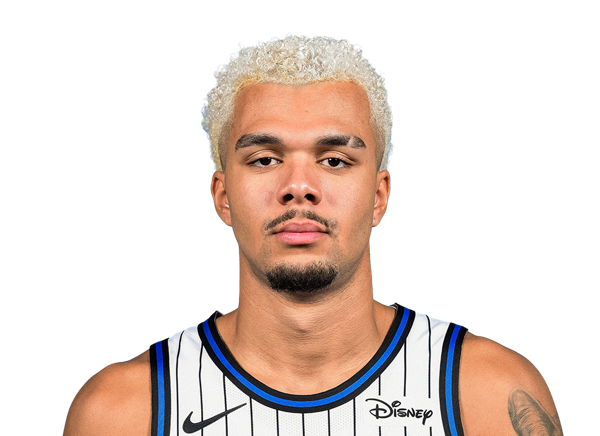 Noah PendaF #93
 Paolo BancheroF #5
 Tristan da SilvaF #23
 Wendell Carter Jr.C #34