Click a season to open this player’s full game log, splits and advanced stats for that year; click a team to open its page. A dash means no NBA games were recorded.
03 / EVERY CATEGORY THE PROVIDER REPORTS
Full statistical breakdown
Regular season 2026-27
Defensive
Metric
Total
NBA rank
Blocks
9
Tied-61st
Defensive Rebounds
24
Tied-216th
Steals
17
Tied-23rd
Defensive Rebound Rate
0.0
—
Defensive Rebounds Per Game
1.8
Tied-216th
Blocks Per Game
0.7
Tied-78th
Steals Per Game
1.3
28th
Defensive Rebounds Per 48
3.0
Tied-10,368th
Blocks Per 48
1.1
Tied-2,928th
Steals Per 48
2.1
Tied-1,104th
General
Metric
Total
NBA rank
Disqualifications
0
Tied-21st
Flagrant Fouls
0
Tied-22nd
Fouls
25
Tied-154th
Player Efficiency Rating
16.37
112th
Rebound Rate
0.0
—
Ejections
0
Tied-7th
Technical Fouls
0
Tied-101st
Rebounds
39
—
Value Over Replacement Player
0.0
—
Minutes
381
1st
Minutes Per Game
29.3
—
Rating
25.2
Tied-16th
Plus-Minus
+110
Tied-1st
Rebounds Per Game
3.0
Tied-194th
Fouls Per Game
1.9
Tied-175th
Flagrant Fouls Per Game
0.0
Tied-19th
Technical Fouls Per Game
0.0
Tied-82nd
Ejections Per Game
0.0
Tied-6th
Disqualifications Per Game
0.0
Tied-20th
Assist To Turnover Ratio
2.4
—
Steal To Foul Ratio
0.7
—
Block To Foul Ratio
0.4
—
Team Rebounds Per Game
0.0
—
Rebounds
39
—
Total Technical Fouls
0
—
Assist To Turnover Ratio
0.0
—
Steal To Turnover Ratio
0.6
—
Rebounds Per 48 Minutes
4.9
—
Fouls Per 48 Minutes
3.1
Tied-7,392nd
Flagrant Fouls Per 48 Minutes
0.0
Tied-1,056th
Technical Fouls Per 48 Minutes
0.0
Tied-4,848th
Ejections Per 48 Minutes
0.0
Tied-336th
Disqualifications Per 48 Minutes
0.0
Tied-1,008th
R/40
4.1
—
Games Played
13
13th
Games Started
13
Tied-22nd
Double Double
0
Tied-119th
Triple Double
0
Tied-12th
Offensive
Metric
Total
NBA rank
Assists
65
36th
Effective Field Goal Percentage
53.6
—
Field Goals
62/139
—
Field Goals Attempted
139
Tied-79th
Field Goals Made
62
Tied-78th
Field Goal Percentage
44.6
Tied-87th
Free Throws
20/20
—
Free Throw Percentage
100.0
Tied-1st
Free Throws Attempted
20
Tied-172nd
Free Throws Made
20
Tied-129th
Offensive Rebounds
15
Tied-94th
Points
169
Tied-84th
Turnovers
27
Tied-57th
3-Point Field Goal Percentage
34.7
138th
3-Point Field Goals Attempted
72
55th
3-Point Field Goals Made
25
Tied-64th
True Shooting Percentage
57.2
—
Total Turnovers
27
—
Assist Ratio
27.1
—
Points in the Paint
0
Tied-1st
Offensive Rebound Rate
0.0
—
Turnover Ratio
11.3
—
Brick Index
0.00
—
Usage Rate
0.0
—
Average Field Goals Made
4.8
92nd
Average Field Goals Attempted
10.7
368th
Average 3-Point Field Goals Made
1.9
Tied-84th
Average 3-Point Field Goals Attempted
5.5
64th
Average Free Throws Made
1.5
Tied-135th
Average Free Throws Attempted
1.5
Tied-172nd
Points Per Game
13.0
Tied-97th
Offensive Rebounds Per Game
1.2
Tied-104th
Assists Per Game
5.0
Tied-40th
Turnovers Per Game
2.1
64th
Offensive Rebound Percentage
0.2
—
Estimated Possessions
159.0
—
Estimated Possessions Per Game
12.2
—
Points Per Estimated Possession
1.1
—
Team Turnovers Per Game
0.0
—
Total Turnovers Per Game
2.1
—
3-Point Field Goal Percentage
34.7
114th
2-Point Field Goals Made
37.0
Tied-14th
2-Point Field Goals Attempted
67.0
Tied-134th
2-Point Field Goals Made per Game
2.8
—
2-Point Field Goals Attempted per Game
5.2
—
2-Point Field Goal Percentage
55.2
—
Shooting Efficiency
0.54
—
Scoring Efficiency
1.216
—
Fieldgoals Made Per 48
7.8
Tied-3,744th
Fieldgoals Attempted Per 48
17.5
Tied-3,792nd
3-Point Fieldgoals Made Per 48
3.1
Tied-3,072nd
3-Point Fieldgoals Attempted Per 48
9.1
2,640th
Freethrows Made Per 48
2.5
Tied-6,192nd
Freethrows Attempted Per 48
2.5
Tied-8,256th
Points Scored Per 48
21.3
Tied-4,032nd
Offensive Rebounds Per 48
1.9
Tied-4,512th
Assists Per 48
8.2
1,728th
Turnovers
3.4
Tied-2,736th
P/40
17.7
—
A/40
6.8
—
04 / EFFICIENCY, SHOOTING PROFILE, PER-36
Advanced metrics
True shooting %57.2%
Effective FG %53.7%
2-point FG %55.8%
3-point attempt rate51.4%
Free throw rate14.0%
Points per shot attempt1.21
% of points from 3s43.8%
Assist-to-turnover2.38
Points per 36 min16.0
Rebounds per 36 min3.7
Assists per 36 min6.1
Steals per 36 min1.60
Blocks per 36 min0.86
Turnovers per 36 min2.58
Stocks (STL + BLK) per game2.00
Pts + Reb + Ast per game21.0
Efficiency (EFF) per game15.0
Game Score per game (Hollinger)11.2
Minutes per game29.3
Calculated by BallersCulture from the supplied 2026-27 box-score totals using standard formulas (hover a tile to see the formula). Tracking-based metrics such as BPM, VORP, on/off and RAPTOR are not available from this data source.
05 / 13 GAMES IN 2026-27
Game log: Regular season
Date
Opp
Result
MIN
FG
FG%
3PT
3P%
FT
FT%
REB
AST
BLK
STL
PF
TO
PTS
Nov 16
vs DAL
W 131-94
23
6-11
54.5
4-9
44.4
0-0
0.0
4
2
0
2
3
0
16
Nov 12
@ TOR
W 98-93
38
7-15
46.7
3-7
42.9
2-2
100.0
1
7
4
1
1
2
19
Nov 11
@ PHI
W 123-101
22
2-6
33.3
1-4
25.0
0-0
0.0
1
3
0
0
4
1
5
Nov 9
@ MIL
W 117-97
27
4-10
40.0
1-5
20.0
0-0
0.0
3
7
2
2
3
1
9
Nov 7
@ CHA
W 119-80
25
6-10
60.0
4-6
66.7
2-2
100.0
4
5
0
1
2
2
18
Nov 5
vs MIL
W 109-102
36
7-18
38.9
1-7
14.3
9-9
100.0
4
7
2
1
4
2
24
Nov 3
@ HOU
L 109-93
30
3-12
25.0
1-5
20.0
0-0
0.0
2
3
0
1
0
3
7
Nov 2
@ ORL
W 108-97
34
4-8
50.0
2-5
40.0
2-2
100.0
2
2
0
2
1
1
12
Oct 31
vs CHI
W 125-111
26
4-6
66.7
1-2
50.0
0-0
0.0
2
4
0
2
1
1
9
Oct 28
vs BKN
W 125-124 OT
33
5-15
33.3
1-7
14.3
5-5
100.0
5
7
0
0
1
3
16
Oct 27
vs CHI
W 134-99
18
2-4
50.0
1-2
50.0
0-0
0.0
6
4
1
3
1
6
5
Oct 24
vs NY
W 107-103
33
5-11
45.5
2-6
33.3
0-0
0.0
4
6
0
1
2
1
12
Oct 21
@ DET
L 121-113
36
7-13
53.8
3-7
42.9
0-0
0.0
1
8
0
1
2
4
17
06 / 2026-27 HOME / AWAY, RESULTS, MONTHS AND OPPONENTS
Splits
split
Split
GP
MIN
FG
FG%
3PT
3P%
FT
FT%
OR
DR
REB
AST
BLK
STL
PF
TO
PTS
All Splits
13
29.3
4.8-10.7
44.6
1.9-5.5
34.7
1.5-1.5
100.0
1.2
1.8
3.0
5.0
0.7
1.3
1.9
2.1
13.0
Home
6
28.2
4.8-10.8
44.6
1.7-5.5
30.3
2.3-2.3
100.0
1.5
2.7
4.2
5.0
0.5
1.5
2.0
2.2
13.7
Road
7
30.4
4.7-10.6
44.6
2.1-5.6
38.5
0.9-0.9
100.0
0.9
1.1
2.0
5.0
0.9
1.1
1.9
2.0
12.4
vs. Division
4
31.8
4.8-11.8
40.4
1.8-6.0
29.2
1.8-1.8
100.0
1.3
1.5
2.8
5.8
1.0
0.5
2.0
1.8
13.0
vs. Conference
11
29.9
4.8-10.5
45.7
1.8-5.3
34.5
1.8-1.8
100.0
1.2
1.8
3.0
5.5
0.8
1.3
2.0
2.2
13.3
3+ Days Rest
2
29.5
6.5-12.0
54.2
3.5-8.0
43.8
0.0-0.0
0.0
1.5
1.0
2.5
5.0
0.0
1.5
2.5
2.0
16.5
Month
Split
GP
MIN
FG
FG%
3PT
3P%
FT
FT%
OR
DR
REB
AST
BLK
STL
PF
TO
PTS
October
5
29.2
4.6-9.8
46.9
1.6-4.8
33.3
1.0-1.0
100.0
1.4
2.2
3.6
5.8
0.2
1.4
1.4
3.0
11.8
November
8
29.4
4.9-11.3
43.3
2.1-6.0
35.4
1.9-1.9
100.0
1.0
1.6
2.6
4.5
1.0
1.3
2.3
1.5
13.8
Pre All-Star
13
29.3
4.8-10.7
44.6
1.9-5.5
34.7
1.5-1.5
100.0
1.2
1.8
3.0
5.0
0.7
1.3
1.9
2.1
13.0
Result
Split
GP
MIN
FG
FG%
3PT
3P%
FT
FT%
OR
DR
REB
AST
BLK
STL
PF
TO
PTS
Wins
11
28.7
4.7-10.4
45.6
1.9-5.5
35.0
1.8-1.8
100.0
1.3
2.0
3.3
4.9
0.8
1.4
2.1
1.8
13.2
Losses
2
33.0
5.0-12.5
40.0
2.0-6.0
33.3
0.0-0.0
0.0
0.5
1.0
1.5
5.5
0.0
1.0
1.0
3.5
12.0
Position
Split
GP
MIN
FG
FG%
3PT
3P%
FT
FT%
OR
DR
REB
AST
BLK
STL
PF
TO
PTS
As Starter
13
29.3
4.8-10.7
44.6
1.9-5.5
34.7
1.5-1.5
100.0
1.2
1.8
3.0
5.0
0.7
1.3
1.9
2.1
13.0
Day
Split
GP
MIN
FG
FG%
3PT
3P%
FT
FT%
OR
DR
REB
AST
BLK
STL
PF
TO
PTS
Monday
2
24.0
2.5-8.0
31.3
1.0-3.5
28.6
0.0-0.0
0.0
1.0
3.0
4.0
3.5
0.5
2.0
0.5
4.5
6.0
Tuesday
3
30.3
4.7-11.3
41.2
1.7-6.0
27.8
1.7-1.7
100.0
1.3
1.0
2.3
6.0
0.0
0.3
2.3
2.7
12.7
Wednesday
2
37.0
7.0-16.5
42.4
2.0-7.0
28.6
5.5-5.5
100.0
1.0
1.5
2.5
7.0
3.0
1.0
2.5
2.0
21.5
Friday
3
28.0
5.0-9.0
55.6
2.3-4.7
50.0
0.7-0.7
100.0
1.0
2.3
3.3
5.0
0.0
1.3
1.7
1.3
13.0
Sunday
3
28.0
4.7-9.7
48.3
2.3-6.3
36.8
0.7-0.7
100.0
1.3
1.7
3.0
3.7
0.7
2.0
2.3
0.7
12.3
Opponent
Split
GP
MIN
FG
FG%
3PT
3P%
FT
FT%
OR
DR
REB
AST
BLK
STL
PF
TO
PTS
Brooklyn Nets
1
33.0
5.0-15.0
33.3
1.0-7.0
14.3
5.0-5.0
100.0
3.0
2.0
5.0
7.0
0.0
0.0
1.0
3.0
16.0
Charlotte Hornets
1
25.0
6.0-10.0
60.0
4.0-6.0
66.7
2.0-2.0
100.0
2.0
2.0
4.0
5.0
0.0
1.0
2.0
2.0
18.0
Chicago Bulls
2
22.0
3.0-5.0
60.0
1.0-2.0
50.0
0.0-0.0
0.0
1.0
3.0
4.0
4.0
0.5
2.5
1.0
3.5
7.0
Dallas Mavericks
1
23.0
6.0-11.0
54.5
4.0-9.0
44.4
0.0-0.0
0.0
2.0
2.0
4.0
2.0
0.0
2.0
3.0
0.0
16.0
Detroit Pistons
1
36.0
7.0-13.0
53.8
3.0-7.0
42.9
0.0-0.0
0.0
1.0
0.0
1.0
8.0
0.0
1.0
2.0
4.0
17.0
Houston Rockets
1
30.0
3.0-12.0
25.0
1.0-5.0
20.0
0.0-0.0
0.0
0.0
2.0
2.0
3.0
0.0
1.0
0.0
3.0
7.0
Milwaukee Bucks
2
31.5
5.5-14.0
39.3
1.0-6.0
16.7
4.5-4.5
100.0
1.0
2.5
3.5
7.0
2.0
1.5
3.5
1.5
16.5
New York Knicks
1
33.0
5.0-11.0
45.5
2.0-6.0
33.3
0.0-0.0
0.0
1.0
3.0
4.0
6.0
0.0
1.0
2.0
1.0
12.0
Orlando Magic
1
34.0
4.0-8.0
50.0
2.0-5.0
40.0
2.0-2.0
100.0
1.0
1.0
2.0
2.0
0.0
2.0
1.0
1.0
12.0
Philadelphia 76ers
1
22.0
2.0-6.0
33.3
1.0-4.0
25.0
0.0-0.0
0.0
0.0
1.0
1.0
3.0
0.0
0.0
4.0
1.0
5.0
Toronto Raptors
1
38.0
7.0-15.0
46.7
3.0-7.0
42.9
2.0-2.0
100.0
1.0
0.0
1.0
7.0
4.0
1.0
1.0
2.0
19.0
07 / SEASON-BY-SEASON HISTORY
Career statistics
Regular Season Averages
Season
Team
GP
GS
MIN
FG
FG%
3PT
3P%
FT
FT%
OR
DR
REB
AST
BLK
STL
PF
TO
PTS
2017-18
San Antonio Spurs
17
0
8.2
0.9-1.9
48.5
0.5-0.8
61.5
0.8-1.2
70.0
0.3
1.2
1.5
0.5
0.2
0.2
0.5
0.4
3.2
2018-19
San Antonio Spurs
67
55
25.8
3.9-8.1
47.9
0.7-2.1
33.8
1.4-1.8
77.2
0.5
3.2
3.7
3.9
0.7
1.0
2.2
1.4
9.9
2019-20
San Antonio Spurs
68
20
24.7
3.7-8.1
45.8
1.2-3.2
36.6
2.6-3.1
85.3
0.5
2.8
3.3
3.5
0.9
0.6
2.2
1.3
11.3
2020-21
San Antonio Spurs
36
32
29.6
5.2-12.6
41.1
2.3-6.8
34.6
2.7-3.2
85.1
0.4
2.6
3.0
3.5
1.0
0.7
2.5
1.3
15.4
2021-22
San Antonio Spurs
49
48
30.3
5.0-11.6
42.6
1.7-5.3
31.4
2.8-3.3
86.9
0.5
3.0
3.5
5.6
0.9
1.0
2.4
1.8
14.4
2021-22
Boston Celtics
26
4
27.4
3.6-8.8
40.9
1.3-4.3
30.6
2.5-2.9
85.3
0.5
2.9
3.4
3.5
0.6
0.6
2.2
1.2
11.0
2021-22
2021 22 Totals
75
52
29.3
4.5-10.7
42.1
1.5-4.9
31.2
2.7-3.1
86.4
0.5
3.0
3.5
4.9
0.8
0.9
2.3
1.6
13.2
2022-23
Boston Celtics
82
70
28.3
4.3-9.2
46.2
1.8-4.8
38.1
2.0-2.3
87.5
0.6
2.9
3.6
3.9
0.9
0.7
2.2
1.2
12.4
2023-24
Boston Celtics
73
73
32.6
5.3-11.5
46.1
2.7-6.8
39.6
1.9-2.1
90.1
0.7
3.5
4.2
5.2
1.2
1.0
2.1
1.5
15.2
2024-25
Boston Celtics
76
76
33.9
5.6-12.6
44.2
3.5-9.1
38.4
1.8-2.1
83.9
0.9
3.6
4.5
4.8
1.1
0.9
1.8
1.7
16.4
2025-26
Boston Celtics
77
77
34.1
5.7-14.4
39.4
2.7-8.3
32.7
2.4-2.6
90.2
1.1
3.3
4.4
5.4
1.3
1.1
1.5
1.7
16.5
2026-27
Boston Celtics
13
13
29.3
4.8-10.7
44.6
1.9-5.5
34.7
1.5-1.5
100.0
1.2
1.8
3.0
5.0
0.7
1.3
1.9
2.1
13.0
Career
—
584
468
29.3
4.6-10.6
43.9
2.0-5.6
36.0
2.1-2.5
86.1
0.7
3.1
3.7
4.4
0.9
0.9
2.0
1.5
13.4
Regular Season Totals
Season
Team
FG
FG%
3PT
3P%
FT
FT%
OR
DR
REB
AST
BLK
STL
PF
TO
PTS
2017-18
San Antonio Spurs
16-33
48.5
8-13
61.5
14-20
70.0
5
21
26
9
3
4
8
6
54
2018-19
San Antonio Spurs
260-543
47.9
48-142
33.8
95-123
77.2
35
212
247
263
47
67
145
97
663
2019-20
San Antonio Spurs
253-552
45.8
79-216
36.6
180-211
85.3
35
188
223
241
59
44
152
89
765
2020-21
San Antonio Spurs
186-453
41.1
84-243
34.6
97-114
85.1
13
94
107
127
36
26
91
45
553
2021-22
San Antonio Spurs
243-570
42.6
81-258
31.4
139-160
86.9
25
148
173
274
42
49
116
87
706
2021-22
Boston Celtics
94-230
40.9
34-111
30.6
64-75
85.3
13
75
88
92
16
15
56
32
286
2021-22
2021 22 Totals
337-800
42.1
115-369
31.2
203-235
86.4
38
223
261
366
58
64
172
119
992
2022-23
Boston Celtics
350-758
46.2
149-391
38.1
168-192
87.5
52
241
293
321
76
54
177
95
1017
2023-24
Boston Celtics
387-839
46.1
196-495
39.6
137-152
90.1
51
259
310
377
87
74
152
112
1107
2024-25
Boston Celtics
424-959
44.2
265-691
38.4
135-161
83.9
67
274
341
361
80
72
138
131
1248
2025-26
Boston Celtics
437-1108
39.4
209-640
32.7
184-204
90.2
86
253
339
414
98
88
119
134
1267
2026-27
Boston Celtics
62-139
44.6
25-72
34.7
20-20
100.0
15
24
39
65
9
17
25
27
169
Career
—
2712-6184
43.9
1178-3272
36.0
1233-1432
86.1
397
1789
2186
2544
553
510
1179
855
7835
Regular Season Misc Totals
Season
Team
DD2
TD3
DQ
EJECT
TECH
FLAG
AST/TO
STL/TO
SC-EFF
SH-EFF
2017-18
San Antonio Spurs
0
0
0
0
0
0
1.5
0.7
1.636
0.61
2018-19
San Antonio Spurs
0
0
0
0
0
0
2.7
0.7
1.221
0.52
2019-20
San Antonio Spurs
0
0
0
0
0
0
2.7
0.5
1.386
0.53
2020-21
San Antonio Spurs
0
0
0
0
0
0
2.8
0.6
1.221
0.50
2021-22
San Antonio Spurs
2
0
0
0
0
0
3.1
0.6
1.239
0.50
2021-22
Boston Celtics
0
0
0
0
0
0
2.9
0.5
1.243
0.48
2021-22
2021 22 Totals
2
0
0
0
0
0
3.1
0.5
1.240
0.49
2022-23
Boston Celtics
7
0
0
0
0
0
3.4
0.6
1.342
0.56
2023-24
Boston Celtics
5
1
0
0
0
0
3.4
0.7
1.319
0.58
2024-25
Boston Celtics
4
0
0
0
1
0
2.8
0.5
1.301
0.58
2025-26
Boston Celtics
1
0
0
0
2
1
3.1
0.7
1.144
0.49
2026-27
Boston Celtics
0
0
0
0
0
0
2.4
0.6
1.216
0.54
Career
—
19
1
0
0
3
1
3.0
0.6
1.267
0.53
Scoring, rebounding and assist trend
08 / SHOT CHART AND ZONE SHOOTING
Shot profile
Shot-location data is not connected. Add a BALLDONTLIE GOAT-tier NBA API key in NBA Players → Settings to enable shot charts and zone shooting.
LATEST UPDATEWhite closed Sunday's 131-94 victory over Dallas with 16 points (6-11 FG, 4-9 3Pt), four rebounds, two assists and two steals in 23 minutes.
White helped Boston establish early control, and the Celtics' enormous advantage let their starters rest for much of the second half. His 23 minutes reflected the one-sided score more than a change in his responsibilities, so fantasy managers shouldn't worry too much about his reduced playing time, as he's logged fewer than 30 minutes in four of his last five appearances amid a dominant stretch for Boston. White continues to provide valuable three-point shooting and defensive production from the guard position, and Boston's six-game winning streak has given him plenty of opportunities to contribute without needing to carry the offense. White has also been trending in the right direction as a scorer, going 7-for-16 from deep in his last two games after a cold 8-for-27 stretch over five games between Nov. 2 and Nov. 10.




 Amari WilliamsF #77
 Baylor ScheiermanG #55
 Chris Cenac Jr.F #12
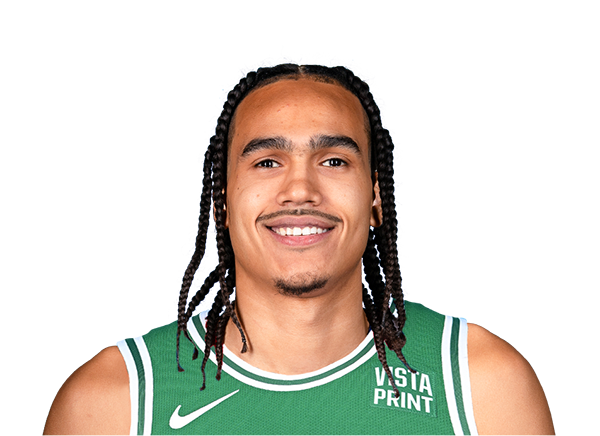 Dalano BantonF #45
 Devin CarterG #99
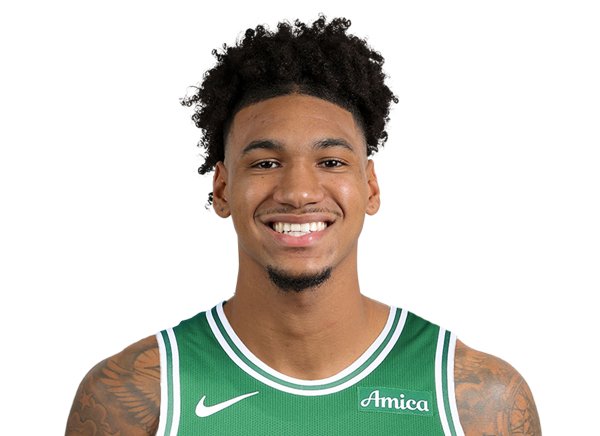 Dillon MitchellF #20
 Gabe McGlothanF #41
 Hayden GrayG #44
 Hugo GonzalezG #28
 Jayson TatumF
 Jordan SchakelG #20
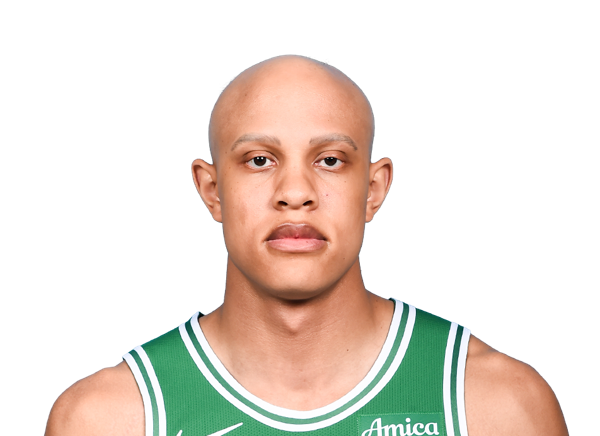 Jordan WalshG #27
 Luka GarzaC #52
 Max ShulgaG #44
 Mike ConleyG #45
 Milos UzanG #29
 Mitchell RobinsonC #4
 Neemias QuetaC #88
 Paul GeorgeF #13
 Payton PritchardG #11
 Ron Harper Jr.G #8
 Sam HauserF #30
 Tucker DeVriesF #26