


BALLERSCULTURE TEAM PAGE · 2026-27
Boston Celtics
2026-27: 56-26 (#2 Eastern) · 2nd in Atlantic Division · TD Garden
01 / SEASON BY SEASON
Record since 2022-23
| Season | W | L | PCT | Seed | Home | Away | Div | Conf | PPG | OPP | DIFF | Streak |
|---|---|---|---|---|---|---|---|---|---|---|---|---|
| 2022-23 | 51 | 31 | .622 | #2 Eastern | 28-13 | 23-18 | 9-7 | 33-19 | 111.8 | 104.5 | +7.3 | W1 |
| 2023-24 | 57 | 25 | .695 | #2 Eastern | 32-9 | 25-16 | 11-5 | 34-18 | 117.9 | 111.4 | +6.5 | W3 |
| 2024-25 | 64 | 18 | .780 | #1 Eastern | 37-4 | 27-14 | 15-2 | 41-11 | 120.6 | 109.2 | +11.4 | W2 |
| 2025-26 | 61 | 21 | .744 | #2 Eastern | 28-13 | 33-8 | 14-2 | 39-13 | 116.3 | 107.2 | +9.1 | W2 |
| 2026-27 | 56 | 26 | .683 | #2 Eastern | 30-11 | 26-15 | 10-6 | 36-16 | 114.9 | 107.2 | +7.7 | W2 |
Combined record since 2022-23: 289-121 (70.5%). Click a season to load that year’s stats, roster and results below. 2026-27 is still in progress.
02 / EVERY CATEGORY THE PROVIDER REPORTS
Team statistics 2026-27
Defensive
| Metric | Total | Per game | NBA rank |
|---|---|---|---|
| Blocks | 66 | 4.714 | 1st |
| Defensive Rebounds | 445 | 31.786 | Tied-2nd |
| Steals | 118 | 8.429 | 3rd |
| Points Conceded Off Turnovers | 0 | 15 | — |
| Defensive Rebound Rate | 0.0 | — | — |
| Defensive Rebounds Per Game | 31.8 | — | — |
| Blocks Per Game | 4.7 | — | — |
| Steals Per Game | 8.4 | — | — |
| Defensive Rebounds Per 48 | 0.0 | — | — |
| Blocks Per 48 | 0.0 | — | — |
| Steals Per 48 | 0.0 | — | — |
General
| Metric | Total | Per game | NBA rank |
|---|---|---|---|
| Disqualifications | 1 | — | Tied-2nd |
| Flagrant Fouls | 0 | — | — |
| Fouls | 298 | 21.286 | 4th |
| Rebound Rate | 53.0 | — | 2nd |
| Ejections | 0 | — | — |
| Technical Fouls | 20 | 0.714 | Tied-1st |
| Rebounds | 629 | 44.929 | — |
| Minutes | 0 | — | — |
| Minutes Per Game | 0.0 | — | — |
| Fantasy Rating | 0.0 | — | — |
| Rating | 213.9 | — | 1st |
| Plus-Minus | -1 | -1 | Tied-1st |
| Game Day of Year | 0 | — | — |
| Rebounds Per Game | 44.9 | — | — |
| Fouls Per Game | 21.3 | — | — |
| Flagrant Fouls Per Game | 0.0 | — | — |
| Technical Fouls Per Game | 1.4 | — | — |
| Ejections Per Game | 0.0 | — | — |
| Disqualifications Per Game | 0.1 | — | — |
| Assist To Turnover Ratio | 2.0 | 1.979 | — |
| Steal To Foul Ratio | 0.4 | 0.396 | — |
| Block To Foul Ratio | 0.2 | 0.221 | — |
| Team Rebounds Per Game | 0.0 | — | — |
| Rebounds | 629 | 44.929 | — |
| Total Technical Fouls | 20 | 0.714 | — |
| Assist To Turnover Ratio | 42.2 | — | — |
| Team Rebounds | 0 | — | — |
| Steal To Turnover Ratio | 0.6 | 0.615 | — |
| Rebounds Per 48 Minutes | 0.0 | — | — |
| Fouls Per 48 Minutes | 0.0 | — | — |
| Flagrant Fouls Per 48 Minutes | 0.0 | — | — |
| Technical Fouls Per 48 Minutes | 0.0 | — | — |
| Ejections Per 48 Minutes | 0.0 | — | — |
| Disqualifications Per 48 Minutes | 0.0 | — | — |
| Games Played | 14 | — | 2nd |
| Games Started | 0 | — | — |
| Double Double | 0 | — | — |
| Triple Double | 0 | — | — |
Offensive
| Metric | Total | Per game | NBA rank |
|---|---|---|---|
| Assists | 380 | 27.143 | 2nd |
| Effective Field Goal Percentage | 55.3 | — | 1st |
| Field Goals | 563/1231 | 0.457 | — |
| Field Goals Attempted | 1231 | 87.929 | 2nd |
| Field Goals Made | 563 | 40.214 | 2nd |
| Field Goal Percentage | 45.7 | 0.457 | 2nd |
| Free Throws | 246/318 | 0.774 | — |
| Free Throw Percentage | 77.4 | 0.774 | 3rd |
| Free Throws Attempted | 318 | 22.714 | 4th |
| Free Throws Made | 246 | 17.571 | Tied-3rd |
| Offensive Rebounds | 184 | 13.143 | 1st |
| Points | 1607 | 114.786 | 2nd |
| Turnovers | 192 | 13.714 | 2nd |
| 3-Point Field Goal Percentage | 38.2 | 0.382 | 1st |
| 3-Point Field Goals Attempted | 615 | 43.929 | 1st |
| 3-Point Field Goals Made | 235 | 16.786 | 1st |
| True Shooting Percentage | 58.6 | — | 1st |
| Team Turnovers | 9 | — | Tied-3rd |
| Total Turnovers | 201 | 13.714 | — |
| Assist Ratio | 19.5 | — | 1st |
| Points in the Paint | 540 | 38 | 4th |
| Offensive Rebound Rate | 31.9 | — | 1st |
| Turnover Ratio | 12.8 | — | 3rd |
| Fast Break Points | 147 | — | — |
| Possessions | 1388 | — | 2nd |
| Pace Factor | 94.7 | — | 5th |
| Average Field Goals Made | 40.2 | — | — |
| Average Field Goals Attempted | 87.9 | — | — |
| Average 3-Point Field Goals Made | 16.8 | — | — |
| Average 3-Point Field Goals Attempted | 43.9 | — | — |
| Average Free Throws Made | 17.6 | — | — |
| Average Free Throws Attempted | 22.7 | — | — |
| Points Per Game | 114.8 | — | — |
| Offensive Rebounds Per Game | 13.1 | — | — |
| Assists Per Game | 27.1 | — | — |
| Turnovers Per Game | 13.7 | — | — |
| Offensive Rebound Percentage | 0.3 | 0.275 | — |
| Estimated Possessions | 1375.2 | 97.586 | — |
| Estimated Possessions Per Game | 98.2 | — | — |
| Points Per Estimated Possession | 1.2 | 1.176 | — |
| Team Turnovers Per Game | 0.6 | — | — |
| Total Turnovers Per Game | 14.4 | — | — |
| 3-Point Field Goal Percentage | 38.2 | 0.382 | 1st |
| 2-Point Field Goals Made | 328.0 | 23.428 | 1st |
| 2-Point Field Goals Attempted | 616.0 | 44 | 1st |
| 2-Point Field Goals Made per Game | 23.4 | — | — |
| 2-Point Field Goals Attempted per Game | 44.0 | — | — |
| 2-Point Field Goal Percentage | 53.2 | 0.532 | 1st |
| Shooting Efficiency | 0.55 | 0.553 | — |
| Scoring Efficiency | 1.305 | 1.305 | — |
| Fieldgoals Made Per 48 | 0.0 | — | — |
| Fieldgoals Attempted Per 48 | 0.0 | — | — |
| 3-Point Fieldgoals Made Per 48 | 0.0 | — | — |
| 3-Point Fieldgoals Attempted Per 48 | 0.0 | — | — |
| Freethrows Made Per 48 | 0.0 | — | — |
| Freethrows Attempted Per 48 | 0.0 | — | — |
| Points Scored Per 48 | 0.0 | — | — |
| Offensive Rebounds Per 48 | 0.0 | — | — |
| Assists Per 48 | 0.0 | — | — |
| Turnovers | 0.0 | — | — |
03 / PLAYERS, POSITIONS AND NUMBERS
Roster 2026-27
Head coach: Joe Mazzulla
 Devin CarterG #99 · 6' 2" · 188 lbs
 Chris Cenac Jr.F #12 · 6' 11" · 240 lbs
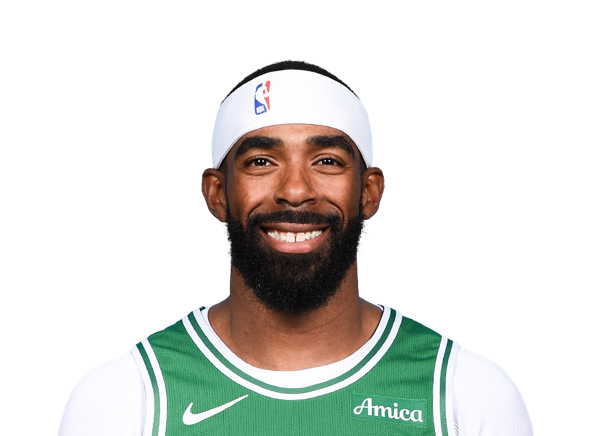 Mike ConleyG #45 · 6' 1" · 175 lbs
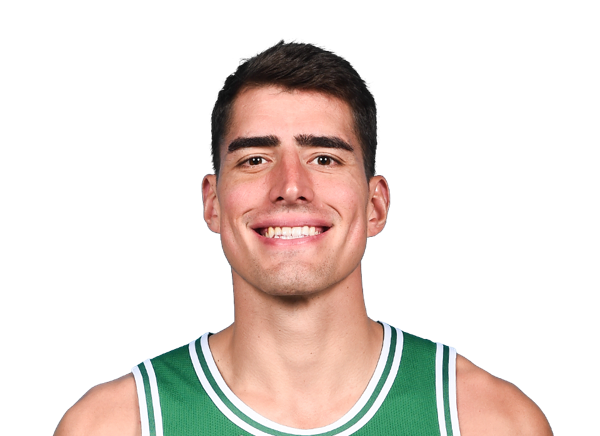 Luka GarzaC #52 · 6' 10" · 243 lbs
 Paul GeorgeF #13 · 6' 8" · 221 lbs
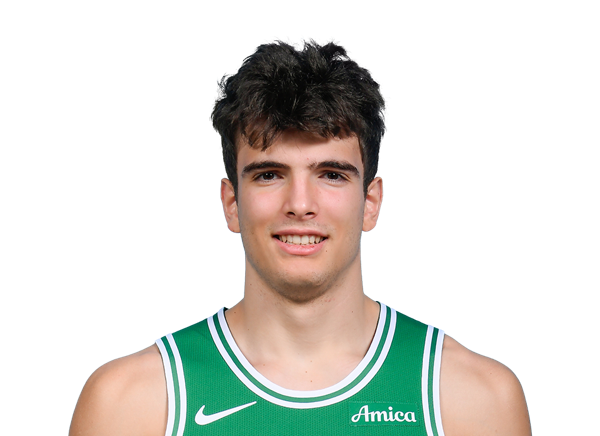 Hugo GonzalezG #28 · 6' 6" · 205 lbs
 Ron Harper Jr.G #8 · 6' 5" · 233 lbs
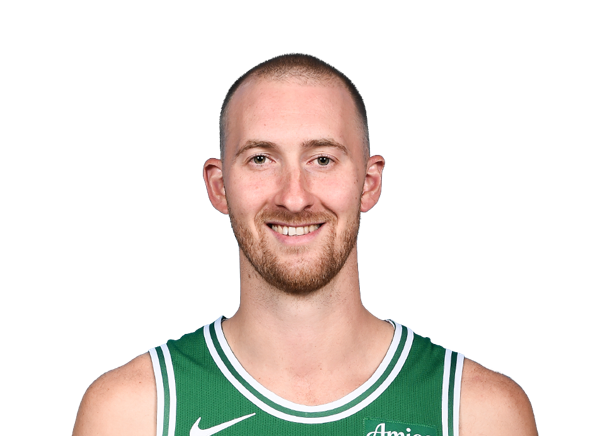 Sam HauserF #30 · 6' 8" · 221 lbs
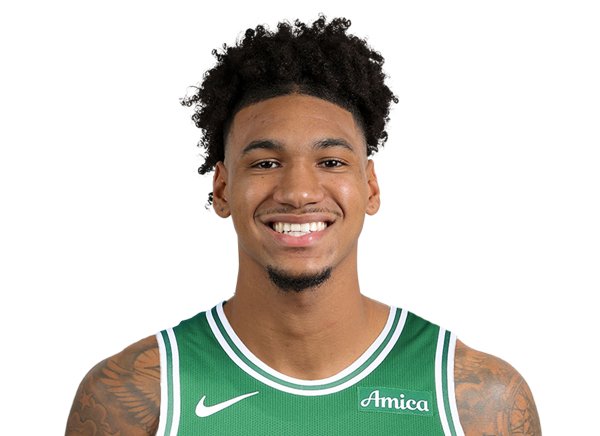 Dillon MitchellF #20 · 6' 8" · 210 lbs
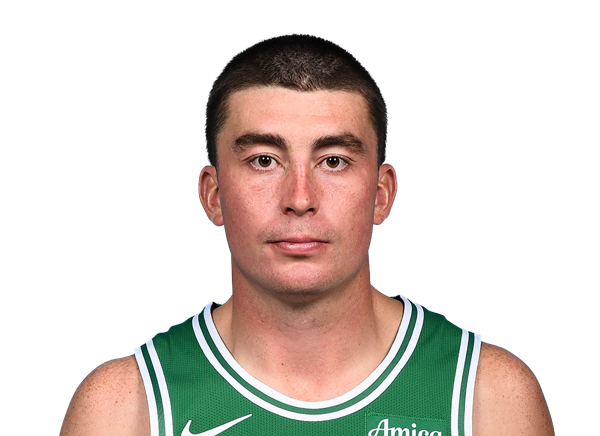 Payton PritchardG #11 · 6' 2" · 211 lbs
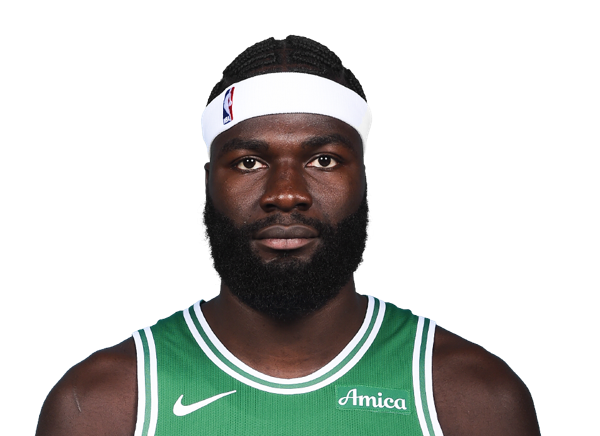 Neemias QuetaC #88 · 7' 0" · 260 lbs
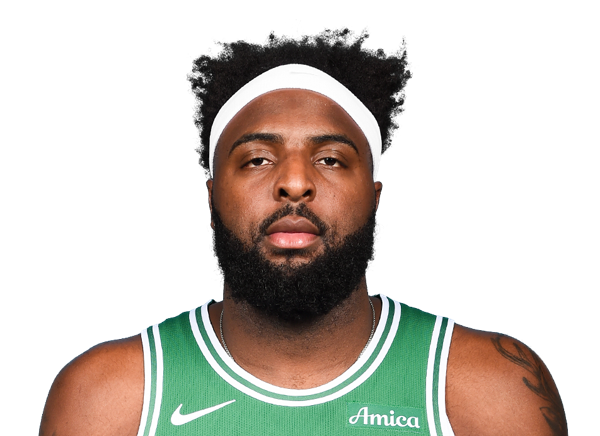 Mitchell RobinsonC #4 · 7' 0" · 240 lbs
 Baylor ScheiermanG #55 · 6' 6" · 213 lbs
 Jayson TatumF #0 · 6' 8" · 224 lbs
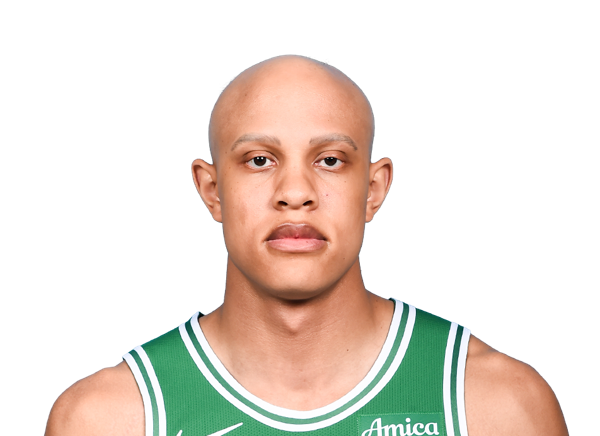 Jordan WalshG #27 · 6' 7" · 208 lbs
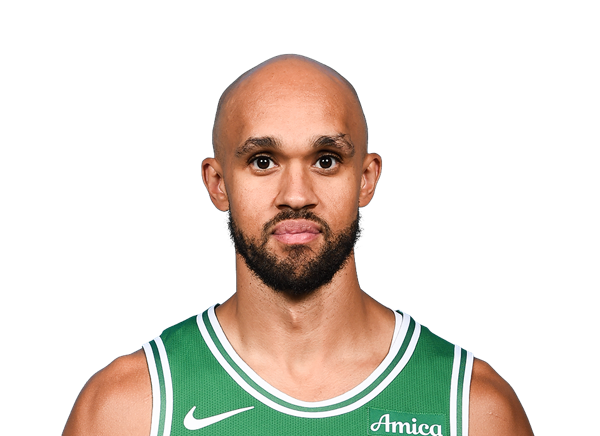 Derrick WhiteG #9 · 6' 4" · 200 lbs
 Amari WilliamsF #77 · 7' 0" · 262 lbs
04 / GAME-BY-GAME
Results 2026-27
Next game: at Denver Nuggets · Thu, Nov 19 · 3:30 pm
| Date | Opponent | Result | Score |
|---|---|---|---|
| Nov 17, 2026 | vs Orlando Magic | L | 105-115 |
| Nov 16, 2026 | vs Dallas Mavericks | W | 131-94 |
| Nov 12, 2026 | at Toronto Raptors | W | 98-93 |
| Nov 11, 2026 | at Philadelphia 76ers | W | 123-101 |
| Nov 9, 2026 | at Milwaukee Bucks | W | 117-97 |
| Nov 7, 2026 | at Charlotte Hornets | W | 119-80 |
| Nov 5, 2026 | vs Milwaukee Bucks | W | 109-102 |
| Nov 3, 2026 | at Houston Rockets | L | 93-109 |
| Nov 2, 2026 | at Orlando Magic | W | 108-97 |
| Oct 31, 2026 | vs Chicago Bulls | W | 125-111 |
| Oct 28, 2026 | vs Brooklyn Nets | W | 125-124 |
| Oct 27, 2026 | vs Chicago Bulls | W | 134-99 |
| Oct 24, 2026 | vs New York Knicks | W | 107-103 |
| Oct 21, 2026 | at Detroit Pistons | L | 113-121 |
Most recent 40 completed games, 2026-27.
05 / PAYROLL AND SALARIES
Contracts
2026-27 payroll on file: $180.25M across 11 players.
| Player | 2026-27 | Total | Type / notes |
|---|---|---|---|
| Jayson Tatum | $58.46M | $266.31M | |
| Paul George | $54.13M | $433.99M | |
| Derrick White | $30.35M | $137.43M | |
| Sam Hauser | $10.85M | $26.79M | |
| Payton Pritchard | $7.77M | $32.3M | |
| Devin Carter | $5.16M | $14.78M | |
| Hugo Gonzalez | $2.92M | $5.71M | |
| Luka Garza | $2.8M | $9.28M | |
| Baylor Scheierman | $2.74M | $7.86M | |
| Neemias Queta | $2.67M | $7.18M | |
| Jordan Walsh | $2.41M | $7.64M |
06 / CURRENT INJURY REPORT
Injuries
No players are on the current injury report.
07 / SIGNINGS, TRADES AND ROSTER MOVES
Adjustments & transactions
- Converted the contract of G Devin Carter to a two-way contract. Waived Fs Tucker Devries, Gabe McGlothan, Gs Hayden Gray and Milos Uzan.
- Re-signed G Payton Pritchard to a veteran extension.
- Waived F Hank Morgan.
- Re-signed G Jordan Walsh to a veteran extension.