

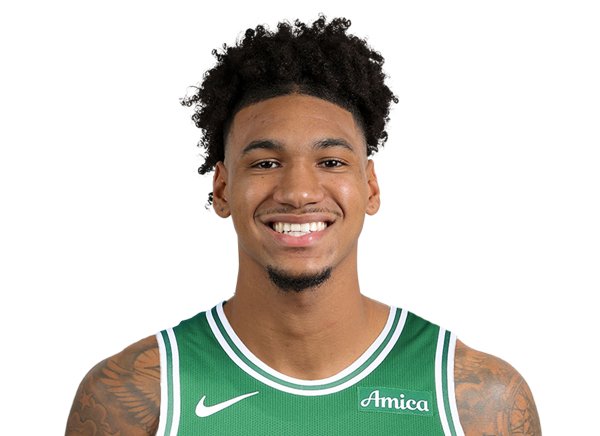
BALLERSCULTURE PLAYER PROFILE · 2026-27
Dillon Mitchell
Boston Celtics · F • #20 • 6' 8" 210 lbs

01 / 2026-27 PER-GAME AVERAGES
Season snapshot
PTS0.0
REB0.0
AST0.0
STL0.0
BLK0.0
TO0.0
MIN2.0
FG%0.0
3P%0.0
FT%0.0
GP1
GS0
FG0.0-0.0
3PT0.0-0.0
FT0.0-0.0
OR0.0
Per-game averages, regular season 2026-27 (Boston Celtics).
02 / EVERY SEASON SINCE 2022-23, SIDE BY SIDE
2022-23 to 2026-27
Per game
| Season | Team | GP | GS | MIN | PTS | REB | AST | STL | BLK | TO | FG% | 3P% | FT% |
|---|---|---|---|---|---|---|---|---|---|---|---|---|---|
| 2022-23 | — | — | — | — | — | — | — | — | — | — | — | — | — |
| 2023-24 | — | — | — | — | — | — | — | — | — | — | — | — | — |
| 2024-25 | — | — | — | — | — | — | — | — | — | — | — | — | — |
| 2025-26 | — | — | — | — | — | — | — | — | — | — | — | — | — |
| 2026-27 | Boston Celtics | 1 | 0 | 2.0 | 0.0 | 0.0 | 0.0 | 0.0 | 0.0 | 0.0 | 0.0 | 0.0 | 0.0 |
Season totals
| Season | Team | GP | GS | MIN | PTS | REB | AST | STL | BLK | TO | FG% | 3P% | FT% |
|---|---|---|---|---|---|---|---|---|---|---|---|---|---|
| 2022-23 | — | — | — | — | — | — | — | — | — | — | — | — | — |
| 2023-24 | — | — | — | — | — | — | — | — | — | — | — | — | — |
| 2024-25 | — | — | — | — | — | — | — | — | — | — | — | — | — |
| 2025-26 | — | — | — | — | — | — | — | — | — | — | — | — | — |
| 2026-27 | Boston Celtics | — | — | — | — | — | — | — | — | — | — | — | — |
Click a season to open this player’s full game log, splits and advanced stats for that year; click a team to open its page. A dash means no NBA games were recorded.
03 / EVERY CATEGORY THE PROVIDER REPORTS
Full statistical breakdown
Regular season 2026-27
Defensive
| Metric | Total | NBA rank |
|---|---|---|
| Blocks | 0 | Tied-370th |
| Defensive Rebounds | 0 | Tied-445th |
| Steals | 0 | Tied-402nd |
| Defensive Rebound Rate | 0.0 | — |
| Defensive Rebounds Per Game | 0.0 | — |
| Blocks Per Game | 0.0 | — |
| Steals Per Game | 0.0 | — |
| Defensive Rebounds Per 48 | 0.0 | 2,670th |
| Blocks Per 48 | 0.0 | 2,220th |
| Steals Per 48 | 0.0 | 2,412th |
General
| Metric | Total | NBA rank |
|---|---|---|
| Disqualifications | 0 | Tied-21st |
| Flagrant Fouls | 0 | Tied-22nd |
| Fouls | 0 | Tied-450th |
| Player Efficiency Rating | 0.00 | — |
| Rebound Rate | 0.0 | — |
| Ejections | 0 | Tied-7th |
| Technical Fouls | 0 | Tied-101st |
| Rebounds | 0 | — |
| Value Over Replacement Player | -0.3 | — |
| Minutes | 2 | Tied-8th |
| Minutes Per Game | 2.0 | — |
| Rating | 0.0 | Tied-2,411th |
| Plus-Minus | -1 | Tied-1st |
| Rebounds Per Game | 0.0 | — |
| Fouls Per Game | 0.0 | — |
| Flagrant Fouls Per Game | 0.0 | — |
| Technical Fouls Per Game | 0.0 | — |
| Ejections Per Game | 0.0 | — |
| Disqualifications Per Game | 0.0 | — |
| Assist To Turnover Ratio | 0.0 | — |
| Steal To Foul Ratio | 0.0 | — |
| Block To Foul Ratio | 0.0 | — |
| Team Rebounds Per Game | 0.0 | — |
| Rebounds | 0 | — |
| Total Technical Fouls | 0 | — |
| Assist To Turnover Ratio | 0.0 | — |
| Steal To Turnover Ratio | 0.0 | — |
| Rebounds Per 48 Minutes | 0.0 | — |
| Fouls Per 48 Minutes | 0.0 | 2,700th |
| Flagrant Fouls Per 48 Minutes | 0.0 | 132nd |
| Technical Fouls Per 48 Minutes | 0.0 | 606th |
| Ejections Per 48 Minutes | 0.0 | 42nd |
| Disqualifications Per 48 Minutes | 0.0 | 126th |
| R/40 | 0.0 | — |
| Games Played | 1 | 1st |
| Games Started | 0 | Tied-257th |
| Double Double | 0 | Tied-119th |
| Triple Double | 0 | Tied-12th |
Offensive
| Metric | Total | NBA rank |
|---|---|---|
| Assists | 0 | Tied-431st |
| Effective Field Goal Percentage | 0.0 | — |
| Field Goals | 0/0 | — |
| Field Goals Attempted | 0 | Tied-460th |
| Field Goals Made | 0 | Tied-452nd |
| Field Goal Percentage | 0.0 | — |
| Free Throws | 0/0 | — |
| Free Throw Percentage | 0.0 | — |
| Free Throws Attempted | 0 | Tied-418th |
| Free Throws Made | 0 | Tied-413th |
| Offensive Rebounds | 0 | Tied-425th |
| Points | 0 | Tied-458th |
| Turnovers | 0 | Tied-435th |
| 3-Point Field Goal Percentage | 0.0 | — |
| 3-Point Field Goals Attempted | 0 | Tied-420th |
| 3-Point Field Goals Made | 0 | Tied-379th |
| True Shooting Percentage | 0.0 | — |
| Total Turnovers | 0 | — |
| Assist Ratio | 0.0 | — |
| Points in the Paint | 0 | Tied-1st |
| Offensive Rebound Rate | 0.0 | — |
| Turnover Ratio | 0.0 | — |
| Brick Index | 0.00 | — |
| Usage Rate | 0.0 | — |
| Average Field Goals Made | 0.0 | — |
| Average Field Goals Attempted | 0.0 | — |
| Average 3-Point Field Goals Made | 0.0 | — |
| Average 3-Point Field Goals Attempted | 0.0 | — |
| Average Free Throws Made | 0.0 | — |
| Average Free Throws Attempted | 0.0 | — |
| Points Per Game | 0.0 | — |
| Offensive Rebounds Per Game | 0.0 | — |
| Assists Per Game | 0.0 | — |
| Turnovers Per Game | 0.0 | — |
| Offensive Rebound Percentage | 0.0 | — |
| Estimated Possessions | 0.0 | — |
| Estimated Possessions Per Game | 0.0 | — |
| Points Per Estimated Possession | 0.0 | — |
| Team Turnovers Per Game | 0.0 | — |
| Total Turnovers Per Game | 0.0 | — |
| 3-Point Field Goal Percentage | 0.0 | — |
| 2-Point Field Goals Made | 0.0 | Tied-73rd |
| 2-Point Field Goals Attempted | 0.0 | Tied-40th |
| 2-Point Field Goals Made per Game | 0.0 | — |
| 2-Point Field Goals Attempted per Game | 0.0 | — |
| 2-Point Field Goal Percentage | 0.0 | — |
| Shooting Efficiency | 0.00 | — |
| Scoring Efficiency | 0.000 | — |
| Fieldgoals Made Per 48 | 0.0 | 2,712th |
| Fieldgoals Attempted Per 48 | 0.0 | 2,760th |
| 3-Point Fieldgoals Made Per 48 | 0.0 | 2,274th |
| 3-Point Fieldgoals Attempted Per 48 | 0.0 | 2,520th |
| Freethrows Made Per 48 | 0.0 | 2,478th |
| Freethrows Attempted Per 48 | 0.0 | 2,508th |
| Points Scored Per 48 | 0.0 | 2,748th |
| Offensive Rebounds Per 48 | 0.0 | 2,550th |
| Assists Per 48 | 0.0 | 2,586th |
| Turnovers | 0.0 | 2,610th |
| P/40 | 0.0 | — |
| A/40 | 0.0 | — |
04 / EFFICIENCY, SHOOTING PROFILE, PER-36
Advanced metrics
Points per 36 min0.0
Rebounds per 36 min0.0
Assists per 36 min0.0
Steals per 36 min0.00
Blocks per 36 min0.00
Turnovers per 36 min0.00
Stocks (STL + BLK) per game0.00
Pts + Reb + Ast per game0.0
Efficiency (EFF) per game0.0
Game Score per game (Hollinger)0.0
Minutes per game2.0
Calculated by BallersCulture from the supplied 2026-27 box-score totals using standard formulas (hover a tile to see the formula). Tracking-based metrics such as BPM, VORP, on/off and RAPTOR are not available from this data source.
05 / 1 GAMES IN 2026-27
Game log: Regular season
| Date | Opp | Result | MIN | FG | FG% | 3PT | 3P% | FT | FT% | REB | AST | BLK | STL | PF | TO | PTS |
|---|---|---|---|---|---|---|---|---|---|---|---|---|---|---|---|---|
| Nov 3 | @ HOU | L 109-93 | 2 | 0-0 | 0.0 | 0-0 | 0.0 | 0-0 | 0.0 | 0 | 0 | 0 | 0 | 0 | 0 | 0 |
06 / 2026-27 HOME / AWAY, RESULTS, MONTHS AND OPPONENTS
Splits
split
| Split | GP | MIN | FG | FG% | 3PT | 3P% | FT | FT% | OR | DR | REB | AST | BLK | STL | PF | TO | PTS |
|---|---|---|---|---|---|---|---|---|---|---|---|---|---|---|---|---|---|
| All Splits | 1 | 2.0 | 0.0-0.0 | 0.0 | 0.0-0.0 | 0.0 | 0.0-0.0 | 0.0 | 0.0 | 0.0 | 0.0 | 0.0 | 0.0 | 0.0 | 0.0 | 0.0 | 0.0 |
| Road | 1 | 2.0 | 0.0-0.0 | 0.0 | 0.0-0.0 | 0.0 | 0.0-0.0 | 0.0 | 0.0 | 0.0 | 0.0 | 0.0 | 0.0 | 0.0 | 0.0 | 0.0 | 0.0 |
| 3+ Days Rest | 1 | 2.0 | 0.0-0.0 | 0.0 | 0.0-0.0 | 0.0 | 0.0-0.0 | 0.0 | 0.0 | 0.0 | 0.0 | 0.0 | 0.0 | 0.0 | 0.0 | 0.0 | 0.0 |
Month
| Split | GP | MIN | FG | FG% | 3PT | 3P% | FT | FT% | OR | DR | REB | AST | BLK | STL | PF | TO | PTS |
|---|---|---|---|---|---|---|---|---|---|---|---|---|---|---|---|---|---|
| November | 1 | 2.0 | 0.0-0.0 | 0.0 | 0.0-0.0 | 0.0 | 0.0-0.0 | 0.0 | 0.0 | 0.0 | 0.0 | 0.0 | 0.0 | 0.0 | 0.0 | 0.0 | 0.0 |
| Pre All-Star | 1 | 2.0 | 0.0-0.0 | 0.0 | 0.0-0.0 | 0.0 | 0.0-0.0 | 0.0 | 0.0 | 0.0 | 0.0 | 0.0 | 0.0 | 0.0 | 0.0 | 0.0 | 0.0 |
Result
| Split | GP | MIN | FG | FG% | 3PT | 3P% | FT | FT% | OR | DR | REB | AST | BLK | STL | PF | TO | PTS |
|---|---|---|---|---|---|---|---|---|---|---|---|---|---|---|---|---|---|
| Losses | 1 | 2.0 | 0.0-0.0 | 0.0 | 0.0-0.0 | 0.0 | 0.0-0.0 | 0.0 | 0.0 | 0.0 | 0.0 | 0.0 | 0.0 | 0.0 | 0.0 | 0.0 | 0.0 |
Day
| Split | GP | MIN | FG | FG% | 3PT | 3P% | FT | FT% | OR | DR | REB | AST | BLK | STL | PF | TO | PTS |
|---|---|---|---|---|---|---|---|---|---|---|---|---|---|---|---|---|---|
| Monday | 1 | 2.0 | 0.0-0.0 | 0.0 | 0.0-0.0 | 0.0 | 0.0-0.0 | 0.0 | 0.0 | 0.0 | 0.0 | 0.0 | 0.0 | 0.0 | 0.0 | 0.0 | 0.0 |
Opponent
| Split | GP | MIN | FG | FG% | 3PT | 3P% | FT | FT% | OR | DR | REB | AST | BLK | STL | PF | TO | PTS |
|---|---|---|---|---|---|---|---|---|---|---|---|---|---|---|---|---|---|
| Houston Rockets | 1 | 2.0 | 0.0-0.0 | 0.0 | 0.0-0.0 | 0.0 | 0.0-0.0 | 0.0 | 0.0 | 0.0 | 0.0 | 0.0 | 0.0 | 0.0 | 0.0 | 0.0 | 0.0 |
07 / SEASON-BY-SEASON HISTORY
Career statistics
Regular Season Averages
| Season | Team | GP | GS | MIN | FG | FG% | 3PT | 3P% | FT | FT% | OR | DR | REB | AST | BLK | STL | PF | TO | PTS |
|---|---|---|---|---|---|---|---|---|---|---|---|---|---|---|---|---|---|---|---|
| 2026-27 | Boston Celtics | 1 | 0 | 2.0 | 0.0-0.0 | 0.0 | 0.0-0.0 | 0.0 | 0.0-0.0 | 0.0 | 0.0 | 0.0 | 0.0 | 0.0 | 0.0 | 0.0 | 0.0 | 0.0 | 0.0 |
| Career | — | 1 | 0 | 2.0 | 0.0-0.0 | 0.0 | 0.0-0.0 | 0.0 | 0.0-0.0 | 0.0 | 0.0 | 0.0 | 0.0 | 0.0 | 0.0 | 0.0 | 0.0 | 0.0 | 0.0 |
08 / SHOT CHART AND ZONE SHOOTING
Shot profile
Shot-location data is not connected. Add a BALLDONTLIE GOAT-tier NBA API key in NBA Players → Settings to enable shot charts and zone shooting.
09 / RECORD, TEAM STATS AND TEAMMATES
Team
Overall11-2
Home6-0
Road5-2
DIV4-0
CONF10-1
Last Ten Games9-1
Team records for 2026-27 (regular season).
Team statistics 2026-27
Defensive
| Metric | Total | Per game | NBA rank |
|---|---|---|---|
| Blocks | 64 | 4.923 | 1st |
| Defensive Rebounds | 414 | 31.846 | 3rd |
| Steals | 109 | 8.385 | 3rd |
| Points Conceded Off Turnovers | 0 | 15 | — |
| Defensive Rebound Rate | 0.0 | — | — |
| Defensive Rebounds Per Game | 31.8 | — | — |
| Blocks Per Game | 4.9 | — | — |
| Steals Per Game | 8.4 | — | — |
| Defensive Rebounds Per 48 | 0.0 | — | — |
| Blocks Per 48 | 0.0 | — | — |
| Steals Per 48 | 0.0 | — | — |
General
| Metric | Total | Per game | NBA rank |
|---|---|---|---|
| Disqualifications | 1 | — | Tied-2nd |
| Flagrant Fouls | 0 | — | — |
| Fouls | 274 | 21.077 | 4th |
| Rebound Rate | 53.2 | — | 2nd |
| Ejections | 0 | — | — |
| Technical Fouls | 16 | 0.615 | Tied-2nd |
| Rebounds | 589 | 45.308 | — |
| Minutes | 0 | — | — |
| Minutes Per Game | 0.0 | — | — |
| Fantasy Rating | 0.0 | — | — |
| Rating | 216.1 | — | — |
| Plus-Minus | -1 | -1 | Tied-1st |
| Game Day of Year | 0 | — | — |
| Rebounds Per Game | 45.3 | — | — |
| Fouls Per Game | 21.1 | — | — |
| Flagrant Fouls Per Game | 0.0 | — | — |
| Technical Fouls Per Game | 1.2 | — | — |
| Ejections Per Game | 0.0 | — | — |
| Disqualifications Per Game | 0.1 | — | — |
| Assist To Turnover Ratio | 2.0 | 1.967 | — |
| Steal To Foul Ratio | 0.4 | 0.398 | — |
| Block To Foul Ratio | 0.2 | 0.234 | — |
| Team Rebounds Per Game | 0.0 | — | — |
| Rebounds | 589 | 45.308 | — |
| Total Technical Fouls | 16 | 0.615 | — |
| Assist To Turnover Ratio | 44.5 | — | — |
| Team Rebounds | 0 | — | — |
| Steal To Turnover Ratio | 0.6 | 0.602 | — |
| Rebounds Per 48 Minutes | 0.0 | — | — |
| Fouls Per 48 Minutes | 0.0 | — | — |
| Flagrant Fouls Per 48 Minutes | 0.0 | — | — |
| Technical Fouls Per 48 Minutes | 0.0 | — | — |
| Ejections Per 48 Minutes | 0.0 | — | — |
| Disqualifications Per 48 Minutes | 0.0 | — | — |
| Games Played | 13 | — | Tied-2nd |
| Games Started | 0 | — | — |
| Double Double | 0 | — | — |
| Triple Double | 0 | — | — |
Offensive
| Metric | Total | Per game | NBA rank |
|---|---|---|---|
| Assists | 356 | 27.385 | 3rd |
| Effective Field Goal Percentage | 55.4 | — | 1st |
| Field Goals | 525/1141 | 0.46 | — |
| Field Goals Attempted | 1141 | 87.769 | 4th |
| Field Goals Made | 525 | 40.385 | 3rd |
| Field Goal Percentage | 46.0 | 0.46 | 1st |
| Free Throws | 237/301 | 0.787 | — |
| Free Throw Percentage | 78.7 | 0.787 | 2nd |
| Free Throws Attempted | 301 | 23.154 | 4th |
| Free Throws Made | 237 | 18.231 | 4th |
| Offensive Rebounds | 175 | 13.462 | 3rd |
| Points | 1502 | 115.538 | 2nd |
| Turnovers | 181 | 13.923 | 2nd |
| 3-Point Field Goal Percentage | 38.5 | 0.385 | 1st |
| 3-Point Field Goals Attempted | 559 | 43 | 1st |
| 3-Point Field Goals Made | 215 | 16.538 | 1st |
| True Shooting Percentage | 59.0 | — | 1st |
| Team Turnovers | 8 | — | Tied-4th |
| Total Turnovers | 189 | 13.923 | — |
| Assist Ratio | 19.6 | — | 1st |
| Points in the Paint | 508 | 39 | 3rd |
| Offensive Rebound Rate | 32.3 | — | 3rd |
| Turnover Ratio | 12.9 | — | 3rd |
| Fast Break Points | 140 | — | — |
| Possessions | 1287 | — | 4th |
| Pace Factor | 94.4 | — | 4th |
| Average Field Goals Made | 40.4 | — | — |
| Average Field Goals Attempted | 87.8 | — | — |
| Average 3-Point Field Goals Made | 16.5 | — | — |
| Average 3-Point Field Goals Attempted | 43.0 | — | — |
| Average Free Throws Made | 18.2 | — | — |
| Average Free Throws Attempted | 23.2 | — | — |
| Points Per Game | 115.5 | — | — |
| Offensive Rebounds Per Game | 13.5 | — | — |
| Assists Per Game | 27.4 | — | — |
| Turnovers Per Game | 13.9 | — | — |
| Offensive Rebound Percentage | 0.3 | 0.284 | — |
| Estimated Possessions | 1275.4 | 97.492 | — |
| Estimated Possessions Per Game | 98.1 | — | — |
| Points Per Estimated Possession | 1.2 | 1.185 | — |
| Team Turnovers Per Game | 0.6 | — | — |
| Total Turnovers Per Game | 14.5 | — | — |
| 3-Point Field Goal Percentage | 38.5 | 0.385 | 1st |
| 2-Point Field Goals Made | 310.0 | 23.847 | 2nd |
| 2-Point Field Goals Attempted | 582.0 | 44.769 | 3rd |
| 2-Point Field Goals Made per Game | 23.8 | — | — |
| 2-Point Field Goals Attempted per Game | 44.8 | — | — |
| 2-Point Field Goal Percentage | 53.3 | 0.533 | — |
| Shooting Efficiency | 0.55 | 0.554 | — |
| Scoring Efficiency | 1.316 | 1.316 | — |
| Fieldgoals Made Per 48 | 0.0 | — | — |
| Fieldgoals Attempted Per 48 | 0.0 | — | — |
| 3-Point Fieldgoals Made Per 48 | 0.0 | — | — |
| 3-Point Fieldgoals Attempted Per 48 | 0.0 | — | — |
| Freethrows Made Per 48 | 0.0 | — | — |
| Freethrows Attempted Per 48 | 0.0 | — | — |
| Points Scored Per 48 | 0.0 | — | — |
| Offensive Rebounds Per 48 | 0.0 | — | — |
| Assists Per 48 | 0.0 | — | — |
| Turnovers | 0.0 | — | — |
Teammates
 Amari WilliamsF #77
 Baylor ScheiermanG #55
 Chris Cenac Jr.F #12
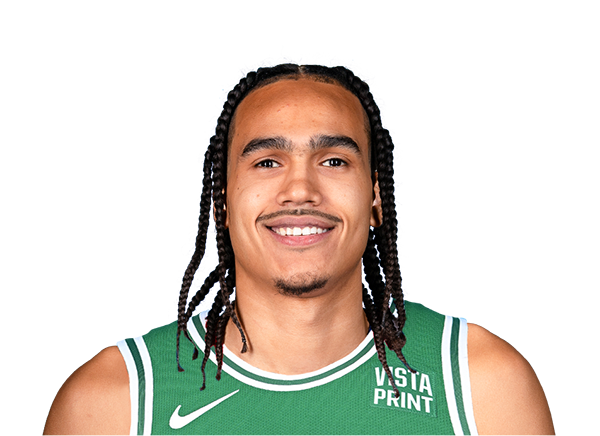 Dalano BantonF #45
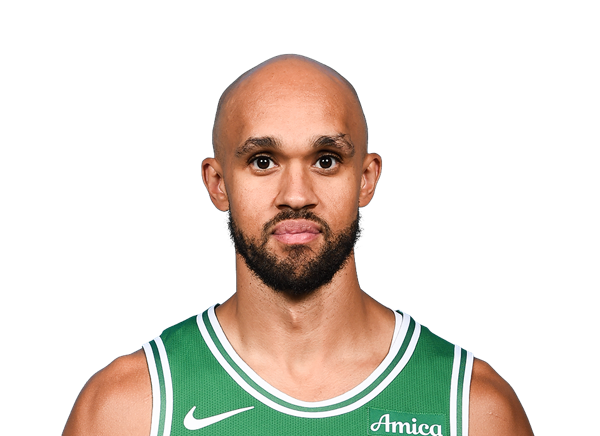 Derrick WhiteG #9
 Devin CarterG #99
 Gabe McGlothanF #41
 Hayden GrayG #44
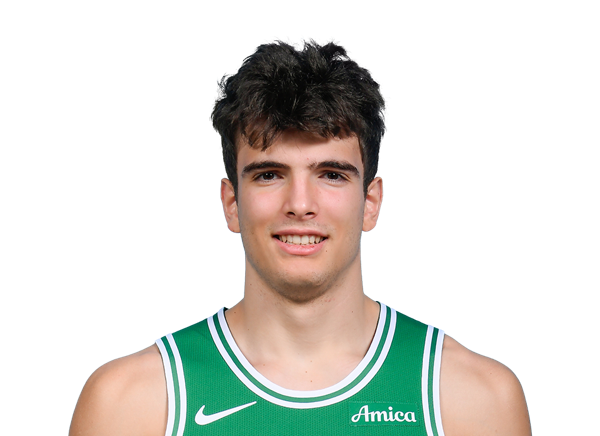 Hugo GonzalezG #28
 Jayson TatumF
 Jordan SchakelG #20
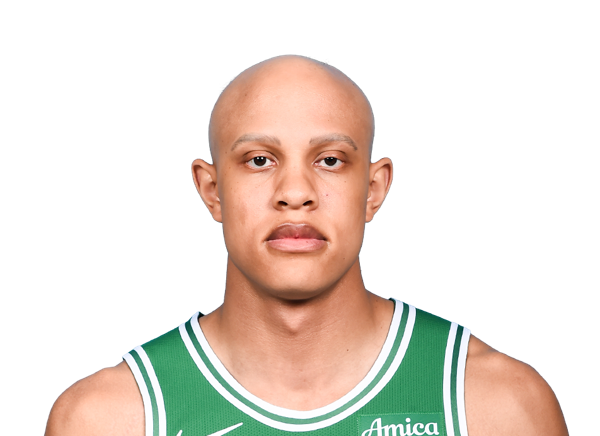 Jordan WalshG #27
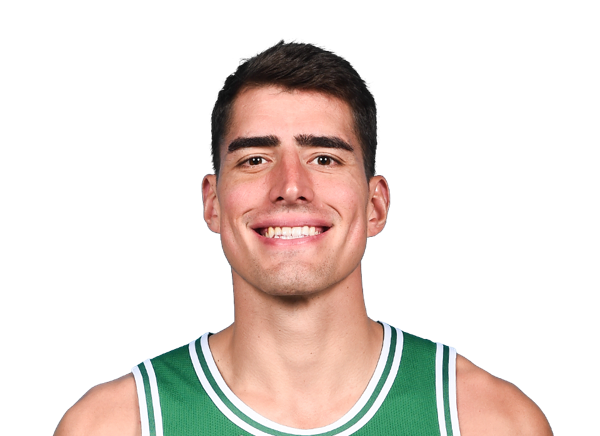 Luka GarzaC #52
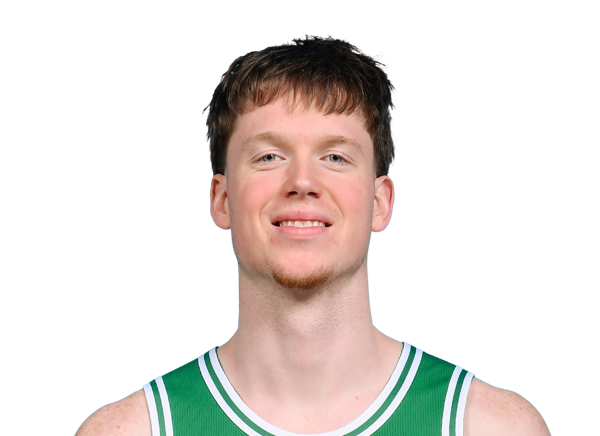 Max ShulgaG #44
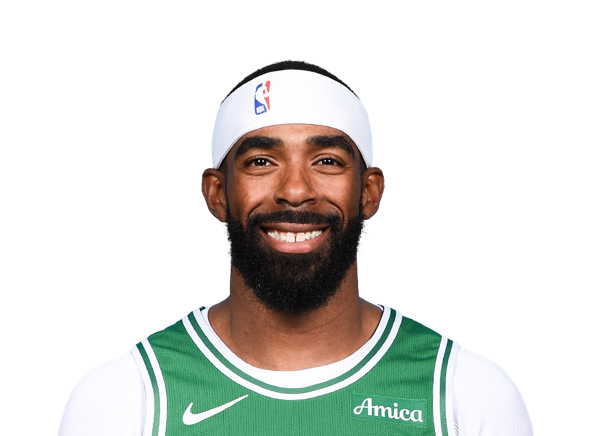 Mike ConleyG #45
 Milos UzanG #29
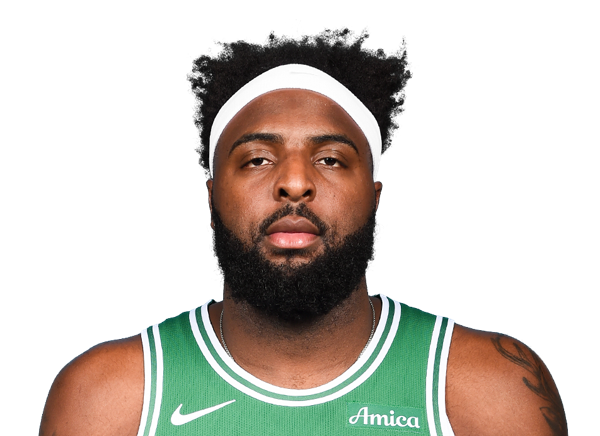 Mitchell RobinsonC #4
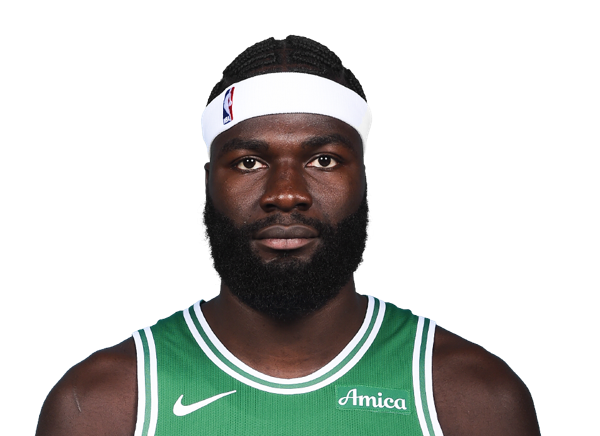 Neemias QuetaC #88
 Paul GeorgeF #13
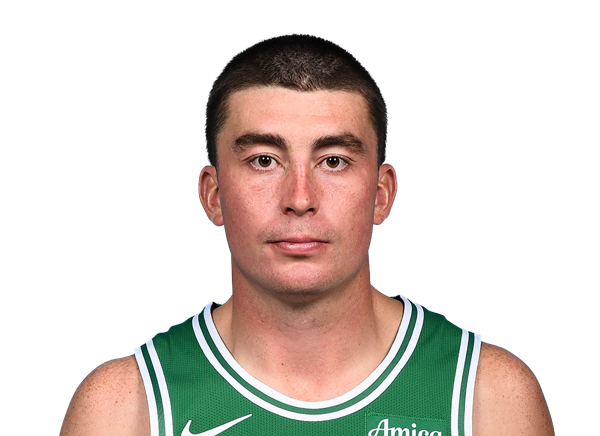 Payton PritchardG #11
 Ron Harper Jr.G #8
 Sam HauserF #30
 Tucker DeVriesF #26
10 / SALARY BY SEASON
Contract
No contract is on file for this player yet.
11 / LATEST REPORT
Injury status
No current injury report entry for this player.
12 / SIGNINGS, TRADES AND ROSTER MOVES
Transactions
No recorded transactions for this player.
13 / LATEST COVERAGE
Player news
LATEST UPDATEThe Celtics transferred Mitchell to the G League's Maine Celtics before recalling him Wednesday.
Mitchell joined the G League Celtics for practice Wednesday but will be available for the parent club's game against Milwaukee. However, the two-way player isn't likely to see meaningful burn.
16 July 2026Gonzalez, Cenac post double-doubles as Celtics hold off Kings↗
13 July 2026Mitchell's 24 points, 6 steals lead Celtics past Hornets↗
15 February 2026Tempers flare, six players ejected in St. John's-Providence clash↗
24 October 2025Top 100 men's NCAA basketball players ranked going into 2025-26↗
12 June 2025Men's college basketball transfer rankings for the 2025-26 season↗
10 June 2025Men's college basketball transfer class rankings for 2025-26↗
24 April 2025Sources: Dillon Mitchell latest to transfer to St. John's↗
13 March 2025Dillon Mitchell gets it done on both sides of the ball for Cincinnati↗
14 / BIO, DRAFT AND CONTACT DETAILS
Biography & profile
TeamBoston Celtics
PositionForward
Jersey20
Height6' 8"
Weight210 lbs
Age23
Date of birthOct 3, 2003
BirthplaceTampa, FL, USA
CollegeSt. John's
Experience0 yrs
StatusActive