Click a season to open this player’s full game log, splits and advanced stats for that year; click a team to open its page. A dash means no NBA games were recorded.
03 / EVERY CATEGORY THE PROVIDER REPORTS
Full statistical breakdown
Regular season 2026-27
Defensive
Metric
Total
NBA rank
Blocks
11
Tied-40th
Defensive Rebounds
36
Tied-133rd
Steals
9
Tied-145th
Defensive Rebound Rate
0.0
—
Defensive Rebounds Per Game
3.0
Tied-130th
Blocks Per Game
0.9
Tied-41st
Steals Per Game
0.8
146th
Defensive Rebounds Per 48
8.2
Tied-1,596th
Blocks Per 48
2.5
Tied-480th
Steals Per 48
2.0
Tied-1,740th
General
Metric
Total
NBA rank
Disqualifications
0
Tied-21st
Flagrant Fouls
0
Tied-22nd
Fouls
27
Tied-133rd
Player Efficiency Rating
16.54
108th
Rebound Rate
0.0
—
Ejections
0
Tied-7th
Technical Fouls
1
Tied-29th
Rebounds
66
—
Value Over Replacement Player
18.8
—
Minutes
212
4th
Minutes Per Game
17.7
—
Rating
13.8
Tied-57th
Plus-Minus
-21
Tied-1st
Rebounds Per Game
5.5
Tied-73rd
Fouls Per Game
2.3
Tied-128th
Flagrant Fouls Per Game
0.0
Tied-19th
Technical Fouls Per Game
0.1
Tied-41st
Ejections Per Game
0.0
Tied-6th
Disqualifications Per Game
0.0
Tied-20th
Assist To Turnover Ratio
1.0
—
Steal To Foul Ratio
0.3
—
Block To Foul Ratio
0.4
—
Team Rebounds Per Game
0.0
—
Rebounds
66
—
Total Technical Fouls
1
—
Assist To Turnover Ratio
0.0
—
Steal To Turnover Ratio
1.0
—
Rebounds Per 48 Minutes
14.9
—
Fouls Per 48 Minutes
6.1
Tied-1,596th
Flagrant Fouls Per 48 Minutes
0.0
Tied-264th
Technical Fouls Per 48 Minutes
0.2
Tied-348th
Ejections Per 48 Minutes
0.0
Tied-84th
Disqualifications Per 48 Minutes
0.0
Tied-252nd
R/40
12.5
—
Games Played
12
12th
Games Started
5
Tied-157th
Double Double
0
Tied-119th
Triple Double
0
Tied-12th
Offensive
Metric
Total
NBA rank
Assists
9
Tied-288th
Effective Field Goal Percentage
63.6
—
Field Goals
28/44
—
Field Goals Attempted
44
Tied-280th
Field Goals Made
28
Tied-221st
Field Goal Percentage
63.6
—
Free Throws
6/18
—
Free Throw Percentage
33.3
282nd
Free Throws Attempted
18
Tied-186th
Free Throws Made
6
Tied-274th
Offensive Rebounds
30
Tied-26th
Points
62
259th
Turnovers
9
Tied-227th
3-Point Field Goal Percentage
0.0
Tied-273rd
3-Point Field Goals Attempted
0
Tied-420th
3-Point Field Goals Made
0
Tied-379th
True Shooting Percentage
59.7
—
Total Turnovers
9
—
Assist Ratio
12.9
—
Points in the Paint
0
Tied-1st
Offensive Rebound Rate
0.0
—
Turnover Ratio
12.9
—
Brick Index
0.00
—
Usage Rate
0.0
—
Average Field Goals Made
2.3
—
Average Field Goals Attempted
3.7
149th
Average 3-Point Field Goals Made
0.0
—
Average 3-Point Field Goals Attempted
0.0
Tied-273rd
Average Free Throws Made
0.5
—
Average Free Throws Attempted
1.5
Tied-175th
Points Per Game
5.2
244th
Offensive Rebounds Per Game
2.5
23rd
Assists Per Game
0.8
Tied-253rd
Turnovers Per Game
0.8
217th
Offensive Rebound Percentage
1.9
—
Estimated Possessions
30.2
—
Estimated Possessions Per Game
2.5
—
Points Per Estimated Possession
2.1
—
Team Turnovers Per Game
0.0
—
Total Turnovers Per Game
0.8
—
3-Point Field Goal Percentage
0.0
—
2-Point Field Goals Made
28.0
158th
2-Point Field Goals Attempted
44.0
140th
2-Point Field Goals Made per Game
2.3
—
2-Point Field Goals Attempted per Game
3.7
—
2-Point Field Goal Percentage
63.6
1st
Shooting Efficiency
0.64
—
Scoring Efficiency
1.409
—
Fieldgoals Made Per 48
6.3
Tied-2,652nd
Fieldgoals Attempted Per 48
10.0
Tied-3,360th
3-Point Fieldgoals Made Per 48
0.0
Tied-4,548th
3-Point Fieldgoals Attempted Per 48
0.0
Tied-5,040th
Freethrows Made Per 48
1.4
Tied-3,288th
Freethrows Attempted Per 48
4.1
Tied-2,232nd
Points Scored Per 48
14.0
3,108th
Offensive Rebounds Per 48
6.8
Tied-312th
Assists Per 48
2.0
Tied-3,456th
Turnovers
2.0
Tied-2,724th
P/40
11.7
—
A/40
1.7
—
04 / EFFICIENCY, SHOOTING PROFILE, PER-36
Advanced metrics
True shooting %59.6%
Effective FG %62.2%
2-point FG %62.2%
3-point attempt rate0.0%
Free throw rate40.5%
Points per shot attempt1.41
% of points from 3s0.0%
Assist-to-turnover1.00
Points per 36 min10.6
Rebounds per 36 min11.2
Assists per 36 min1.6
Steals per 36 min1.63
Blocks per 36 min1.83
Turnovers per 36 min1.63
Stocks (STL + BLK) per game1.70
Pts + Reb + Ast per game11.5
Efficiency (EFF) per game10.0
Game Score per game (Hollinger)6.1
Minutes per game17.7
Calculated by BallersCulture from the supplied 2026-27 box-score totals using standard formulas (hover a tile to see the formula). Tracking-based metrics such as BPM, VORP, on/off and RAPTOR are not available from this data source.
05 / 12 GAMES IN 2026-27
Game log: Regular season
Date
Opp
Result
MIN
FG
FG%
3PT
3P%
FT
FT%
REB
AST
BLK
STL
PF
TO
PTS
Nov 16
vs DAL
W 131-94
15
0-0
0.0
0-0
0.0
0-0
0.0
7
1
3
0
2
1
0
Nov 12
@ TOR
W 98-93
11
1-1
100.0
0-0
0.0
0-0
0.0
2
0
0
0
2
1
2
Nov 11
@ PHI
W 123-101
17
1-5
20.0
0-0
0.0
0-0
0.0
6
2
1
1
3
0
2
Nov 9
@ MIL
W 117-97
18
6-6
100.0
0-0
0.0
0-2
0.0
7
2
1
5
0
0
12
Nov 7
@ CHA
W 119-80
15
3-5
60.0
0-0
0.0
0-1
0.0
7
0
1
0
1
0
6
Nov 5
vs MIL
W 109-102
20
1-8
12.5
0-0
0.0
1-2
50.0
10
1
1
1
1
1
3
Nov 3
@ HOU
L 109-93
15
2-2
100.0
0-0
0.0
0-0
0.0
4
0
0
0
4
2
4
Oct 31
vs CHI
W 125-111
19
4-4
100.0
0-0
0.0
3-5
60.0
4
0
1
0
2
0
11
Oct 28
vs BKN
W 125-124 OT
25
3-4
75.0
0-0
0.0
1-4
25.0
5
0
0
1
1
1
7
Oct 27
vs CHI
W 134-99
16
3-3
100.0
0-0
0.0
1-2
50.0
7
0
0
0
4
1
7
Oct 24
vs NY
W 107-103
22
2-4
50.0
0-0
0.0
0-0
0.0
4
2
1
0
5
0
4
Oct 21
@ DET
L 121-113
18
2-2
100.0
0-0
0.0
0-2
0.0
3
1
2
1
2
2
4
06 / 2026-27 HOME / AWAY, RESULTS, MONTHS AND OPPONENTS
Splits
split
Split
GP
MIN
FG
FG%
3PT
3P%
FT
FT%
OR
DR
REB
AST
BLK
STL
PF
TO
PTS
All Splits
12
17.7
2.3-3.7
63.6
0.0-0.0
0.0
0.5-1.5
33.3
2.5
3.0
5.5
0.8
0.9
0.8
2.3
0.8
5.2
Home
6
19.5
2.2-3.8
56.5
0.0-0.0
0.0
1.0-2.2
46.2
2.8
3.3
6.2
0.7
1.0
0.3
2.5
0.7
5.3
Road
6
15.8
2.5-3.5
71.4
0.0-0.0
0.0
0.0-0.8
0.0
2.2
2.7
4.8
0.8
0.8
1.2
2.0
0.8
5.0
vs. Division
4
18.8
1.8-3.5
50.0
0.0-0.0
0.0
0.3-1.0
25.0
2.0
2.3
4.3
1.0
0.5
0.5
2.8
0.5
3.8
vs. Conference
10
18.2
2.6-4.2
61.9
0.0-0.0
0.0
0.6-1.8
33.3
2.7
2.8
5.5
0.8
0.8
0.9
2.1
0.6
5.8
3+ Days Rest
2
16.5
1.0-1.0
100.0
0.0-0.0
0.0
0.0-1.0
0.0
1.5
3.5
5.0
1.0
2.5
0.5
2.0
1.5
2.0
Month
Split
GP
MIN
FG
FG%
3PT
3P%
FT
FT%
OR
DR
REB
AST
BLK
STL
PF
TO
PTS
October
5
20.0
2.8-3.4
82.4
0.0-0.0
0.0
1.0-2.6
38.5
2.0
2.6
4.6
0.6
0.8
0.4
2.8
0.8
6.6
November
7
15.9
2.0-3.9
51.9
0.0-0.0
0.0
0.1-0.7
20.0
2.9
3.3
6.1
0.9
1.0
1.0
1.9
0.7
4.1
Pre All-Star
12
17.7
2.3-3.7
63.6
0.0-0.0
0.0
0.5-1.5
33.3
2.5
3.0
5.5
0.8
0.9
0.8
2.3
0.8
5.2
Result
Split
GP
MIN
FG
FG%
3PT
3P%
FT
FT%
OR
DR
REB
AST
BLK
STL
PF
TO
PTS
Wins
10
17.8
2.4-4.0
60.0
0.0-0.0
0.0
0.6-1.6
37.5
2.8
3.1
5.9
0.8
0.9
0.8
2.1
0.5
5.4
Losses
2
16.5
2.0-2.0
100.0
0.0-0.0
0.0
0.0-1.0
0.0
1.0
2.5
3.5
0.5
1.0
0.5
3.0
2.0
4.0
Position
Split
GP
MIN
FG
FG%
3PT
3P%
FT
FT%
OR
DR
REB
AST
BLK
STL
PF
TO
PTS
As Starter
5
20.0
2.8-3.4
82.4
0.0-0.0
0.0
1.0-2.6
38.5
2.0
2.6
4.6
0.6
0.8
0.4
2.8
0.8
6.6
Day
Split
GP
MIN
FG
FG%
3PT
3P%
FT
FT%
OR
DR
REB
AST
BLK
STL
PF
TO
PTS
Monday
2
15.5
2.5-2.5
100.0
0.0-0.0
0.0
0.5-1.0
50.0
2.0
3.5
5.5
0.0
0.0
0.0
4.0
1.5
5.5
Tuesday
3
20.0
2.0-3.7
54.5
0.0-0.0
0.0
0.3-2.0
16.7
2.3
2.3
4.7
1.0
1.0
1.0
2.0
1.0
4.3
Wednesday
2
15.5
1.0-4.5
22.2
0.0-0.0
0.0
0.5-1.0
50.0
3.0
3.0
6.0
0.5
0.5
0.5
1.5
1.0
2.5
Friday
3
19.0
3.0-4.3
69.2
0.0-0.0
0.0
1.0-2.0
50.0
2.3
2.7
5.0
0.7
1.0
0.0
2.7
0.0
7.0
Sunday
2
16.5
3.0-3.0
100.0
0.0-0.0
0.0
0.0-1.0
0.0
3.0
4.0
7.0
1.5
2.0
2.5
1.0
0.5
6.0
Opponent
Split
GP
MIN
FG
FG%
3PT
3P%
FT
FT%
OR
DR
REB
AST
BLK
STL
PF
TO
PTS
Brooklyn Nets
1
25.0
3.0-4.0
75.0
0.0-0.0
0.0
1.0-4.0
25.0
2.0
3.0
5.0
0.0
0.0
1.0
1.0
1.0
7.0
Charlotte Hornets
1
15.0
3.0-5.0
60.0
0.0-0.0
0.0
0.0-1.0
0.0
3.0
4.0
7.0
0.0
1.0
0.0
1.0
0.0
6.0
Chicago Bulls
2
17.5
3.5-3.5
100.0
0.0-0.0
0.0
2.0-3.5
57.1
2.5
3.0
5.5
0.0
0.5
0.0
3.0
0.5
9.0
Dallas Mavericks
1
15.0
0.0-0.0
0.0
0.0-0.0
0.0
0.0-0.0
0.0
2.0
5.0
7.0
1.0
3.0
0.0
2.0
1.0
0.0
Detroit Pistons
1
18.0
2.0-2.0
100.0
0.0-0.0
0.0
0.0-2.0
0.0
1.0
2.0
3.0
1.0
2.0
1.0
2.0
2.0
4.0
Houston Rockets
1
15.0
2.0-2.0
100.0
0.0-0.0
0.0
0.0-0.0
0.0
1.0
3.0
4.0
0.0
0.0
0.0
4.0
2.0
4.0
Milwaukee Bucks
2
19.0
3.5-7.0
50.0
0.0-0.0
0.0
0.5-2.0
25.0
5.0
3.5
8.5
1.5
1.0
3.0
0.5
0.5
7.5
New York Knicks
1
22.0
2.0-4.0
50.0
0.0-0.0
0.0
0.0-0.0
0.0
2.0
2.0
4.0
2.0
1.0
0.0
5.0
0.0
4.0
Philadelphia 76ers
1
17.0
1.0-5.0
20.0
0.0-0.0
0.0
0.0-0.0
0.0
4.0
2.0
6.0
2.0
1.0
1.0
3.0
0.0
2.0
Toronto Raptors
1
11.0
1.0-1.0
100.0
0.0-0.0
0.0
0.0-0.0
0.0
0.0
2.0
2.0
0.0
0.0
0.0
2.0
1.0
2.0
07 / SEASON-BY-SEASON HISTORY
Career statistics
Regular Season Averages
Season
Team
GP
GS
MIN
FG
FG%
3PT
3P%
FT
FT%
OR
DR
REB
AST
BLK
STL
PF
TO
PTS
2018-19
New York Knicks
66
19
20.6
3.1-4.4
69.4
0.0-0.0
0.0
1.2-2.0
60.0
2.7
3.7
6.4
0.6
2.4
0.8
3.3
0.5
7.3
2019-20
New York Knicks
61
7
23.1
4.1-5.6
74.2
0.0-0.0
0.0
1.4-2.4
56.8
3.0
4.0
7.0
0.6
2.0
0.9
3.2
0.6
9.7
2020-21
New York Knicks
31
29
27.5
3.7-5.7
65.3
0.0-0.0
0.0
0.8-1.7
49.1
3.6
4.5
8.1
0.5
1.5
1.1
2.8
0.8
8.3
2021-22
New York Knicks
72
62
25.7
3.6-4.8
76.1
0.0-0.0
0.0
1.2-2.5
48.6
4.1
4.5
8.6
0.5
1.8
0.8
2.7
0.8
8.5
2022-23
New York Knicks
59
58
26.9
3.2-4.7
67.1
0.0-0.0
0.0
1.0-2.1
48.4
4.5
4.9
9.4
0.9
1.8
0.9
2.7
0.7
7.4
2023-24
New York Knicks
31
21
24.8
2.4-4.1
57.5
0.0-0.0
0.0
0.9-2.1
40.9
4.6
3.9
8.5
0.6
1.1
1.2
1.8
0.8
5.6
2024-25
New York Knicks
17
3
17.1
2.2-3.3
66.1
0.0-0.0
0.0
0.8-1.1
68.4
3.1
2.9
5.9
0.8
1.1
0.9
1.5
0.6
5.1
2025-26
New York Knicks
60
16
19.6
2.5-3.4
72.3
0.0-0.0
0.0
0.7-1.7
40.8
4.2
4.6
8.8
0.9
1.2
0.9
2.1
0.7
5.7
2026-27
Boston Celtics
12
5
17.7
2.3-3.7
63.6
0.0-0.0
0.0
0.5-1.5
33.3
2.5
3.0
5.5
0.8
0.9
0.8
2.3
0.8
5.2
Career
—
409
220
23.2
3.2-4.6
70.1
0.0-0.0
0.0
1.0-2.1
50.4
3.7
4.2
7.9
0.7
1.7
0.9
2.7
0.7
7.4
Regular Season Totals
Season
Team
FG
FG%
3PT
3P%
FT
FT%
OR
DR
REB
AST
BLK
STL
PF
TO
PTS
2018-19
New York Knicks
202-291
69.4
0-0
0.0
81-135
60.0
177
246
423
37
161
52
217
35
485
2019-20
New York Knicks
253-341
74.2
0-0
0.0
84-148
56.8
186
242
428
36
119
52
194
37
590
2020-21
New York Knicks
115-176
65.3
0-0
0.0
26-53
49.1
113
139
252
17
45
35
86
26
256
2021-22
New York Knicks
261-343
76.1
0-0
0.0
88-181
48.6
295
322
617
38
133
58
195
60
610
2022-23
New York Knicks
188-280
67.1
0-0
0.0
59-122
48.4
267
288
555
53
109
56
160
41
435
2023-24
New York Knicks
73-127
57.5
0-0
0.0
27-66
40.9
142
121
263
18
35
37
55
25
173
2024-25
New York Knicks
37-56
66.1
0-0
0.0
13-19
68.4
52
49
101
13
18
16
26
10
87
2025-26
New York Knicks
149-206
72.3
0-0
0.0
42-103
40.8
252
273
525
52
70
56
127
41
340
2026-27
Boston Celtics
28-44
63.6
0-0
0.0
6-18
33.3
30
36
66
9
11
9
27
9
62
Career
—
1306-1864
70.1
0-0
0.0
426-845
50.4
1514
1716
3230
273
701
371
1087
284
3038
Regular Season Misc Totals
Season
Team
DD2
TD3
DQ
EJECT
TECH
FLAG
AST/TO
STL/TO
SC-EFF
SH-EFF
2018-19
New York Knicks
11
0
8
0
4
1
1.1
1.5
1.667
0.69
2019-20
New York Knicks
8
0
6
0
5
1
1.0
1.4
1.730
0.74
2020-21
New York Knicks
5
0
0
0
0
0
0.7
1.3
1.455
0.65
2021-22
New York Knicks
20
0
4
0
2
1
0.6
1.0
1.778
0.76
2022-23
New York Knicks
13
0
4
0
0
0
1.3
1.4
1.554
0.67
2023-24
New York Knicks
2
0
0
0
0
0
0.7
1.5
1.362
0.57
2024-25
New York Knicks
2
0
0
0
0
0
1.3
1.6
1.554
0.66
2025-26
New York Knicks
6
0
0
0
2
0
1.3
1.4
1.650
0.72
2026-27
Boston Celtics
0
0
0
0
1
0
1.0
1.0
1.409
0.64
Career
—
67
0
22
0
14
3
1.0
1.3
1.630
0.70
Scoring, rebounding and assist trend
08 / SHOT CHART AND ZONE SHOOTING
Shot profile
Shot-location data is not connected. Add a BALLDONTLIE GOAT-tier NBA API key in NBA Players → Settings to enable shot charts and zone shooting.
LATEST UPDATERobinson went scoreless and didn't attempt a shot, but grabbed seven rebounds, added one assist and blocked three shots in 15 minutes during Sunday's 131-94 victory over the Mavericks.
Robinson made his presence felt defensively despite playing just 15 minutes, collecting three blocks and seven rebounds while Boston cruised to a comfortable win. His fantasy profile remains heavily dependent on rebounds, blocks and field-goal efficiency, as he rarely contributes meaningful scoring or playmaking. Sunday's workload was limited by the blowout, but his ability to produce defensive statistics in relatively few minutes remains useful for managers targeting those categories.


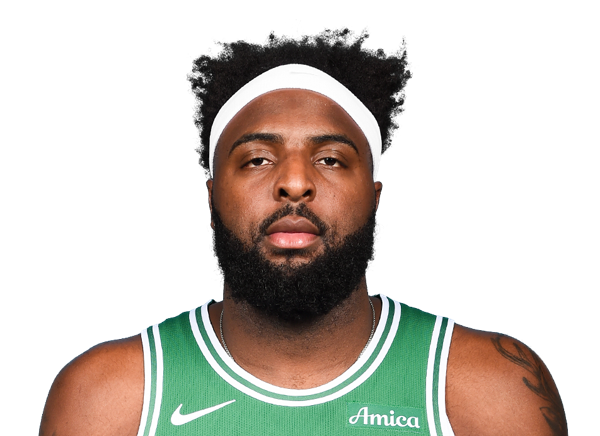

 Amari WilliamsF #77
 Baylor ScheiermanG #55
 Chris Cenac Jr.F #12
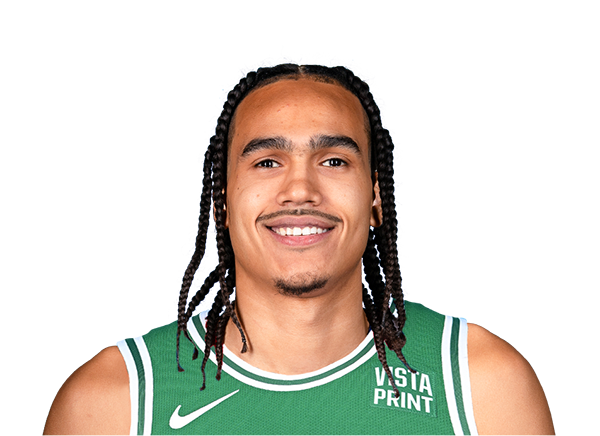 Dalano BantonF #45
 Derrick WhiteG #9
 Devin CarterG #99
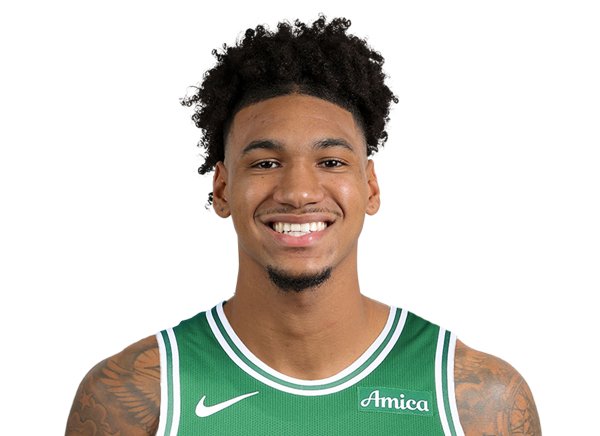 Dillon MitchellF #20
 Gabe McGlothanF #41
 Hayden GrayG #44
 Hugo GonzalezG #28
 Jayson TatumF
 Jordan SchakelG #20
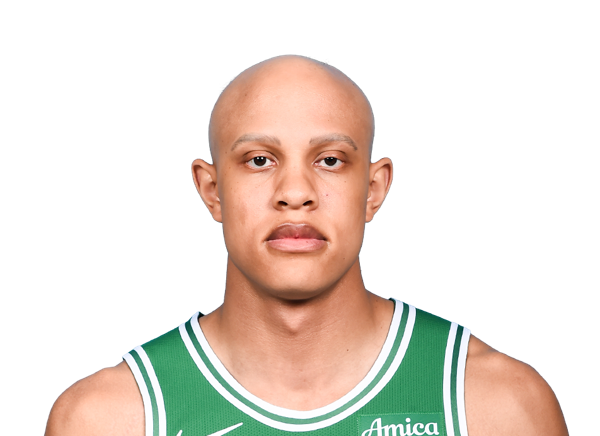 Jordan WalshG #27
 Luka GarzaC #52
 Max ShulgaG #44
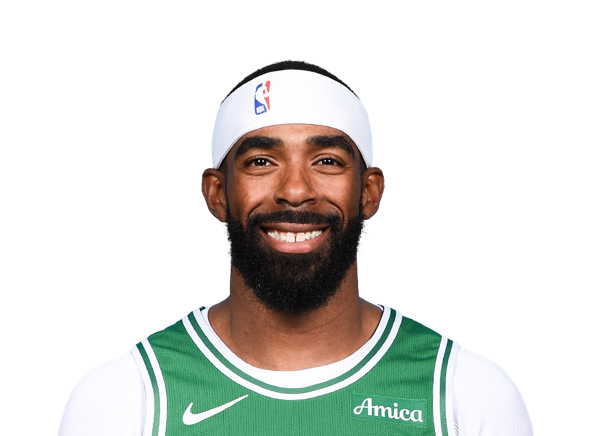 Mike ConleyG #45
 Milos UzanG #29
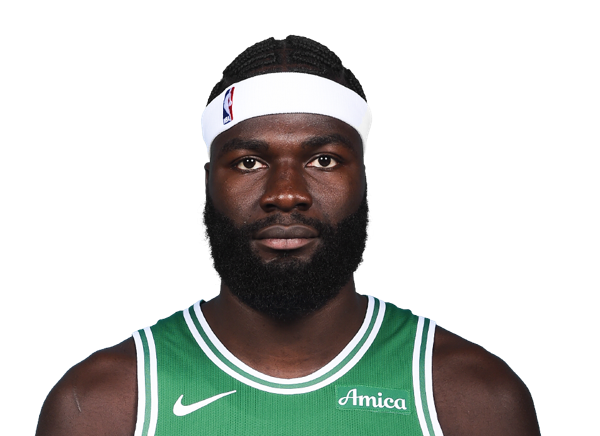 Neemias QuetaC #88
 Paul GeorgeF #13
 Payton PritchardG #11
 Ron Harper Jr.G #8
 Sam HauserF #30
 Tucker DeVriesF #26