Click a season to open this player’s full game log, splits and advanced stats for that year; click a team to open its page. A dash means no NBA games were recorded.
03 / EVERY CATEGORY THE PROVIDER REPORTS
Full statistical breakdown
Regular season 2026-27
Defensive
Metric
Total
NBA rank
Blocks
3
Tied-194th
Defensive Rebounds
21
Tied-238th
Steals
8
Tied-174th
Defensive Rebound Rate
0.0
—
Defensive Rebounds Per Game
1.5
233rd
Blocks Per Game
0.2
Tied-191st
Steals Per Game
0.6
189th
Defensive Rebounds Per 48
5.7
Tied-2,856th
Blocks Per 48
0.8
Tied-2,328th
Steals Per 48
2.2
Tied-2,088th
General
Metric
Total
NBA rank
Disqualifications
0
Tied-22nd
Flagrant Fouls
0
Tied-24th
Fouls
14
Tied-290th
Player Efficiency Rating
11.12
223rd
Rebound Rate
0.0
—
Ejections
0
Tied-7th
Technical Fouls
0
Tied-104th
Rebounds
32
—
Value Over Replacement Player
0.8
—
Minutes
177
4th
Minutes Per Game
12.6
—
Rating
7.7
Tied-103rd
Plus-Minus
+16
Tied-1st
Rebounds Per Game
2.3
Tied-230th
Fouls Per Game
1.0
Tied-269th
Flagrant Fouls Per Game
0.0
Tied-21st
Technical Fouls Per Game
0.0
Tied-84th
Ejections Per Game
0.0
Tied-6th
Disqualifications Per Game
0.0
Tied-21st
Assist To Turnover Ratio
0.8
—
Steal To Foul Ratio
0.6
—
Block To Foul Ratio
0.2
—
Team Rebounds Per Game
0.0
—
Rebounds
32
—
Total Technical Fouls
0
—
Assist To Turnover Ratio
0.0
—
Steal To Turnover Ratio
0.7
—
Rebounds Per 48 Minutes
8.7
—
Fouls Per 48 Minutes
3.8
Tied-3,480th
Flagrant Fouls Per 48 Minutes
0.0
Tied-288th
Technical Fouls Per 48 Minutes
0.0
Tied-1,248th
Ejections Per 48 Minutes
0.0
Tied-84th
Disqualifications Per 48 Minutes
0.0
Tied-264th
R/40
7.2
—
Games Played
14
14th
Games Started
3
Tied-181st
Double Double
0
Tied-121st
Triple Double
0
Tied-13th
Offensive
Metric
Total
NBA rank
Assists
9
Tied-292nd
Effective Field Goal Percentage
52.2
—
Field Goals
20/45
—
Field Goals Attempted
45
Tied-285th
Field Goals Made
20
Tied-280th
Field Goal Percentage
44.4
—
Free Throws
10/15
—
Free Throw Percentage
66.7
Tied-219th
Free Throws Attempted
15
Tied-214th
Free Throws Made
10
Tied-228th
Offensive Rebounds
11
Tied-156th
Points
57
Tied-279th
Turnovers
11
Tied-206th
3-Point Field Goal Percentage
25.9
232nd
3-Point Field Goals Attempted
27
Tied-224th
3-Point Field Goals Made
7
Tied-242nd
True Shooting Percentage
55.2
—
Total Turnovers
11
—
Assist Ratio
12.6
—
Points in the Paint
0
Tied-1st
Offensive Rebound Rate
0.0
—
Turnover Ratio
15.4
—
Brick Index
0.00
—
Usage Rate
0.0
—
Average Field Goals Made
1.4
—
Average Field Goals Attempted
3.2
130th
Average 3-Point Field Goals Made
0.5
—
Average 3-Point Field Goals Attempted
1.9
222nd
Average Free Throws Made
0.7
—
Average Free Throws Attempted
1.1
Tied-214th
Points Per Game
4.1
266th
Offensive Rebounds Per Game
0.8
Tied-167th
Assists Per Game
0.6
Tied-264th
Turnovers Per Game
0.8
213th
Offensive Rebound Percentage
0.4
—
Estimated Possessions
51.0
—
Estimated Possessions Per Game
3.6
—
Points Per Estimated Possession
1.1
—
Team Turnovers Per Game
0.0
—
Total Turnovers Per Game
0.8
—
3-Point Field Goal Percentage
25.9
—
2-Point Field Goals Made
13.0
Tied-38th
2-Point Field Goals Attempted
18.0
Tied-61st
2-Point Field Goals Made per Game
0.9
—
2-Point Field Goals Attempted per Game
1.3
—
2-Point Field Goal Percentage
72.2
—
Shooting Efficiency
0.52
—
Scoring Efficiency
1.267
—
Fieldgoals Made Per 48
5.4
Tied-3,360th
Fieldgoals Attempted Per 48
12.2
Tied-3,420th
3-Point Fieldgoals Made Per 48
1.9
Tied-2,904th
3-Point Fieldgoals Attempted Per 48
7.3
Tied-2,688th
Freethrows Made Per 48
2.7
Tied-2,736th
Freethrows Attempted Per 48
4.1
Tied-2,568th
Points Scored Per 48
15.5
Tied-3,348th
Offensive Rebounds Per 48
3.0
Tied-1,872nd
Assists Per 48
2.4
Tied-3,504th
Turnovers
3.0
Tied-2,472nd
P/40
12.9
—
A/40
2.0
—
04 / EFFICIENCY, SHOOTING PROFILE, PER-36
Advanced metrics
True shooting %55.6%
Effective FG %51.6%
2-point FG %69.2%
3-point attempt rate59.4%
Free throw rate34.4%
Points per shot attempt1.28
% of points from 3s36.6%
Assist-to-turnover0.75
Points per 36 min11.7
Rebounds per 36 min6.6
Assists per 36 min1.7
Steals per 36 min1.71
Blocks per 36 min0.57
Turnovers per 36 min2.29
Stocks (STL + BLK) per game0.80
Pts + Reb + Ast per game7.0
Efficiency (EFF) per game4.8
Game Score per game (Hollinger)3.2
Minutes per game12.6
Calculated by BallersCulture from the supplied 2026-27 box-score totals using standard formulas (hover a tile to see the formula). Tracking-based metrics such as BPM, VORP, on/off and RAPTOR are not available from this data source.
05 / 14 GAMES IN 2026-27
Game log: Regular season
Date
Opp
Result
MIN
FG
FG%
3PT
3P%
FT
FT%
REB
AST
BLK
STL
PF
TO
PTS
Nov 17
vs ORL
L 115-105
4
0-1
0.0
0-1
0.0
0-0
0.0
2
0
0
0
1
1
0
Nov 16
vs DAL
W 131-94
18
3-6
50.0
2-4
50.0
1-2
50.0
5
2
0
1
0
4
9
Nov 12
@ TOR
W 98-93
8
0-1
0.0
0-1
0.0
0-0
0.0
1
0
0
0
0
1
0
Nov 11
@ PHI
W 123-101
19
4-6
66.7
2-4
50.0
0-0
0.0
3
2
1
3
1
1
10
Nov 9
@ MIL
W 117-97
10
0-1
0.0
0-1
0.0
0-0
0.0
2
1
0
0
0
0
0
Nov 7
@ CHA
W 119-80
15
2-5
40.0
1-4
25.0
3-4
75.0
1
0
0
0
3
2
8
Nov 5
vs MIL
W 109-102
14
1-3
33.3
0-2
0.0
2-2
100.0
2
0
1
0
0
1
4
Nov 3
@ HOU
L 109-93
16
3-6
50.0
0-1
0.0
0-0
0.0
3
0
0
1
1
0
6
Nov 2
@ ORL
W 108-97
14
3-5
60.0
1-3
33.3
0-1
0.0
1
1
0
2
2
0
7
Oct 31
vs CHI
W 125-111
15
0-1
0.0
0-0
0.0
0-0
0.0
2
0
0
1
4
0
0
Oct 28
vs BKN
W 125-124 OT
6
0-2
0.0
0-1
0.0
0-0
0.0
2
0
0
0
1
1
0
Oct 27
vs CHI
W 134-99
24
4-6
66.7
1-3
33.3
4-6
66.7
5
2
1
0
1
0
13
Oct 24
vs NY
W 107-103
4
0-1
0.0
0-1
0.0
0-0
0.0
0
1
0
0
0
0
0
Oct 21
@ DET
L 121-113
10
0-1
0.0
0-1
0.0
0-0
0.0
3
0
0
0
0
0
0
06 / 2026-27 HOME / AWAY, RESULTS, MONTHS AND OPPONENTS
Splits
split
Split
GP
MIN
FG
FG%
3PT
3P%
FT
FT%
OR
DR
REB
AST
BLK
STL
PF
TO
PTS
All Splits
14
12.6
1.4-3.2
44.4
0.5-1.9
25.9
0.7-1.1
66.7
0.8
1.5
2.3
0.6
0.2
0.6
1.0
0.8
4.1
Home
7
12.1
1.1-2.9
40.0
0.4-1.7
25.0
1.0-1.4
70.0
0.9
1.7
2.6
0.7
0.3
0.3
1.0
1.0
3.7
Road
7
13.3
1.7-3.6
48.0
0.6-2.1
26.7
0.4-0.7
60.0
0.7
1.3
2.0
0.6
0.1
0.9
1.0
0.6
4.4
vs. Division
4
9.3
1.0-2.5
40.0
0.5-1.8
28.6
0.0-0.0
0.0
0.0
1.5
1.5
0.8
0.3
0.8
0.5
0.8
2.5
vs. Conference
12
11.9
1.2-2.8
42.4
0.4-1.8
22.7
0.8-1.1
69.2
0.3
1.7
2.0
0.6
0.3
0.5
1.1
0.6
3.5
3+ Days Rest
2
14.0
1.5-3.5
42.9
1.0-2.5
40.0
0.5-1.0
50.0
2.0
2.0
4.0
1.0
0.0
0.5
0.0
2.0
4.5
Month
Split
GP
MIN
FG
FG%
3PT
3P%
FT
FT%
OR
DR
REB
AST
BLK
STL
PF
TO
PTS
October
5
11.6
0.8-2.2
36.4
0.2-1.2
16.7
0.8-1.2
66.7
0.2
2.2
2.4
0.6
0.2
0.2
1.2
0.2
2.6
November
9
13.2
1.8-3.8
47.1
0.7-2.3
28.6
0.7-1.0
66.7
1.1
1.1
2.2
0.7
0.2
0.8
0.9
1.1
4.9
Pre All-Star
14
12.6
1.4-3.2
44.4
0.5-1.9
25.9
0.7-1.1
66.7
0.8
1.5
2.3
0.6
0.2
0.6
1.0
0.8
4.1
Result
Split
GP
MIN
FG
FG%
3PT
3P%
FT
FT%
OR
DR
REB
AST
BLK
STL
PF
TO
PTS
Wins
11
13.5
1.5-3.4
45.9
0.6-2.2
29.2
0.9-1.4
66.7
0.7
1.5
2.2
0.8
0.3
0.6
1.1
0.9
4.6
Losses
3
10.0
1.0-2.7
37.5
0.0-1.0
0.0
0.0-0.0
0.0
1.0
1.7
2.7
0.0
0.0
0.3
0.7
0.3
2.0
Position
Split
GP
MIN
FG
FG%
3PT
3P%
FT
FT%
OR
DR
REB
AST
BLK
STL
PF
TO
PTS
As Starter
3
14.7
2.3-4.7
50.0
0.3-2.0
16.7
0.7-1.0
66.7
1.7
0.3
2.0
0.3
0.3
1.0
1.0
0.3
5.7
Day
Split
GP
MIN
FG
FG%
3PT
3P%
FT
FT%
OR
DR
REB
AST
BLK
STL
PF
TO
PTS
Monday
3
14.7
2.3-4.3
53.8
0.3-1.7
20.0
1.3-2.0
66.7
1.3
2.0
3.3
0.7
0.3
0.3
1.0
0.3
6.3
Tuesday
3
11.7
1.3-3.0
44.4
0.7-2.0
33.3
0.0-0.0
0.0
0.0
2.7
2.7
0.7
0.3
1.0
0.7
0.7
3.3
Wednesday
2
11.5
0.5-2.0
25.0
0.0-1.5
0.0
1.0-1.0
100.0
0.5
1.0
1.5
0.0
0.5
0.0
0.0
1.0
2.0
Friday
3
11.3
0.7-2.3
28.6
0.3-1.7
20.0
1.0-1.3
75.0
0.0
1.0
1.0
0.3
0.0
0.3
2.3
0.7
2.7
Sunday
3
14.0
2.0-4.0
50.0
1.0-2.7
37.5
0.3-1.0
33.3
2.0
0.7
2.7
1.3
0.0
1.0
0.7
1.3
5.3
Opponent
Split
GP
MIN
FG
FG%
3PT
3P%
FT
FT%
OR
DR
REB
AST
BLK
STL
PF
TO
PTS
Brooklyn Nets
1
6.0
0.0-2.0
0.0
0.0-1.0
0.0
0.0-0.0
0.0
0.0
2.0
2.0
0.0
0.0
0.0
1.0
1.0
0.0
Charlotte Hornets
1
15.0
2.0-5.0
40.0
1.0-4.0
25.0
3.0-4.0
75.0
0.0
1.0
1.0
0.0
0.0
0.0
3.0
2.0
8.0
Chicago Bulls
2
19.5
2.0-3.5
57.1
0.5-1.5
33.3
2.0-3.0
66.7
0.5
3.0
3.5
1.0
0.5
0.5
2.5
0.0
6.5
Dallas Mavericks
1
18.0
3.0-6.0
50.0
2.0-4.0
50.0
1.0-2.0
50.0
4.0
1.0
5.0
2.0
0.0
1.0
0.0
4.0
9.0
Detroit Pistons
1
10.0
0.0-1.0
0.0
0.0-1.0
0.0
0.0-0.0
0.0
0.0
3.0
3.0
0.0
0.0
0.0
0.0
0.0
0.0
Houston Rockets
1
16.0
3.0-6.0
50.0
0.0-1.0
0.0
0.0-0.0
0.0
3.0
0.0
3.0
0.0
0.0
1.0
1.0
0.0
6.0
Milwaukee Bucks
2
12.0
0.5-2.0
25.0
0.0-1.5
0.0
1.0-1.0
100.0
1.0
1.0
2.0
0.5
0.5
0.0
0.0
0.5
2.0
New York Knicks
1
4.0
0.0-1.0
0.0
0.0-1.0
0.0
0.0-0.0
0.0
0.0
0.0
0.0
1.0
0.0
0.0
0.0
0.0
0.0
Orlando Magic
2
9.0
1.5-3.0
50.0
0.5-2.0
25.0
0.0-0.5
0.0
0.5
1.0
1.5
0.5
0.0
1.0
1.5
0.5
3.5
Philadelphia 76ers
1
19.0
4.0-6.0
66.7
2.0-4.0
50.0
0.0-0.0
0.0
0.0
3.0
3.0
2.0
1.0
3.0
1.0
1.0
10.0
Toronto Raptors
1
8.0
0.0-1.0
0.0
0.0-1.0
0.0
0.0-0.0
0.0
0.0
1.0
1.0
0.0
0.0
0.0
0.0
1.0
0.0
07 / SEASON-BY-SEASON HISTORY
Career statistics
Regular Season Averages
Season
Team
GP
GS
MIN
FG
FG%
3PT
3P%
FT
FT%
OR
DR
REB
AST
BLK
STL
PF
TO
PTS
2025-26
Boston Celtics
74
3
14.6
1.6-3.3
47.6
0.6-1.6
36.2
0.2-0.4
50.0
0.8
2.5
3.3
0.5
0.3
0.6
1.7
0.5
3.9
2026-27
Boston Celtics
14
3
12.6
1.4-3.2
44.4
0.5-1.9
25.9
0.7-1.1
66.7
0.8
1.5
2.3
0.6
0.2
0.6
1.0
0.8
4.1
Career
—
88
6
14.3
1.6-3.3
47.1
0.6-1.6
34.3
0.3-0.5
56.1
0.8
2.3
3.2
0.6
0.3
0.6
1.6
0.6
3.9
Regular Season Totals
Season
Team
FG
FG%
3PT
3P%
FT
FT%
OR
DR
REB
AST
BLK
STL
PF
TO
PTS
2025-26
Boston Celtics
117-246
47.6
42-116
36.2
13-26
50.0
62
184
246
40
21
42
124
38
289
2026-27
Boston Celtics
20-45
44.4
7-27
25.9
10-15
66.7
11
21
32
9
3
8
14
11
57
Career
—
137-291
47.1
49-143
34.3
23-41
56.1
73
205
278
49
24
50
138
49
346
Regular Season Misc Totals
Season
Team
DD2
TD3
DQ
EJECT
TECH
FLAG
AST/TO
STL/TO
SC-EFF
SH-EFF
2025-26
Boston Celtics
2
0
0
0
0
0
1.1
1.1
1.175
0.56
2026-27
Boston Celtics
0
0
0
0
0
0
0.8
0.7
1.267
0.52
Career
—
2
0
0
0
0
0
1.0
1.0
1.189
0.55
Scoring, rebounding and assist trend
08 / SHOT CHART AND ZONE SHOOTING
Shot profile
Shot-location data is not connected. Add a BALLDONTLIE GOAT-tier NBA API key in NBA Players → Settings to enable shot charts and zone shooting.
LATEST UPDATEGonzalez is not listed in the starting lineup for Friday's game against Charlotte, Sean Grande of NBC Sports Boston reports.
Gonzalez started in the Celtics' last three regular-season contests. He will head back to the bench for Friday's NBA Cup meeting with the Hornets, though he should still get opportunities as a reserve.




 Amari WilliamsF #77
 Baylor ScheiermanG #55
 Chris Cenac Jr.F #12
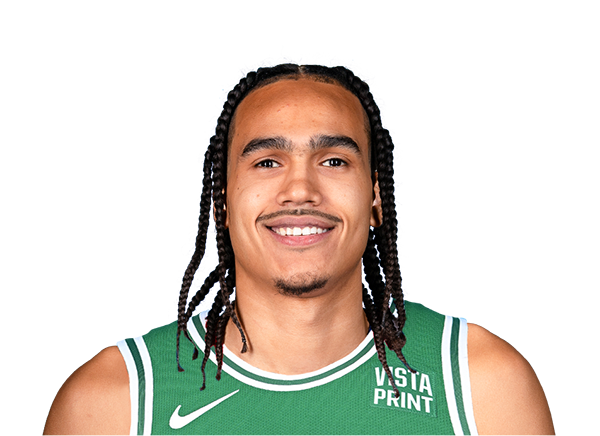 Dalano BantonF #45
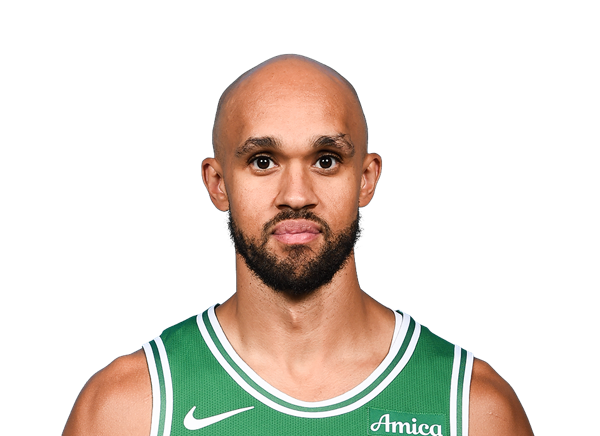 Derrick WhiteG #9
 Devin CarterG #99
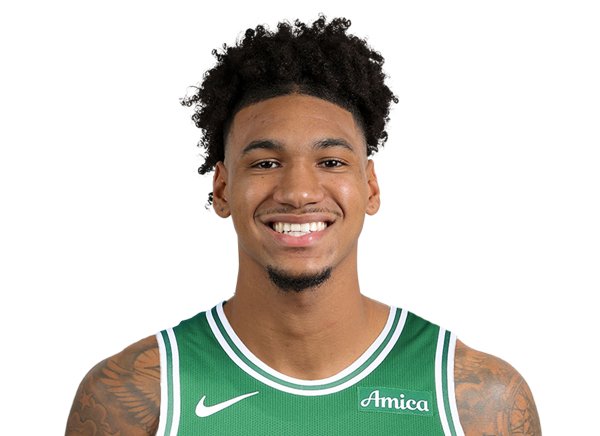 Dillon MitchellF #20
 Gabe McGlothanF #41
 Hayden GrayG #44
 Jayson TatumF
 Jordan SchakelG #20
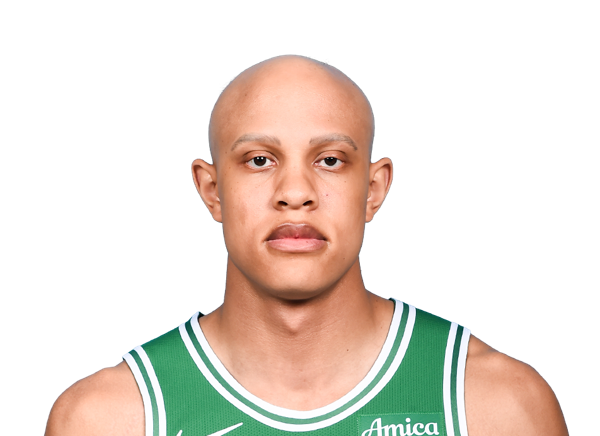 Jordan WalshG #27
 Luka GarzaC #52
 Max ShulgaG #44
 Mike ConleyG #45
 Milos UzanG #29
 Mitchell RobinsonC #4
 Neemias QuetaC #88
 Paul GeorgeF #13
 Payton PritchardG #11
 Ron Harper Jr.G #8
 Sam HauserF #30
 Tucker DeVriesF #26