Click a season to open this player’s full game log, splits and advanced stats for that year; click a team to open its page. A dash means no NBA games were recorded.
03 / EVERY CATEGORY THE PROVIDER REPORTS
Full statistical breakdown
Regular season 2026-27
Defensive
Metric
Total
NBA rank
Blocks
1
Tied-289th
Defensive Rebounds
34
Tied-144th
Steals
6
Tied-217th
Defensive Rebound Rate
0.0
—
Defensive Rebounds Per Game
2.6
Tied-161st
Blocks Per Game
0.1
Tied-257th
Steals Per Game
0.5
215th
Defensive Rebounds Per 48
6.2
2,304th
Blocks Per 48
0.2
4,624th
Steals Per 48
1.1
3,472nd
General
Metric
Total
NBA rank
Disqualifications
0
Tied-21st
Flagrant Fouls
0
Tied-22nd
Fouls
20
Tied-214th
Player Efficiency Rating
14.86
143rd
Rebound Rate
0.0
—
Ejections
0
Tied-7th
Technical Fouls
0
Tied-101st
Rebounds
43
—
Value Over Replacement Player
0.0
—
Minutes
263
Tied-3rd
Minutes Per Game
20.2
—
Rating
14.7
Tied-89th
Plus-Minus
+131
Tied-1st
Rebounds Per Game
3.3
176th
Fouls Per Game
1.5
Tied-221st
Flagrant Fouls Per Game
0.0
Tied-19th
Technical Fouls Per Game
0.0
Tied-82nd
Ejections Per Game
0.0
Tied-6th
Disqualifications Per Game
0.0
Tied-20th
Assist To Turnover Ratio
6.5
—
Steal To Foul Ratio
0.3
—
Block To Foul Ratio
0.1
—
Team Rebounds Per Game
0.0
—
Rebounds
43
—
Total Technical Fouls
0
—
Assist To Turnover Ratio
0.0
—
Steal To Turnover Ratio
3.0
—
Rebounds Per 48 Minutes
7.8
—
Fouls Per 48 Minutes
3.7
3,424th
Flagrant Fouls Per 48 Minutes
0.0
352nd
Technical Fouls Per 48 Minutes
0.0
1,616th
Ejections Per 48 Minutes
0.0
112th
Disqualifications Per 48 Minutes
0.0
336th
R/40
6.5
—
Games Played
13
13th
Games Started
1
Tied-219th
Double Double
0
Tied-119th
Triple Double
0
Tied-12th
Offensive
Metric
Total
NBA rank
Assists
13
Tied-253rd
Effective Field Goal Percentage
66.0
—
Field Goals
37/78
—
Field Goals Attempted
78
Tied-181st
Field Goals Made
37
Tied-176th
Field Goal Percentage
47.4
—
Free Throws
2/2
—
Free Throw Percentage
100.0
Tied-1st
Free Throws Attempted
2
Tied-370th
Free Throws Made
2
Tied-355th
Offensive Rebounds
9
Tied-187th
Points
105
Tied-172nd
Turnovers
2
Tied-365th
3-Point Field Goal Percentage
44.6
37th
3-Point Field Goals Attempted
65
75th
3-Point Field Goals Made
29
Tied-38th
True Shooting Percentage
66.6
—
Total Turnovers
2
—
Assist Ratio
13.8
—
Points in the Paint
0
Tied-1st
Offensive Rebound Rate
0.0
—
Turnover Ratio
2.1
—
Brick Index
0.00
—
Usage Rate
0.0
—
Average Field Goals Made
2.8
—
Average Field Goals Attempted
6.0
Tied-247th
Average 3-Point Field Goals Made
2.2
Tied-50th
Average 3-Point Field Goals Attempted
5.0
Tied-80th
Average Free Throws Made
0.2
—
Average Free Throws Attempted
0.2
281st
Points Per Game
8.1
180th
Offensive Rebounds Per Game
0.7
Tied-190th
Assists Per Game
1.0
Tied-231st
Turnovers Per Game
0.2
281st
Offensive Rebound Percentage
0.2
—
Estimated Possessions
71.8
—
Estimated Possessions Per Game
5.5
—
Points Per Estimated Possession
1.5
—
Team Turnovers Per Game
0.0
—
Total Turnovers Per Game
0.2
—
3-Point Field Goal Percentage
44.6
24th
2-Point Field Goals Made
8.0
Tied-138th
2-Point Field Goals Attempted
13.0
Tied-256th
2-Point Field Goals Made per Game
0.6
—
2-Point Field Goals Attempted per Game
1.0
—
2-Point Field Goal Percentage
61.5
—
Shooting Efficiency
0.66
—
Scoring Efficiency
1.346
—
Fieldgoals Made Per 48
6.8
2,816th
Fieldgoals Attempted Per 48
14.2
2,896th
3-Point Fieldgoals Made Per 48
5.3
608th
3-Point Fieldgoals Attempted Per 48
11.9
Tied-1,200th
Freethrows Made Per 48
0.4
5,680th
Freethrows Attempted Per 48
0.4
5,920th
Points Scored Per 48
19.2
2,752nd
Offensive Rebounds Per 48
1.6
2,992nd
Assists Per 48
2.4
4,048th
Turnovers
0.4
5,840th
P/40
16.0
—
A/40
2.0
—
04 / EFFICIENCY, SHOOTING PROFILE, PER-36
Advanced metrics
True shooting %66.5%
Effective FG %65.0%
2-point FG %60.0%
3-point attempt rate83.3%
Free throw rate3.3%
Points per shot attempt1.35
% of points from 3s81.5%
Assist-to-turnover5.00
Points per 36 min14.4
Rebounds per 36 min5.9
Assists per 36 min1.8
Steals per 36 min0.89
Blocks per 36 min0.18
Turnovers per 36 min0.36
Stocks (STL + BLK) per game0.60
Pts + Reb + Ast per game12.4
Efficiency (EFF) per game9.6
Game Score per game (Hollinger)6.8
Minutes per game20.2
Calculated by BallersCulture from the supplied 2026-27 box-score totals using standard formulas (hover a tile to see the formula). Tracking-based metrics such as BPM, VORP, on/off and RAPTOR are not available from this data source.
05 / 13 GAMES IN 2026-27
Game log: Regular season
Date
Opp
Result
MIN
FG
FG%
3PT
3P%
FT
FT%
REB
AST
BLK
STL
PF
TO
PTS
Nov 16
vs DAL
W 131-94
11
3-4
75.0
2-3
66.7
0-0
0.0
1
0
0
2
0
0
8
Nov 12
@ TOR
W 98-93
24
2-6
33.3
2-4
50.0
2-2
100.0
9
0
0
2
2
1
8
Nov 11
@ PHI
W 123-101
18
4-6
66.7
4-6
66.7
0-0
0.0
4
2
0
0
1
0
12
Nov 9
@ MIL
W 117-97
23
3-5
60.0
1-3
33.3
0-0
0.0
3
1
0
0
1
1
7
Nov 7
@ CHA
W 119-80
17
3-5
60.0
3-5
60.0
0-0
0.0
3
3
1
0
1
0
9
Nov 5
vs MIL
W 109-102
30
4-11
36.4
3-10
30.0
0-0
0.0
2
0
0
0
1
0
11
Nov 3
@ HOU
L 109-93
19
1-6
16.7
0-5
0.0
0-0
0.0
2
1
0
1
1
0
2
Nov 2
@ ORL
W 108-97
17
1-3
33.3
1-3
33.3
0-0
0.0
2
0
0
1
3
0
3
Oct 31
vs CHI
W 125-111
18
2-4
50.0
2-4
50.0
0-0
0.0
3
2
0
0
1
0
6
Oct 28
vs BKN
W 125-124 OT
25
4-9
44.4
3-8
37.5
0-0
0.0
4
0
0
0
2
0
11
Oct 27
vs CHI
W 134-99
20
4-7
57.1
3-4
75.0
0-0
0.0
4
1
0
0
4
0
11
Oct 24
vs NY
W 107-103
23
2-5
40.0
2-5
40.0
0-0
0.0
2
2
0
0
0
0
6
Oct 21
@ DET
L 121-113
18
4-7
57.1
3-5
60.0
0-0
0.0
4
1
0
0
3
0
11
06 / 2026-27 HOME / AWAY, RESULTS, MONTHS AND OPPONENTS
Splits
split
Split
GP
MIN
FG
FG%
3PT
3P%
FT
FT%
OR
DR
REB
AST
BLK
STL
PF
TO
PTS
All Splits
13
20.2
2.8-6.0
47.4
2.2-5.0
44.6
0.2-0.2
100.0
0.7
2.6
3.3
1.0
0.1
0.5
1.5
0.2
8.1
Home
6
21.0
3.2-6.7
47.5
2.5-5.7
44.1
0.0-0.0
0.0
0.5
2.2
2.7
0.8
0.0
0.3
1.3
0.0
8.8
Road
7
19.6
2.6-5.4
47.4
2.0-4.4
45.2
0.3-0.3
100.0
0.9
3.0
3.9
1.1
0.1
0.6
1.7
0.3
7.4
vs. Division
4
22.3
3.0-6.5
46.2
2.8-5.8
47.8
0.5-0.5
100.0
0.8
4.0
4.8
1.0
0.0
0.5
1.3
0.3
9.3
vs. Conference
11
21.2
3.0-6.2
48.5
2.5-5.2
47.4
0.2-0.2
100.0
0.7
2.9
3.6
1.1
0.1
0.3
1.7
0.2
8.6
3+ Days Rest
2
14.5
3.5-5.5
63.6
2.5-4.0
62.5
0.0-0.0
0.0
0.5
2.0
2.5
0.5
0.0
1.0
1.5
0.0
9.5
Month
Split
GP
MIN
FG
FG%
3PT
3P%
FT
FT%
OR
DR
REB
AST
BLK
STL
PF
TO
PTS
October
5
20.8
3.2-6.4
50.0
2.6-5.2
50.0
0.0-0.0
0.0
0.6
2.8
3.4
1.2
0.0
0.0
2.0
0.0
9.0
November
8
19.9
2.6-5.8
45.7
2.0-4.9
41.0
0.3-0.3
100.0
0.8
2.5
3.3
0.9
0.1
0.8
1.3
0.3
7.5
Pre All-Star
13
20.2
2.8-6.0
47.4
2.2-5.0
44.6
0.2-0.2
100.0
0.7
2.6
3.3
1.0
0.1
0.5
1.5
0.2
8.1
Result
Split
GP
MIN
FG
FG%
3PT
3P%
FT
FT%
OR
DR
REB
AST
BLK
STL
PF
TO
PTS
Wins
11
20.5
2.9-5.9
49.2
2.4-5.0
47.3
0.2-0.2
100.0
0.6
2.7
3.4
1.0
0.1
0.5
1.5
0.2
8.4
Losses
2
18.5
2.5-6.5
38.5
1.5-5.0
30.0
0.0-0.0
0.0
1.0
2.0
3.0
1.0
0.0
0.5
2.0
0.0
6.5
Position
Split
GP
MIN
FG
FG%
3PT
3P%
FT
FT%
OR
DR
REB
AST
BLK
STL
PF
TO
PTS
As Starter
1
30.0
4.0-11.0
36.4
3.0-10.0
30.0
0.0-0.0
0.0
1.0
1.0
2.0
0.0
0.0
0.0
1.0
0.0
11.0
Day
Split
GP
MIN
FG
FG%
3PT
3P%
FT
FT%
OR
DR
REB
AST
BLK
STL
PF
TO
PTS
Monday
2
19.5
2.5-6.5
38.5
1.5-4.5
33.3
0.0-0.0
0.0
1.5
1.5
3.0
1.0
0.0
0.5
2.5
0.0
6.5
Tuesday
3
20.3
4.0-7.3
54.5
3.3-6.3
52.6
0.0-0.0
0.0
0.3
3.7
4.0
1.0
0.0
0.0
2.0
0.0
11.3
Wednesday
2
27.0
3.0-8.5
35.3
2.5-7.0
35.7
1.0-1.0
100.0
2.0
3.5
5.5
0.0
0.0
1.0
1.5
0.5
9.5
Friday
3
19.3
2.3-4.7
50.0
2.3-4.7
50.0
0.0-0.0
0.0
0.0
2.7
2.7
2.3
0.3
0.0
0.7
0.0
7.0
Sunday
3
17.0
2.3-4.0
58.3
1.3-3.0
44.4
0.0-0.0
0.0
0.3
1.7
2.0
0.3
0.0
1.0
1.3
0.3
6.0
Opponent
Split
GP
MIN
FG
FG%
3PT
3P%
FT
FT%
OR
DR
REB
AST
BLK
STL
PF
TO
PTS
Brooklyn Nets
1
25.0
4.0-9.0
44.4
3.0-8.0
37.5
0.0-0.0
0.0
0.0
4.0
4.0
0.0
0.0
0.0
2.0
0.0
11.0
Charlotte Hornets
1
17.0
3.0-5.0
60.0
3.0-5.0
60.0
0.0-0.0
0.0
0.0
3.0
3.0
3.0
1.0
0.0
1.0
0.0
9.0
Chicago Bulls
2
19.0
3.0-5.5
54.5
2.5-4.0
62.5
0.0-0.0
0.0
1.0
2.5
3.5
1.5
0.0
0.0
2.5
0.0
8.5
Dallas Mavericks
1
11.0
3.0-4.0
75.0
2.0-3.0
66.7
0.0-0.0
0.0
0.0
1.0
1.0
0.0
0.0
2.0
0.0
0.0
8.0
Detroit Pistons
1
18.0
4.0-7.0
57.1
3.0-5.0
60.0
0.0-0.0
0.0
1.0
3.0
4.0
1.0
0.0
0.0
3.0
0.0
11.0
Houston Rockets
1
19.0
1.0-6.0
16.7
0.0-5.0
0.0
0.0-0.0
0.0
1.0
1.0
2.0
1.0
0.0
1.0
1.0
0.0
2.0
Milwaukee Bucks
2
26.5
3.5-8.0
43.8
2.0-6.5
30.8
0.0-0.0
0.0
1.0
1.5
2.5
0.5
0.0
0.0
1.0
0.5
9.0
New York Knicks
1
23.0
2.0-5.0
40.0
2.0-5.0
40.0
0.0-0.0
0.0
0.0
2.0
2.0
2.0
0.0
0.0
0.0
0.0
6.0
Orlando Magic
1
17.0
1.0-3.0
33.3
1.0-3.0
33.3
0.0-0.0
0.0
0.0
2.0
2.0
0.0
0.0
1.0
3.0
0.0
3.0
Philadelphia 76ers
1
18.0
4.0-6.0
66.7
4.0-6.0
66.7
0.0-0.0
0.0
0.0
4.0
4.0
2.0
0.0
0.0
1.0
0.0
12.0
Toronto Raptors
1
24.0
2.0-6.0
33.3
2.0-4.0
50.0
2.0-2.0
100.0
3.0
6.0
9.0
0.0
0.0
2.0
2.0
1.0
8.0
07 / SEASON-BY-SEASON HISTORY
Career statistics
Regular Season Averages
Season
Team
GP
GS
MIN
FG
FG%
3PT
3P%
FT
FT%
OR
DR
REB
AST
BLK
STL
PF
TO
PTS
2021-22
Boston Celtics
26
0
6.1
0.9-1.9
46.0
0.7-1.7
43.2
0.0-0.0
0.0
0.2
0.9
1.1
0.4
0.1
0.0
0.3
0.1
2.5
2022-23
Boston Celtics
80
8
16.1
2.3-5.0
45.5
1.8-4.2
41.8
0.2-0.2
70.6
0.4
2.1
2.6
0.9
0.3
0.4
1.2
0.4
6.4
2023-24
Boston Celtics
79
13
22.0
3.2-7.1
44.6
2.5-5.9
42.4
0.2-0.2
89.5
0.6
2.9
3.5
1.0
0.3
0.5
1.3
0.4
9.0
2024-25
Boston Celtics
71
19
21.7
3.0-6.7
45.1
2.3-5.6
41.6
0.2-0.2
100.0
0.6
2.5
3.2
0.9
0.2
0.6
1.2
0.3
8.5
2025-26
Boston Celtics
78
49
24.8
3.2-7.7
41.9
2.5-6.5
39.3
0.2-0.3
85.0
0.7
3.1
3.8
1.5
0.3
0.5
1.4
0.4
9.2
2026-27
Boston Celtics
13
1
20.2
2.8-6.0
47.4
2.2-5.0
44.6
0.2-0.2
100.0
0.7
2.6
3.3
1.0
0.1
0.5
1.5
0.2
8.1
Career
—
347
90
20.0
2.8-6.2
44.3
2.2-5.2
41.3
0.2-0.2
85.5
0.6
2.5
3.1
1.0
0.2
0.4
1.2
0.4
7.8
Regular Season Totals
Season
Team
FG
FG%
3PT
3P%
FT
FT%
OR
DR
REB
AST
BLK
STL
PF
TO
PTS
2021-22
Boston Celtics
23-50
46.0
19-44
43.2
0-0
0.0
5
24
29
10
2
1
7
2
65
2022-23
Boston Celtics
180-396
45.5
140-335
41.8
12-17
70.6
35
169
204
71
21
29
99
30
512
2023-24
Boston Celtics
249-558
44.6
197-465
42.4
17-19
89.5
45
231
276
82
25
40
99
32
712
2024-25
Boston Celtics
214-474
45.1
166-399
41.6
11-11
100.0
44
180
224
64
13
41
87
23
605
2025-26
Boston Celtics
252-601
41.9
198-504
39.3
17-20
85.0
56
244
300
114
23
38
113
35
719
2026-27
Boston Celtics
37-78
47.4
29-65
44.6
2-2
100.0
9
34
43
13
1
6
20
2
105
Career
—
955-2157
44.3
749-1812
41.3
59-69
85.5
194
882
1076
354
85
155
425
124
2718
Regular Season Misc Totals
Season
Team
DD2
TD3
DQ
EJECT
TECH
FLAG
AST/TO
STL/TO
SC-EFF
SH-EFF
2021-22
Boston Celtics
0
0
0
0
0
0
5.0
0.5
1.300
0.65
2022-23
Boston Celtics
0
0
0
0
0
0
2.4
1.0
1.293
0.63
2023-24
Boston Celtics
0
0
0
0
0
0
2.6
1.3
1.276
0.62
2024-25
Boston Celtics
0
0
0
0
0
0
2.8
1.8
1.276
0.63
2025-26
Boston Celtics
0
0
0
0
0
0
3.3
1.1
1.196
0.58
2026-27
Boston Celtics
0
0
0
0
0
0
6.5
3.0
1.346
0.66
Career
—
0
0
0
0
0
0
2.9
1.3
1.260
0.62
Scoring, rebounding and assist trend
08 / SHOT CHART AND ZONE SHOOTING
Shot profile
Shot-location data is not connected. Add a BALLDONTLIE GOAT-tier NBA API key in NBA Players → Settings to enable shot charts and zone shooting.
LATEST UPDATEHauser ended Tuesday's 123-101 victory over Philadelphia with 12 points (4-6 FG, 4-6 3Pt), five rebounds and two assists across 18 minutes.
The 12 points were a season-high output for Hauser, and this was the fifth time this season he's notched double-digit points. The 18-minute workload restricted his overall fantasy ceiling, but Hauser remains a specialist in three-point shooting, so he's better suited to be a waiver-wire pickup in category-based leagues rather than in standard formats.




 Amari WilliamsF #77
 Baylor ScheiermanG #55
 Chris Cenac Jr.F #12
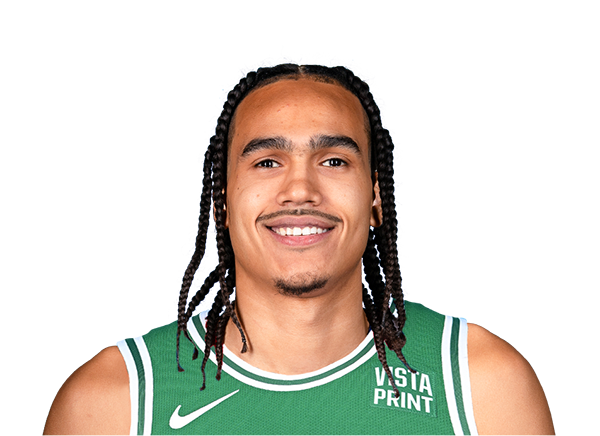 Dalano BantonF #45
 Derrick WhiteG #9
 Devin CarterG #99
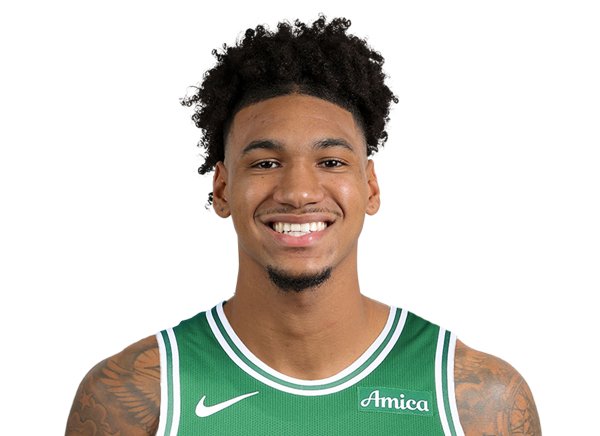 Dillon MitchellF #20
 Gabe McGlothanF #41
 Hayden GrayG #44
 Hugo GonzalezG #28
 Jayson TatumF
 Jordan SchakelG #20
 Jordan WalshG #27
 Luka GarzaC #52
 Max ShulgaG #44
 Mike ConleyG #45
 Milos UzanG #29
 Mitchell RobinsonC #4
 Neemias QuetaC #88
 Paul GeorgeF #13
 Payton PritchardG #11
 Ron Harper Jr.G #8
 Tucker DeVriesF #26